Fig. 3.

Download original image
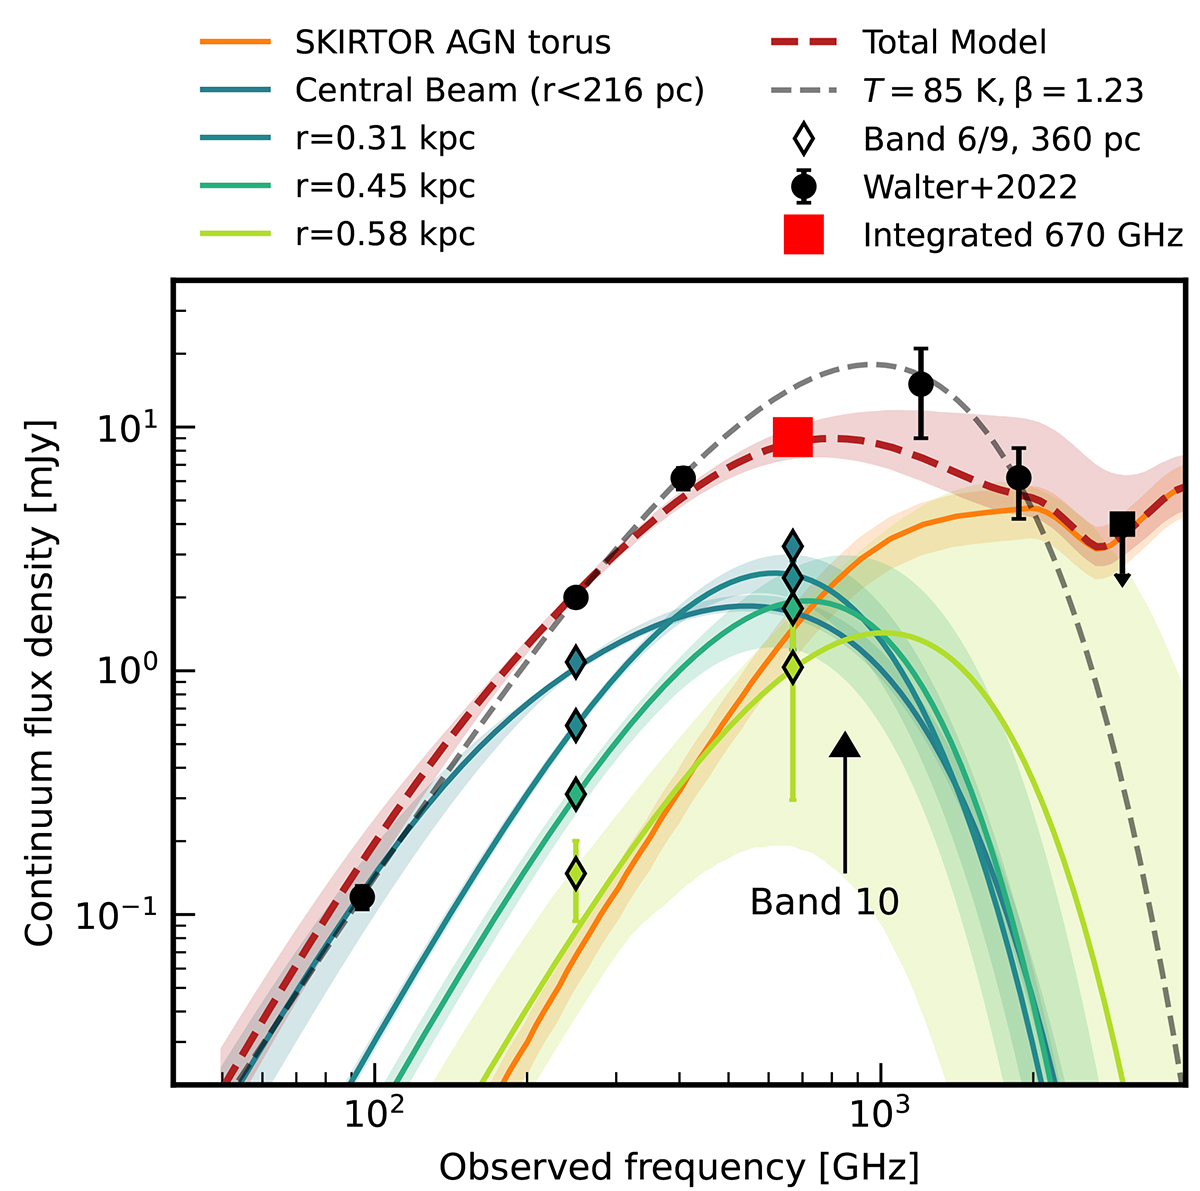
FIR SED of J2348–3054. We show the constraints from ALMA, ACA and Herschel/PACS (Venemans et al. 2017; Walter et al. 2022) in black as well as our Band 9 integrated measurement in red. The dashed grey line show the single optically-thin emission model of (Walter et al. 2022) which does not reproduce the Band 9 continuum. The 360 pc resolved 250 and 670 GHz continuum fluxes are present in colored diamonds. The total SED, composed of the sum of the individual annuli SED and the SKIRTOR torus (shaded lines), is shown in dashed red and shaded area. Further ALMA Band 10 (resolved) observations could constrain the properties of the dust torus, which would contribute ![]() in the central pixel at
in the central pixel at ![]() .
.
Current usage metrics show cumulative count of Article Views (full-text article views including HTML views, PDF and ePub downloads, according to the available data) and Abstracts Views on Vision4Press platform.
Data correspond to usage on the plateform after 2015. The current usage metrics is available 48-96 hours after online publication and is updated daily on week days.
Initial download of the metrics may take a while.


