Fig. 4.
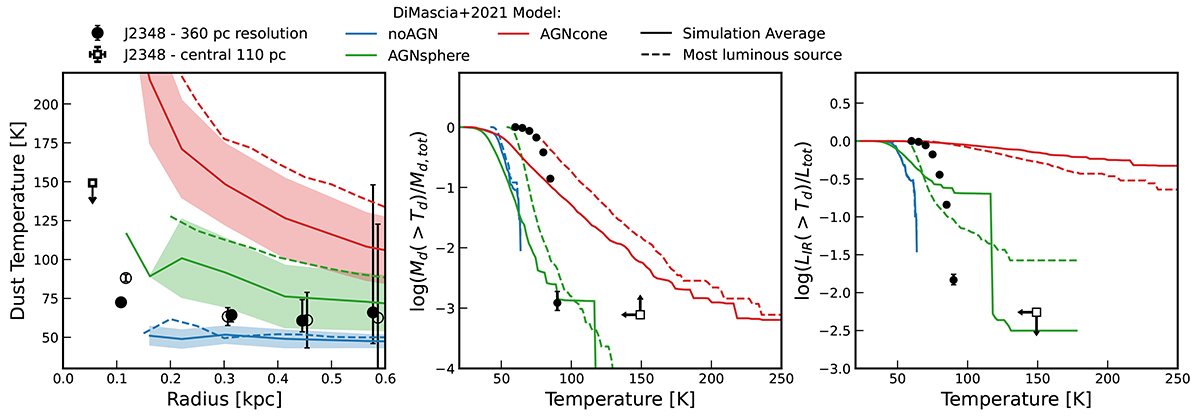
Download original image
Comparison between our observations and simulations by Di Mascia et al. (2021). We show the simulated profiles for the most luminous source in the simulations in dashed lines and the average profile of all sources in the simulation with full lines. We show the constraints from the matched-resolution (360 pc) ALMA Band 9 and Band 6 data in full datapoints, as well as the central limits on the inner r < 110 pc region with an open square (see further text). Left: Radially averaged dust temperature profile. We indicate the dust temperature inferred from the simultaneous fit in full circles, and that from independent fit not taking the total FIR SED into account with open circles (see Appendix D). Middle: Mass fraction as a function of the dust temperature. Right: Total IR luminosity (8–1000 μm) fraction as a function of the dust temperature.
Current usage metrics show cumulative count of Article Views (full-text article views including HTML views, PDF and ePub downloads, according to the available data) and Abstracts Views on Vision4Press platform.
Data correspond to usage on the plateform after 2015. The current usage metrics is available 48-96 hours after online publication and is updated daily on week days.
Initial download of the metrics may take a while.