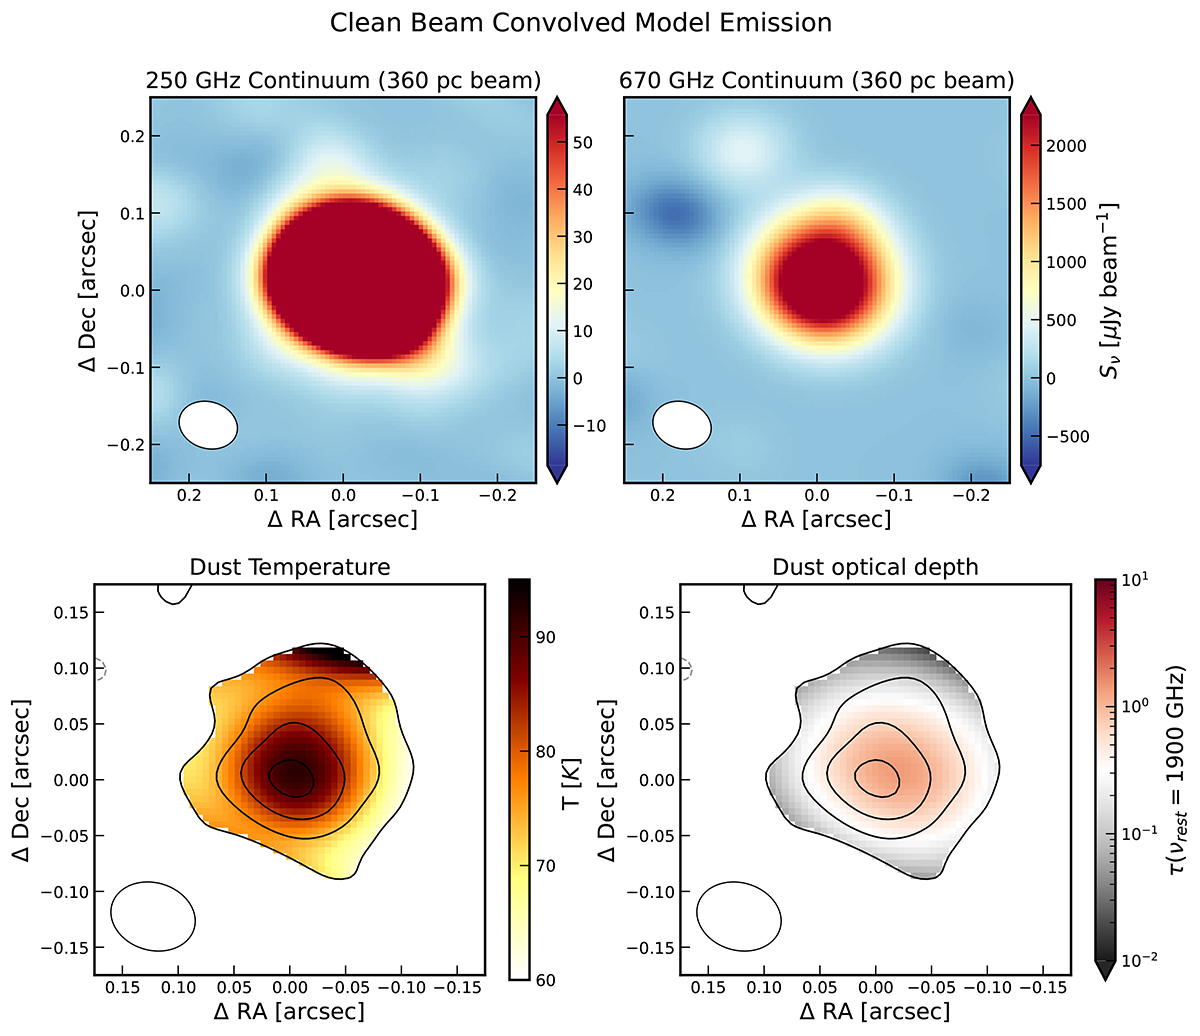
Fig. B.1.
Download original image
Top row: Model components (convolved by the clean beam) of the emission in the continuum maps at 250 and 670 GHz. The color scales are the same as in Fig. 1. Bottom row: Corresponding maps of the dust temperature (top left) and dust optical depth (top right). The color scales are the same as in 2. We observe a similar dust temperature and opacity gradient, confirming our results in Fig. 2 are not driven by the beam of the Band 6 or 9 observations.
Current usage metrics show cumulative count of Article Views (full-text article views including HTML views, PDF and ePub downloads, according to the available data) and Abstracts Views on Vision4Press platform.
Data correspond to usage on the plateform after 2015. The current usage metrics is available 48-96 hours after online publication and is updated daily on week days.
Initial download of the metrics may take a while.