| Issue |
A&A
Volume 695, March 2025
|
|
|---|---|---|
| Article Number | A11 | |
| Number of page(s) | 10 | |
| Section | Stellar structure and evolution | |
| DOI | https://doi.org/10.1051/0004-6361/202452473 | |
| Published online | 26 February 2025 | |
Exploring the capability of the HH 80-81 protostellar jet to accelerate relativistic particles
1
Instituto de Astrofísica de Andalucía (IAA), CSIC, 18008 Granada, Spain
2
Deutsches Elektronen-Synchrotron DESY, Platanenallee 6, 15738 Zeuthen, Germany
⋆ Corresponding author; This email address is being protected from spambots. You need JavaScript enabled to view it.
Received:
3
October
2024
Accepted:
24
January
2025
Abstract
Context. Protostellar jets driven by massive protostars are collimated outflows producing high-speed shocks through dense interstellar medium. Fast shocks can accelerate particles up to relativistic energies via diffusive shock acceleration, producing non-thermal emission that can generate γ-ray photons. HH 80-81 is one of the most powerful collimated protostellar jets in our Galaxy, with non-thermal emission detected in radio, X-ray, and γ-ray bands. Characterizing the γ-ray emission that originates in the accelerated particles of the region is crucial for demonstrating the capability of protostars to accelerate cosmic rays.
Aims. Our goal is to determine the particle distribution that is producing the γ-ray spectrum of HH 80-81 in order to ascertain the leptonic or hadronic origin of the γ-ray emission. We aim to associate the high-energy emission in the region with the HH 80-81 system, characterize its spectrum, and elaborate emission models based on what we expect from the diffusive shock acceleration.
Methods. We use the 15 yr database provided by the Fermi-LAT satellite to study the high-energy emission of the jet, spanning from 300 MeV to 100 GeV. In addition, we perform a source association based on positional arguments. Then, we employ the naima and Gamera softwares to analyze the possible mechanisms that are producing γ-rays, considering the ambient conditions. We perform a radiative fitting and study the nature of the particles behind the γ-ray emission.
Results. By analyzing all the candidates to produce the γ-ray emission that we detect, we conclude that HH 80-81 is the most probable candidate to explain the γ-ray emission in the region. The detected spectrum can be explained by both hadronic and leptonic particle components.
Key words: acceleration of particles / radiation mechanisms: non-thermal / cosmic rays / Herbig-Haro objects / gamma rays: stars / ISM: individual objects: HH 80-81
© The Authors 2025
 Open Access article, published by EDP Sciences, under the terms of the Creative Commons Attribution License (https://creativecommons.org/licenses/by/4.0), which permits unrestricted use, distribution, and reproduction in any medium, provided the original work is properly cited.
This article is published in open access under the Subscribe to Open model. This email address is being protected from spambots. You need JavaScript enabled to view it. to support open access publication.
1. Introduction
Massive young stellar objects (MYSOs), typically characterized by masses above 8 M⊙, have been objects of study due to their unique properties and their impact on star-forming regions. Massive protostars have higher luminosities than low-mass protostars, regulating the star-forming environments heating and ionizing the medium (Tan et al. 2014; Kölligan & Kuiper 2018). In addition, their powerful stellar winds and jets are essential to understand the mechanical feedback of the star-forming complexes, affecting the entire population of star-forming objects in the region. Evolutionary models indicate that MYSOs evolve rapidly, reaching the zero-age main-sequence stage while still embedded within the giant molecular clouds, where the star formation takes place in the Galaxy (Kahn 1974; Wolfire & Cassinelli 1987). This rapid evolution limits their capability to continue accreting mass. However, the detection of significantly more massive stellar objects highlights the necessity for mechanisms enabling the effective mass accretion once the star begins heating the surrounding medium. Theoretical studies approach this issue using massive accretion disks and collimated jets (Hosokawa et al. 2010; Kuiper et al. 2010), which are consistent with observations (Beltrán & de Wit 2016; Fedriani et al. 2018; Frost et al. 2019; Fedriani et al. 2019; Backs et al. 2023).
Surveys carried out by Caratti o Garatti et al. (2015), Moscadelli et al. (2016), and Purser et al. (2021) on MYSOs demonstrate a significant presence of jets associated with these sources. The outflows interact with the ambient medium, commonly producing knot shocks within the jet interior, as well as powerful termination shocks. Charged particles crossing shocks gain energy via first-order Fermi acceleration, hereafter diffusive shock acceleration (DSA) (Bell 1978; Blandford & Ostriker 1978). This is one of the most common mechanisms to accelerate cosmic rays (CRs) in the Milky Way. Consequently, jets can be associated with non-thermal emission (Obonyo et al. 2019), dominating different parts of the source spectrum. Radio frequencies are dominated by synchrotron emission, showing a negative spectral index consistent with non-thermal emission (e.g. Araudo et al. 2008; Anglada et al. 2018). On the other hand, γ rays can trace the non-thermal emission directly originated in the interactions of relativistic particles in the region.
Herbig-Haro (HH) objects (Herbig 1951; Haro 1952) are composed of bright optical structures associated with knots created in jets originated in young stellar objects, also capable of emitting from radio to infrared (IR) and even X-rays (see Schneider et al. 2022). These knots are produced by shocking material interactions, reaching hundreds of kilometers per second (e.g. Caratti o Garatti et al. 2009; López-Santiago et al. 2015; Djupvik et al. 2016; Massi et al. 2023). When ejecta interacts with the ambient medium or with slower structures within the jet (Cantó et al. 2000), strong shocks are produced, especially termination shocks, where the ejected material in the outer parts of the outflow directly impacts the interstellar medium (ISM). Consequently, HH objects usually present a clear ionization structure, showing Hα emission in the shocked regions and emitting lines of neutral species such as OI in the surrounding gas (Frank et al. 2014; Krumholz 2015). Moreover, HH objects show a bipolar structure (Bally 2016; Ray et al. 2023), pointing to their origin in a single driving star, even though they are typically located in star-forming regions interacting with other protostellar components (e.g. Plunkett et al. 2013; López et al. 2022).
In this context, IRAS 18162−2048 (also known as GGD27 MM1; Gyulbudaghian et al. 1978) is a MYSO with ∼20 M⊙ powering HH 80-81 (Añez-López et al. 2020), the largest collimated jet originating a protostar in the Galaxy known so far, with a projected size of ∼10 pc (Masqué et al. 2015; Bally & Reipurth 2023). Among the several knots in the entire structure, HH 80 and HH 81 spotlight the termination shock in the southern part of the jet, whereas HH 80N is the brightest object in the northern part. Both regions are located ∼2 − 3 pc away from the protostar. The whole system is placed at the western edge of L291, its host cloud. Although Añez-López et al. (2020) and Zhang (2023) report a distance to L291 of ∼1200 pc, we use the value of 1400 pc from Zucker et al. (2020), based on the reddening measurements of stars in the region whose parallaxes are recorded in Gaia DR2. At this distance, the bolometric luminosity of the protostar is ∼1.2 × 10⁴ L⊙, which is consistent with an OB forming star. Additionally, IRAS 18162−2048 is part of a multiple system, accompanied by GGD27 MM2 (Fernández-López et al. 2011), which drives a less energetic molecular outflow than MM1. Busquet et al. (2019) also report a protostellar cluster near the GGD27 complex, populating the region with 23 more low-mass young protostars.
Regarding high-energy astrophysics, while studying HH 80-81, Carrasco-González et al. (2010) detected, for the first and only time, linear polarization consistent with non-thermal synchrotron emission along a protostellar jet. Taking into account the clear negative index in the radio spectrum reported by Marti et al. (1993), HH 80-81 stands out as the best candidate to determine whether protostellar jets are able to accelerate particles. In addition, Rodríguez-Kamenetzky et al. (2019) report soft and hard X-ray emission in HH 80 and HH 81 ranging from 0.3 keV to 10 keV, detecting a non-thermal component that dominates the spectrum from ∼1 keV to the highest energies. Recently, Yan et al. (2022) reported a ∼10σ detection of this source in low-energy γ rays, tracing the high-energy spectrum of the protostellar system from 100 MeV to 1 GeV with 10 years of exposure time.
The confirmation of non-thermal emission from a protostellar jet has motivated studies of MYSOs as potential Galactic CR factories (Araudo et al. 2007; Bosch-Ramon et al. 2010; Araudo et al. 2021). Since then, the detection and association of γ-ray emission with protostellar jets has been pursued. The cases of the proximity of HH 219 to 4FGL J0822.8–4207 (Araya et al. 2022), the flaring episodes detected in S255 NIRS3 (see de Oña Wilhelmi et al. 2023), and the unassociated Fermi-LAT source of 4FGL J1846.9−0227 (Ortega et al. 2024) highlight the importance of finding an unexpected new Galactic CR source. To answer the question of whether protostellar jets are capable of accelerating particles up to high energies, one needs to determine the type of relativistic particles populating these environments, since the composition of the CRs that we directly detect is dominated by protons. Therefore, most of the literature on this topic, including this work, focuses on detecting γ-ray emission from these sources coming from accelerated particles in the source environment, providing direct insights into the characterization, if possible, of hadronic non-thermal emission. Then, to determine the hadronic or leptonic origin of the particles, several radiative models are usually proposed based on the different known mechanisms of producing γ rays. For protons, the most usual process is proton-proton collision, which produces π0 mesons that rapidly decay into γ rays. Electrons, in contrast, can produce γ rays via relativistic Bremsstrahlung due to the interaction of high-energy electrons with the ambient medium, or through inverse Compton (IC) scattering of lower-energy photon fields.
This paper focuses on the characterization of the γ-ray emission from the protostellar jet driven by IRAS 18162−2048, and is organized as follows. In Sect. 2, we analyze the observational high-energy data of the proximities of HH 80-81 from the Fermi-LAT telescope. In Sect. 3, we perform an association analysis to identify the source of the γ-ray excess. In Sect. 4, we characterize the particle spectrum that may produce the γ emission detected. Finally, in Sect. 5, we summarize our findings.
2. Observations and data analysis
The Fermi-LAT instrument is a spacecraft telescope that specializes in high-energy wavelengths spanning from 30 MeV to 300 GeV. It was launched in 2008 and it has been collecting data from the entire celestial sphere since August 4, 2008, providing one of the most comprehensive databases of γ-ray astronomy. Its strong capability to distinguish faint sources in a bright and complex background, and long exposure times, makes it ideal to study low-energy γ-ray emitters such as protostellar jets.
To analyze γ-ray emission emanating from HH 80-81 proximities, we employed 15 yr of Fermi-LAT data, ranging from August 5, 2008 to August 5, 2023. The photon data selection was performed using the standard P8R3 (Pass 8 Release 3) Source class, which is optimal for point-like sources and long timescales (Atwood et al. 2013). Additionally, we selected FRONT and BACK events in order to maximize the number of recorded photo-events. We employed fermipy v1.2.21 (Wood et al. 2017), which is based on Fermi Science Tools v2.2.02 (Fermi Science Support Development Team 2019), to perform a binned likelihood analysis of our data.
The selected shape of the region of interest (ROI) is a square of 12° ×12° centered at the coordinates of IRAS 18162−2048 (RAJ2000 = 18h19m12s.1, DecJ2000 = −20° 47′31″) (Fernández-López et al. 2023). The recent Fermi-LAT 4FGL Data Release 4 (DR4) catalog (Abdollahi et al. 2022; Ballet et al. 2024) is used as the base model of the ROI, including all point and extended sources within a 22° ×22° field around the protostar (see Fig. 1). Although the usual energy range of this type of study spans from 100 MeV to 100 GeV, we analyzed data from 300 MeV to 100 GeV to avoid contamination from Galactic diffuse emission at low energies (see Sect. 2.1). In addition, the Galactic plane diffuse emission was modeled using the most recent template gll_iem_v07, and the isotropic diffuse emission was modeled with iso_P8R3_SOURCE_V3_v13.
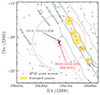 |
Fig. 1. 4FGL DR4 source map for our ROI. the contours illustrate the Galactic plane emission at the 97th, 99th, 99.7th, and 99.9th percentile based on the gll_iem_v07 template. The magenta circle indicates the region where the normalization parameter were set free to compute the fit model of the ROI. In addition, Galactic diffuse emission and isotropic emission were also set to free. |
To compute our ROI source model, we applied a spatial binning of 0.1° per pixel, and the energy range was divided into 8 bins per decade. The selected instrument response functions are contained in P8R3_SOURCE_V3, which is consistent with the event type that we want to analyze. We also applied a cut of events within a zenith angle above 90° to suppress contamination from Earth Limb events. Regarding the good time interval selection, we apply the (DATA_QUAL>0) & (LAT_CONFIG==1) filters, ensuring that the telescope was functioning correctly while our data was been collected.
Figure 1 shows our ROI conditions, where our target is close to the Galactic plane, located in a region with many point-like and extended sources. We then fit our ROI model by maximizing the likelihood with the selected data. To do this, we freed the normalization parameter (ϕ0) of all sources in the base model located within a radius of 4° from our target, as well as the spectral index (Γ) of sources closer than 2°. Figure 1 also highlights 4FGL J1818.5−2036, an unassociated point-like source with a 4σ detection significance in the 4FGL-DR4 catalog, separated from IRAS 18162−2048 by ∼0.2°. Considering the large 68% containment angle of Fermi-LAT (∼5° at 100 MeV), which reflects the PSF, this source is potentially associated with our target. We thus performed a fitting following the same methodology as before, but replacing 4FGL J1818.5-2036 with a point-like source at the exact coordinates of IRAS 18162-2048 (see Fernández-López et al. 2023). This modification significantly increased the likelihood of the whole model, returning a logarithmic likelihood-ratio test of ∼42. Therefore, from then on, 4FGL J1818.5−2036 was removed from our base source model and substituted with a point-like source centered on our MYSO coordinates, accounting for the high-energy emission emerging from the proximities of the protostellar jet (details of the new source can be found in Table 1). The updated ROI fit model serves as the basis for all the following analysis.
Initial parameters for the source of interest obtained from the fit ROI model.
2.1. Detection and TS maps
The PSF of the LAT instrument varies from ∼5° at 100 MeV to ∼0.1° at 100 GeV, limiting the spatial resolution of the instrument. Zucker et al. (2020) establish the distance to the source as (1400 ± 70) pc, projecting an angular extension of ∼0.3° for the entire system. Despite the enormous size of this particular jet of ∼10 pc (Masqué et al. 2015), the angular size of our source is similar to the angular resolution at the highest energies, where the number of photo-events tends to be smaller in a typically decreasing spectrum. Therefore, we expect the entire HH 80-81 system (hereafter HH 80-81) to be contained within a small angular region centered on IRAS 18162−2048, behaving as a point-like source.
Given the lack of any bright γ-ray source in the field of view, our ROI is dominated by the Galactic diffuse emission due to the proximity of HH 80-81 to the Galactic plane, which accounts for ∼80% of the detected photo-events in our analysis. Thus, the accuracy of the fit model of this background emission is crucial for analyzing our object. At low energies, the containment area where we detect γ-ray photons provided by the target source is quite large, resulting in a considerable contamination from the background inside this region. Based on this, we studied the expected counts from the Galactic diffuse emission within the region covered by the PSF located in the same position as HH 80-81. Then, we find that a ∼1% of variation in the diffuse emission corresponds to the same level of emission measured from the new source at 300 GeV. Therefore, we decided to ignore all data below 300 MeV, since we considered them to be highly affected and unreliable because of their sensitivity to the Galactic diffuse emission. As a result, following the methodology described in the beginning of Sect. 2, we obtained a ROI fit model that provides an initial approach to the source of interest (see Table 1).
Once we had built a reliable dataset, we obtained several test statistic (TS) maps in order to display our source detection (Fig. 2). We used the tsmap method from fermipy, which computes the TS value for each spatial bin by adding a test source at each spatial position in the ROI calculating its amplitude and TS versus the location, in order to get a significance map. The remaining parameters are manually fixed. In our case, we have used the simplest test source possible: a point-like source whose spectrum is modeled with a power law described by Eq. (1),
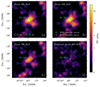 |
Fig. 2. TS maps for a 5° ×5° region centered on IRAS 18162−2048. Contour maps show the detection significance, while color maps indicate the TS value of each spatial bin. The green cross indicates the position of the protostar driving the HH 80-81 system. Panels (a), (b), and (c) show the significance map for HH 80-81 above 300 MeV, 500 MeV, and 700 MeV, respectively. Panel (d) shows the residual TS map above 300 MeV as proof of the reliability of our fit model. |
 (1)
(1)
where ϕ(E) describes the differential flux at a certain energy and ϕ0 is the event rate at the reference energy E0. In this work, we fixed the reference energy to E0 = 1 GeV for our spectral models of HH 80-81. In addition, to compute the TS value in each spatial bin, we created a test source with Γtest = 2.6 based on the results of Table 1 from the ROI fit model.
Figure 2 was created following this methodology. Panels a–c represent the significance of the counts excess at different minimum energy thresholds. These were computed by excluding our target source from the final fit model. The source detection is achieved if the TS is over 25, which is equivalent to a 5σ detection significance. Figure 2 shows that the source of interest is still detected when considering a lower energy limit of 500 MeV. However, the emission above 700 MeV is not enough to reach the 5σ detection threshold. On the other hand, panel d shows a flat TS map (this time, considering the presence of HH 80-81 in the ROI model) for a test point source with Γtest = 2, confirming the good quality of the fit model.
Yan et al. (2022) initially detected a γ-ray excess in the same region between 100 MeV and 300 MeV. Now, by using five more years of data and a more precise analysis, we have identified some incompatibilities. Analysing the dataset included in this work, we found that the count excess yields a TS of ∼29 above 300 MeV (∼42 above 100 MeV), reaching the 5σ threshold to claim the source detection. This is notably lower than the 10σ detection claimed by Yan et al. (2022) above 100 MeV. Furthermore, the source is clearly detected above 500 MeV, indicating a harder spectrum than the one reported in Yan et al. (2022) (Γ = 3.53 ± 0.11). These discrepancies can be attributed to the energy range used in the initial detection. As we have calculated, the Galactic diffuse emission dominates at the lowest energies, where the first detection was achieved with significantly less exposure time, suggesting that the original detection was heavily affected by the residuals of the Galactic template.
2.2. Morphological analysis
The low spatial resolution of Fermi-LAT restricts morphological studies of small sources like HH 80-81. However, accelerated particles can reach large regions with high ISM densities, producing a γ-ray excess along enormous areas that can be detected as extended sources by Fermi-LAT. To constrain the extension of the source of interest, we employed the extension analysis algorithm in the fermipy package.
We built 21 radial disk models, varying the radius from 0.01° to 1.0°, all centered on the same coordinates of IRAS 18162−2048 (Table 3). For each uniform disk model, we fit the spectral parameters of the sources by maximizing the likelihood. Then, the global likelihoods of all the models were compared to determine the significance of the extended model as a function of the source radius. This significance was calculated as the square root of the ΔTSext, obtained through Eq. (2), where we compared the global likelihood of each extension model (ℒextended) with the likelihood obtained for a point-like source (ℒpoint − like).
 (2)
(2)
The extended model that best fits the detected γ-ray emission in the region has a radius of (0.25 ± 0.05)°, resulting in a hint of ΔTSext ≈ 10, which does not reach the commonly used 5σ threshold for claiming an extended source. Since our source radius is significantly lower than our PSF at low energies, where the majority of photo-events are expected to be, we can assume that our source of interest behaves as a point-like source. Consequently, we continued our analysis without considering any extension.
2.3. Spectral analysis
Based on the sed method of fermipy, we calculated the high-energy spectral energy distribution (SED) of our source of interest. Here, the dataset was divided into several energy bins, in which the normalization parameters in Eq. (1) were fit to maximize the likelihood of the model in each bin, keeping the rest of parameters fixed. In this case, we used four energy bins per decade, ranging from 300 MeV to 100 GeV, and we fixed the spectral index of HH 80-81 to 2.6, assuming that the overall spectral slope that we obtain in Table 1 is stable and close to the real value. We also freed the normalization parameters regulating the Galactic diffuse emission and the isotropic emission, as both dominate our ROI. Additionally, the selected shape of the spectrum, starting from a power law, may play a remarkable role in performing the SED analysis. Depending on the shape of the spectrum, we are forcing the analysis software to fit the emission of the putative source. Thus, we have to determine which model better fits the detected emission.
Heretofore, the detected emission has initially been modeled as a power law based on simplicity arguments. However, we can use other spectral shapes to describe a point-like source, such as the log-parabola spectrum in Eq. (3),
 (3)
(3)
or a power law with an exponential cutoff model (hereafter exponential cutoff) similar to the one in Eq. (5), where additional parameters affect the curvature of the spectra. The power-law expression is nested in these two spectral shapes, allowing for a comparison between all these different models. Employing the curvature algorithm of fermipy, we constructed the TS significance for these three models by comparing the maximum likelihood achievable for each model in Eq. (4).
 (4)
(4)
In Eq. (4), the suffix model refers to the log-parabola or exponential cutoff models compared to the power-law shape. Table 2 shows a comparison of these three models. Based on the results, the low ΔTS values describing the goodness of the different fits suggest that the high-energy spectrum of the source can be accurately described by a power-law function.
Comparison of the different models for computing the spectrum of the γ-ray detection.
Comparison between the coordinates of IRAS 18162−2048 (Fernández-López et al. 2023) obtained with the Atacama Large Milimiter Array (ALMA) and the best position obtained for the Fermi-LAT source.
Figure 3 shows the spectrum obtained for our detection. Compared with previous results, Fig. 3 shows a clear discrepancy in the slope of both spectra. As was mentioned before, we attribute these differences to the Galactic diffuse emission, as Yan et al. (2022) only detected the source in the low-energy regime (bellow 300 MeV), where the Galactic diffuse background is heavily dominant over our source. These new results, with 15 years of collected data, allow for the detection of our source of interest up to higher energies, describing a harder power-law spectrum. Every point plotted in the Fig. 3 has more than ten predicted events, and upper limits have been calculated with a 95% confidence level for all the bins that do not reach either the minimum of predicted events or the critical TS value of 4.
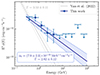 |
Fig. 3. SED of the source of interest. Blue circles represent the significant points obtained from our analysis, while blue arrows show the upper limits for those energy bins that do not reach a minimum TS value of 4. The blue line shows the power-law fit resulting from this work and the blue box shows the parameters described in Eq. (1). The previous analysis performed by Yan et al. (2022) is shown in gray. |
2.4. Variability analysis
The recent bursts detected using radio, submilimiter, and IR wavelengths in the cases of NGC6334I-MM1 (Hunter et al. 2017), S255 NIRS3 (Caratti o Garatti et al. 2017), G358 (Stecklum et al. 2021), M17 MIR (Chen et al. 2021), G11.497-1.485 (Bayandina et al. 2024), and G323 (Wolf et al. 2024) demonstrate that MYSOs, as well as protostars that are still accreting mass, can gain vast masses in short periods of time due to disk instabilities, increasing the jet activity and emitting new knots (e.g. Marti et al. 1995; Cesaroni et al. 2018; Fedriani et al. 2023). These powerful events lead to flare episodes that can be detected in γ rays to definitely confirm the association between a Fermi-LAT source and a protostellar jet as a counterpart (see de Oña Wilhelmi et al. 2023). Unfortunately, since the beginning of Fermi-LAT’s operations, no flares have been reported from HH 80-81.
Hence, we do not expect to find any variability in the intensity of the γ-ray emission collected so far. The lightcurve method applied in this work involves splitting the initial dataset into ten equivalent time bins. With all the spectral parameters of all the sources in our ROI fixed, we fit the normalization parameters of the γ-ray source, the Galactic diffuse emission, and the isotropic emission in order to maximize the likelihood. Finally, we saved the TS detection value and the energy flux emitted in each time bin.
Figure 4, produced following this methodology, demonstrates the flux stability of our detection. The figure shows the integrated spectrum over the energy range used in the analysis, from 300 MeV to 100 GeV, resulting in the integral γ-ray flux (Fγ). Due to the marginal detection of the source in short time periods, we obtain important uncertainties for each time bin and the low-flux time periods do not reach the detection threshold. However, deviations from the average energy flux are smaller than 2σ, which is consistent with our expectations of no variability in this source.
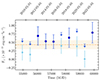 |
Fig. 4. Variability of the γ-ray energy flux of the source of interest over 15 years of observations. The dark blue points indicate the γ-ray flux during periods in which the source detection exceeds the 2σ threshold. For undetected time intervals, upper limits are shown with arrows, representing the 95% confidence level. Besides, light blue points show the flux derived using those insignificant points, providing an indication of the behavior of the source during those periods. The horizontal dashed line and shaded area represent the detected energy flux over the 15 years of observations and the 1σ uncertainty area, respectively. |
3. Source identification
The position of HH 80-81 appears to be slightly shifted from the peak position in the TS maps shown in Fig. 2. In addition, the spatial resolution of Fermi-LAT makes it challenging to definitely associate γ-ray sources with unique counterparts, as the large containment area of the instrument may contain a vast population of Galactic and extragalactic objects. However, since HH 80-81 has not been reported flaring at other wavelengths, we can only try to associate the γ-ray detection presented in Sect. 2 via positional arguments.
First of all, we applied the localize method of fermipy to fit the best location for the source of interest that we had analyzed. This method fits the best position of the putative source, returning the best position of a point-like source for explaining the γ-ray excess as well as the uncertainties in the position. Table 3 shows the final value after this process while Fig. 5 illustrates the source location. Since IRAS 18162−2048 is located within the 1σ area, the position of our γ-ray source is compatible with HH 80-81. Additionally, the initial 4FGL source J1818.5−2036 stays within the 3σ region.
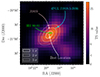 |
Fig. 5. Best location of the γ-ray detection that maximizes the likelihood of our model. White contours represent the uncertainty of the modeled position, while the color map shows the TS of the excess related to HH 80-81. The cyan mark indicates the position of 4FGL J1818.5−2036, which was removed from the initial model due to its relation to the HH 80-81 system. |
In order to clarify the origin of the detected γ-ray emission, we investigated all the potential counterparts populating the 3σ region. We checked the ATNF Pulsar Catalogue (Manchester et al. 2005), the SNRcat (Ferrand & Safi-Harb 2012), Green’s Galactic supernova remnants catalog (Green 2019), and several active galactic nucleus (AGN) catalogs compiled by Kauffmann et al. (2003) and Assef et al. (2018), confirming that there are no other well-characterized candidates spatially coincident with the 3σ location of the Fermi emission. Additionally, we reviewed the Radio Fundamental Catalog4, taking into account all the compact bright radio sources in the region that can be affected by the high extinction of the Galactic plane, complicating their classification in these catalogs. We only identified ICRF3 J1819−2036 (RAJ2000 = 18h19m36s.9, DecJ2000 = −20° 36′ 32″) within the 3σ area (see Fig. 5).
ICRF3 J1819−2036 (hereafter J1819) is a bright radio source listed in the ICRF3 catalog as a reliable VLBI calibrator (Charlot et al. 2020), which has been used as a phase calibrator in some papers in the literature (e.g. Ding et al. 2020; Li et al. 2022). It is a rapid variable radio source that presents significant flux variations in few hours. Nevertheless, no flares have been reported, despite having been observed since 1990 (Griffith et al. 1994). Very Large Array (VLA) has observed J1819 four times from 2015 to 2018 in the S and X band (2.3 GHz and 8.7 GHz, respectively) showing a point-like morphology that can be compatible with an AGN (Petrov et al. 2019). The photometric radio spectrum is notably bright (on the order of ∼0.1 Jy in both bands), with a negative spectral index indicative of non-thermal synchrotron emission. Furthermore, the null proper motion detected in those three years of observation is consistent with an extragalactic source.
Since quasars and blazars can be γ-ray emitters, we characterized J1819 as much as possible in order to determine whether its presence, close to HH 80-81, could explain our detection. The source is faintly visible in the far-IR band and undetectable at near-IR and optical wavelengths, likely due to Galactic extinction. We examined the soft and hard X-ray emission observed by XMM-Newton in the region (Pravdo et al. 2004). In X-rays, the expected extinction is much lower than optical or IR absorption, just ∼2 mag in the soft band and ∼0.1 mag in hard X-rays (Ebeling et al. 2002). Therefore, if J1819 is emitting hard X-rays, it should be detectable. However, there are no detections of this source, constraining the hard X-ray emission to be < 10−14 erg s−1 cm−2, which may be incompatible with the overall spectrum for IC scattering under certain conditions. We also checked the HESS Galactic Plane Survey (H. E. S. S. Collaboration 2018), which observed at J1819’s position without any hint of detection. Lastly, the stable variability curve detected with Fermi-LAT (see Sect. 2.4) suggests that the γ-ray source might not be an AGN, as most of such objects detected by Fermi present significant flux variations (Ajello et al. 2020).
Also, Pravdo et al. (2004) reported the presence of MRR 12 ( ) and MRR 32 (
 ), two interesting X-ray sources located close to the jet. Both are associated with compact nebular objects (typically star-forming objects) at IR wavelengths, and included in the GGD catalog (Gyulbudaghian et al. 1978) of HH objects. MRR 12 also appears as a possible non-thermal emitter, given its negative spectral index in radio frequencies. However, both objects are classified as class III pre-main-sequence stars (see Pravdo et al. 2009), in the weak T-Tauri phases. Therefore, there is no reason to consider them as potential γ-ray emitters.
Considering all of the above, the HH 80-81 protostellar jet stands out as the main candidate to explain the γ-ray detection. We examined all the Simbad sources surrounding IRAS 18162−2048 within a circular region of ∼0.44°, which is the semimajor axis of the 3σ area. Most of the radio sources and X-ray sources identified in the region are related to HH 80-81 or to young stars, not presenting any characteristic that could indicate non-thermal emission. IRAS 18162−2048 is located in the 1σ region, while J1819 is located outside the 2σ region (see Fig. 5), even when selecting only FRONT events. Moreover, both radio spectrum (Marti et al. 1993; Rodríguez-Kamenetzky et al. 2017) and polarized emission (Carrasco-González et al. 2010) provide strong evidence for non-thermal emission in HH 80-81. It is also well detected in soft and hard X-rays, showing a hard power-law emission (Rodríguez-Kamenetzky et al. 2019) compatible with our γ-ray emission.
Finally, Munar-Adrover et al. (2011) determined the reliability of associations between γ-ray sources and MYSOs, concluding that ∼70% of the associations between Fermi-LAT sources and MYSO counterparts are authentic. Therefore, we should expect some γ-ray emission from the most clear protostellar jet with non-thermal emission. All these reasons lead us to consider HH 80-81 as the main candidate to be powering the detected high-energy emission analyzed in Sect. 2.
4. Origin of the γ-ray emission
To understand the radiative spectrum from Sect. 2.3 flowing out from the protostellar system, we determined the most effective radiation mechanisms, considering different populations of particles under the ambient and internal conditions of HH 80-81. Figure 6 shows cooling timescales for the usual radiative mechanisms for relativistic protons and electrons estimated with Eqs. (10)–(14) from Bosch-Ramon et al. (2010) and Gamera5 (Hahn 2015; Hahn et al. 2022). The IC scattering was calculated using an IR density of 3 eV cm−3, consistent with Bosch-Ramon et al. (2010) and derived from the IR luminosity of IRAS 18162−20486 contained in a spherical region of 2.5 pc where HH 80, HH 80N, and HH 81 are located. The synchrotron cooling time was calculated for an electron population within a magnetic field of 0.1 mG (Carrasco-González et al. 2010; Rodríguez-Kamenetzky et al. 2019). The relativistic Bremsstrahlung radiative process and the γ-ray emission from inelastic proton collisions (π0 decay) were calculated using a density value of 100 cm−3 for the ambient medium (Bally & Reipurth 2023). We adopted a jet lifetime of 4 × 10⁴ yr, obtained in Qiu et al. (2019), and the timescale for particle acceleration was computed assuming a Bohm diffusion coefficient and a shock velocity of 400 km s−1 (Marti et al. 1995; Martí et al. 1998; Masqué et al. 2015; Bally & Reipurth 2023). As Fig. 6 shows, the most effective mechanisms for losing energy are synchrotron and relativistic Bremsstrahlung emission, and proton-proton collisions for a leptonic or a hadronic model, respectively. Regarding the γ-ray band, we consider relativistic Bremsstrahlung and π0 decay to be the most likely radiative mechanisms, taking into account that IC scattering is negligible due to the low photon density.
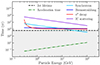 |
Fig. 6. Relevant timescales for the HH 80-81 system. Solid lines show the cooling timescales for different emission models. The dashed black line represents the estimated age of the jet, and the dash-dotted green line indicates the minimum time required to accelerate particles up to different energies based on the jet properties. |
The LAT data from Fig. 3 were fit using the naima7 tool (Zabalza 2015) considering the two dominant mechanisms: a leptonic population producing γ rays via relativistic Bremsstrahlung; and a hadronic population, whose emission is due to proton-proton inelastic collisions. The properties of the medium where particles are accelerated are also important in order to determine the number of particles needed to produce the γ-ray emission, no matter if the origin is hadronic or leptonic. Several studies address the density of the outflow gas (Qiu et al. 2019) and provide results on the specific density of the HH 80 and HH 81 knots based on X-ray emission (see Pravdo et al. 2004; Rodríguez-Kamenetzky et al. 2017). Heathcote et al. (1998) and Masqué et al. (2015) estimate the density of the jet to be on the order of ∼1000 cm−3, while Bally & Reipurth (2023) provide 100 cm−3 for the ISM density given the position of HH 80-81 in the outskirts of L291. Given that the two high-energy radiative mechanisms under consideration directly depend on the density of the ambient medium (see Baring et al. 1999; Kafexhiu et al. 2014), the integrated energy of the particle distribution is inversely proportional to ambient density. Accordingly, we adopted a density value of 100 cm−3, the most restrictive scenario, which demands higher particle energy to explain the detected γ-ray emission.
To model both the hadronic and leptonic scenarios, we employed a particle distribution characterized by a power law with an exponential cutoff, as is described in Eq. (5), freeing the normalization parameter (ϕ0).
 (5)
(5)
Figure 6 shows an almost null dependence of the relativistic Bremsstrahlung and π0 decay processes on particle energy. Therefore, we adopted the same spectral index for the particle distribution as that of the photo-spectrum (Γparticle = 2.62). Furthermore, from Fig. 6 we observe that if cutoff energy (Ecutoff) is determined by radiative cooling, the maximum energy reached by electrons will be lower than the cutoff energy of protons, as a consequence of the lower cooling time for synchrotron radiation at the highest energies. Using Eq. (17) from Bosch-Ramon et al. (2010), we estimate a maximum particle energy of Ecutoff, e ≈ 3 TeV, resulting from synchrotron cooling under the specific conditions of HH 80-81. In addition, applying Eq. (20) from Bosch-Ramon et al. (2010), we obtain the maximum particle energy achievable via π0 decay cooling for a density of 100 cm−3, resulting in Ecutoff, p ≈ 12 TeV. Additionally, Araudo et al. (2021) also predict that protons reach higher energies than electrons when the cutoff energy is determined by the escape of high-energy protons from the upstream region of the shock. Since Ecutoff, p > Ecutoff, e and Ecutoff, e is well above our range of interest, the particle distribution approximates a power law within the studied energies.
Figure 7 presents the radiative spectrum produced by both leptonic and hadronic fits. In principle, both models are able to explain the high energy emission detected by Fermi-LAT. The assumed spectral index is softer than that predicted by DSA within the ultrarelativistic regime (Γ = 2), but remains relatively close.
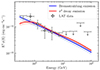 |
Fig. 7. SED fitting for leptonic and hadronic models of γ-ray production. Grey points represent the Fermi-LAT emission from Fig. 3 obtained in this work. Shaded areas show the 1σ error for both fittings. |
If the protostellar jet is composed by a single electron population responsible for all our γ-ray emission, we can estimate the synchrotron emission assuming a magnetic field of 0.1 mG. However, when comparing the synchrotron spectrum predicted by our leptonic distribution with ancillary data from Marti et al. (1993) and Vig et al. (2018), we observe important discrepancies. Radio observations situate synchrotron radiation two orders of magnitude weaker than we expect. These results might be attributed to a synchrotron self-absorption in the inner regions of the jet or the contribution of accelerated protons to the γ-ray spectrum. Furthermore, variations in the ambient density and the magnetic field strength could also account for these differences. Therefore, the observed discrepancies may not be physically significant, and the considerable degeneracy intrinsic to the problem prevents us from constraining any specific characteristic of the medium.
Integrating the particle distribution responsible for the emission of Fig. 7 from 300 MeV to 100 GeV provides the total energy accumulated by the accelerated particles of the source. Table 4 shows the energy obtained for both models in function of the ISM density (n). Based on a mass loss rate of ∼10−5 M⊙ yr−1 (Añez-López et al. 2020) and the velocities of the outflow in the central regions of ∼2000 km s−1 reported by Bally & Reipurth (2023), we estimate the jet kinetic luminosity to be on the order of ∼1037 erg s−1. Assuming that 5% of the kinetic energy of the jet is transformed into particle acceleration (Araudo et al. 2021) and using Eq. (6), we calculated the time required to accelerate the particles up to the necessary energy to produce the observed γ-ray emission (Table 4).
Integrated energy of the particle distribution and injection time required to accelerate all the particles of the distribution.
 (6)
(6)
where η ≈ 5% is the acceleration efficiency, Etotal is the integrated energy of the particle distribution (starting from 300 MeV), and Ljet is the kinetic power of the jet.
In the lowest density regime (100 cm−3), the injection time for proton–proton collision is on the order of ∼104 yr, which is very similar to the estimated lifetime of the HH 80-81 protostellar jet (∼4 × 10⁴ yr; Qiu et al. 2019). The dynamical age of the jet is also > 9 × 10³ yr (Masqué et al. 2012), which is compatible with both models. Therefore, based on energetic arguments, we cannot discard a hadronic origin for the γ-ray emission. However, under the IC scattering model, the electron energy required to account for the detected γ-ray spectrum is ∼1054 erg, which is much higher than the other two models. The injection time, considering an efficiency of η = 100%, is much longer than the lifetime of the jet. Therefore, IC scattering is expected to be negligible under the jet ambient conditions.
Since the cooling timescales from Fig. 6 are longer than the jet lifetime, accelerated particles were able to travel ∼100 kpc under a diffusion coefficient on the order of 1028 cm2 s−1 at particle energies of ∼1 GeV (e.g. Strong et al. 2007; Cummings et al. 2016). This distance is large enough to cover a significant part of the molecular complex where the source is located, possibly producing weak high-energy emission within an extended area. Thus, we overlay the density maps of HII, HI, and H2 to illustrate the location of the density distribution of the region where the γ-ray emission is detected.
The HII density was derived from a free–free emission map obtained trough the combined analysis of Plank, WMAP, and 408 MHz Survey data (Planck Collaboration X 2016). The column density was calculated using the conversion factors from Finkbeiner (2003) and the Eq. (5) described in Sodroski et al. (1997). Similarly, the HI density map in our ROI was obtained from the HI4PI survey (HI4PI Collaboration 2016). Additionally, to gain spatial resolution, we derived the H density in the molecular complex L291 using extinction maps based on the reddening of the stars in the field of view (Güver & Özel 2009; Green et al. 2019). We also validated the resulting density values for the molecular cloud with the density of H2 returned by the CO Composite Survey (Dame et al. 2001; Bolatto et al. 2013).
Density maps of HII and HI do not exhibit any spatial correlation with the source. On the other hand, the H density map of L291 seems to trace the γ-ray emission produced by HH 80-81 of the southern part (see Fig. 8). The northern side of the molecular cloud is dominated by two unassociated point-like sources reported in the 4FGL DR4 catalog: J1818.1−2000 ( ) and J1817.2−1946c (
 ). Based on the ATNF Catalog and the IR map in the Fig. 8, J1817.2−1946c might be associated with the PSR J1817−1938 pulsar, with only ∼8 arcmin of separation. The global γ-ray excess provided by the three Fermi-LAT sources detected in the molecular cloud is spatially coincident with the densest regions of the molecular cloud, enhancing the idea that the detected γ-ray excess may have a Galactic origin. However, since HH 80-81 is perfectly described as a point-like source and the γ-ray emission in the area is faint, we cannot discuss the morphology of the individual source further.
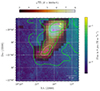 |
Fig. 8. Comparison between γ-ray emission and molecular clouds in the region of HH 80-81. The color map in the background shows a high-resolution IR map from the band A (8 μm) of the MSX experiment (Egan et al. 2003), which is used to locate HH 80-81 (magenta square). Solid green contours indicate the column density of the molecular gas in the vicinity of HH 80-81. The warm color map displays a detection map based on the square root of the TS related to the three 4FGL sources populating the molecular complex, with magenta crosses locating the other two 4FGL sources apart from HH 80-81. The dashed contour indicates the 5σ detection area of HH 80-81 (see Fig. 2). |
5. Conclusion
In this work, we present a detailed analysis of the high-energy emission located in the proximities of the protostellar jet of HH 80-81. We analyzed 15 years of Fermi-LAT data, improving the exposure time compared to the previous detection by Yan et al. (2022). Given the faint flux of the γ-ray excess and its position close to the Galactic plane, we excluded data below 300 MeV, where the Galactic diffuse emission dominates over our target source. In fact, we find discrepancies in the spectral index of the gamma-ray source with respect to the previous study carried out by Yan et al. (2022) between 100 MeV and 300 MeV. With our analysis, we conclude that the low-energy γ-ray band, combined with shorter exposure times, is severely impacted by the Galactic background, returning inaccurate results.
Additionally, we performed a comprehensive source identification based on positional arguments. We found two potential candidates in the region: the HH 80-81 protostellar jet and J1819 compact radio source. We studied the possibility that the γ-ray emission originates from both sources. HH 80-81 is a very stable source, with no flares reported so far. In contrast, blazars (as J1819 could be) usually present high variability in the γ-ray band. Since the γ-ray source shows non-significant variability and HH 80-81 is the only counterpart that falls inside the 1σ position area (and also in the 2σ area), we conclude that HH 80-81 is the main candidate for explaining the detected emission. However, other MYSOs have been detected flaring in IR-optical wavelengths. Thus, definite proof of the relation between the gamma-ray emission and MYSOs would come from the association of flaring episodes at longer wavelengths with variability in the gamma-ray band. Therefore, IR surveys tracking the flare episodes of these types of objects are crucial to detect more MYSOs emitting γ rays as a result of a significant particle acceleration.
The obtained radiative spectrum reveals a harder behavior than is reported by Yan et al. (2022), with an updated power-law index of Γ = 2.62 ± 0.12 versus a previous value of 3.53 ± 0.11. We fit the detected radiation to originate in either leptonic or hadronic particle distributions. Both populations are compatible with the spectral shape of the source. In addition, the amount of energy injected in both particle distributions is achievable during the jet’s lifetime. As a result, the exact nature of the particle population that is producing the γ-ray emission remains unclear and will require longer exposure times to perform more significant morphological studies. In this way, we display IR and density maps over the detected γ-ray emission to show the spatial coincidence with the Galactic structures of L291.
Finally, this work demonstrates that HH objects are excellent candidates for studying the capability of protostellar jets to accelerate particles. Therefore, further investigations of these objects throughout the entire electromagnetic spectrum are essential to constrain the ambient conditions in order to infer the particle spectrum from the high-energy emission. Regarding HH 80-81, the two main knots (i.e. HH 80 and HH 81) have been studied in the radio band (Marti et al. 1993; Vig et al. 2018) and in X-rays (Pravdo et al. 2004; Rodríguez-Kamenetzky et al. 2019). Nonetheless, the large PSF of the LAT instrument detects the entire protostellar jet as a point-like source. To combine our findings with multiwavelength data, especially radio and X-ray bands where the non-thermal emission dominates, we need further studies that cover the whole ROI. In the same way, future observations using the Large-Size Telescopes (LSTs) of CTAO could provide key insights into the morphology of the γ-ray production region, since the theoretical cutoff for the maximum reachable energy of the accelerated particles seems to be compatible with the minimum energy threshold of the LSTs (see Araudo et al. 2021).
Acknowledgments
Authors thank Carlos Carrasco-González for his useful comments on the source identification. We also thank the comments of the anonymous referee that have undoubtedly improved the quality of this paper. EdOW acknowledges the support of DESY (Zeuthen), a member of the Helmholtz Association HGF. J.M.-G., J.O.-S., R.F., R.L.-C., acknowledge financial support from the Severo Ochoa grant CEX2021-001131-S funded by MCIN/AEI/ 10.13039/501100011033. J.M.-G., J.O.-S., R.L.-C also acknowledge financial support from the Spanish “Ministerio de Ciencia e Innovación” through grant PID2022-139117NB-C44. J.M.-G. acknowledges financial support from the FPI-Severo Ochoa grant CEX2021-001131-S-20-6, PRE2022-103386 funded by MICIU/AEI/ 10.13039/501100011033 and ESF+. J.O.-S. acknowledges financial support from the project ref. AST22_00001_9 with founding from the European Union – NextGenerationEU, the “Ministerio de Ciencia, Innovación y Universidades, Plan de Recuperación, Transformación y Resiliencia”, the “Consejería de Universidad, Investigación e Innovación” from the “Junta de Andalucía”, and the “Consejo Superior de Investigaciones Científicas”. R.F. acknowledges support from the grants Juan de la Cierva FJC2021-046802-I, PID2020-114461GB-I00, and PID2023-146295NB-I00 funded by MCIN/AEI/ 10.13039/501100011033 and by “European Union NextGenerationEU/PRTR”. R.L.-C. acknowledges the Ramón y Cajal program through grant RYC-2020-028639-I.
References
- Abdollahi, S., Acero, F., Baldini, L., et al. 2022, ApJS, 260, 53 [NASA ADS] [CrossRef] [Google Scholar]
- Ajello, M., Angioni, R., Axelsson, M., et al. 2020, ApJ, 892, 105 [NASA ADS] [CrossRef] [Google Scholar]
- Añez-López, N., Osorio, M., Busquet, G., et al. 2020, ApJ, 888, 41 [CrossRef] [Google Scholar]
- Anglada, G., Rodríguez, L. F., & Carrasco-González, C. 2018, A&ARv, 26, 3 [Google Scholar]
- Araudo, A. T., Romero, G. E., Bosch-Ramon, V., & Paredes, J. M. 2007, A&A, 476, 1289 [NASA ADS] [CrossRef] [EDP Sciences] [Google Scholar]
- Araudo, A. T., Romero, G. E., Bosch-Ramon, V., & Paredes, J. M. 2008, ArXiv e-prints [arXiv:0806.2306v1] [Google Scholar]
- Araudo, A. T., Padovani, M., & Marcowith, A. 2021, MNRAS, 504, 2405 [NASA ADS] [CrossRef] [Google Scholar]
- Araya, M., Gutiérrez, L., & Kerby, S. 2022, MNRAS, 510, 2277 [NASA ADS] [CrossRef] [Google Scholar]
- Assef, R. J., Stern, D., Noirot, G., et al. 2018, ApJS, 234, 23 [Google Scholar]
- Atwood, W., Albert, A., Baldini, L., et al. 2013, ArXiv e-prints [arXiv:1303.3514] [Google Scholar]
- Backs, F., Poorta, J., Rab, C., et al. 2023, A&A, 671, A13 [NASA ADS] [CrossRef] [EDP Sciences] [Google Scholar]
- Ballet, J., Bruel, P., Burnett, T. H., Lott, B., & The Fermi-LAT collaboration 2024, arXiv e-prints [arXiv:2307.12546] [Google Scholar]
- Bally, J. 2016, ARA&A, 54, 491 [Google Scholar]
- Bally, J., & Reipurth, B. 2023, ApJ, 958, 99 [NASA ADS] [CrossRef] [Google Scholar]
- Baring, M. G., Ellison, D. C., Reynolds, S. P., Grenier, I. A., & Goret, P. 1999, ApJ, 513, 311 [NASA ADS] [CrossRef] [Google Scholar]
- Bayandina, O. S., Burns, R. A., Caratti Garatti, A., et al. 2024, A&A, 684, A86 [NASA ADS] [CrossRef] [EDP Sciences] [Google Scholar]
- Bell, A. R. 1978, MNRAS, 182, 147 [Google Scholar]
- Beltrán, M. T., & de Wit, W. J. 2016, A&ARv, 24, 6 [Google Scholar]
- Blandford, R. D., & Ostriker, J. P. 1978, ApJ, 221, L29 [Google Scholar]
- Bolatto, A. D., Wolfire, M., & Leroy, A. K. 2013, ARA&A, 51, 207 [CrossRef] [Google Scholar]
- Bosch-Ramon, V., Romero, G. E., Araudo, A. T., & Paredes, J. M. 2010, A&A, 511, A8 [NASA ADS] [CrossRef] [EDP Sciences] [Google Scholar]
- Busquet, G., Girart, J. M., Estalella, R., et al. 2019, A&A, 623, L8 [NASA ADS] [CrossRef] [EDP Sciences] [Google Scholar]
- Cantó, J., Raga, A. C., & D’Alessio, P. 2000, MNRAS, 313, 656 [CrossRef] [Google Scholar]
- Caratti o Garatti, A., Eislöffel, J., Froebrich, D., et al. 2009, A&A, 502, 579 [NASA ADS] [CrossRef] [EDP Sciences] [Google Scholar]
- Caratti o Garatti, A., Stecklum, B., Linz, H., Garcia Lopez, R., & Sanna, A. 2015, A&A, 573, A82 [NASA ADS] [CrossRef] [EDP Sciences] [Google Scholar]
- Caratti o Garatti, A., Stecklum, B., Garcia Lopez, R., et al. 2017, Nature Physics, 13, 276 [CrossRef] [Google Scholar]
- Carrasco-González, C., Rodríguez, L. F., Anglada, G., et al. 2010, Science, 330, 1209 [CrossRef] [Google Scholar]
- Cesaroni, R., Moscadelli, L., Neri, R., et al. 2018, A&A, 612, A103 [NASA ADS] [CrossRef] [EDP Sciences] [Google Scholar]
- Charlot, P., Jacobs, C. S., Gordon, D., et al. 2020, A&A, 644, A159 [EDP Sciences] [Google Scholar]
- Chen, Z., Sun, W., Chini, R., et al. 2021, ApJ, 922, 90 [NASA ADS] [CrossRef] [Google Scholar]
- Cummings, A. C., Stone, E. C., Heikkila, B. C., et al. 2016, ApJ, 831, 18 [CrossRef] [Google Scholar]
- Dame, T. M., Hartmann, D., & Thaddeus, P. 2001, ApJ, 547, 792 [Google Scholar]
- de Oña Wilhelmi, E., López-Coto, R., & Su, Y. 2023, MNRAS, 523, 105 [CrossRef] [Google Scholar]
- Ding, H., Deller, A. T., Lower, M. E., et al. 2020, MNRAS, 498, 3736 [NASA ADS] [CrossRef] [Google Scholar]
- Djupvik, A. A., Liimets, T., Zinnecker, H., et al. 2016, A&A, 587, A75 [NASA ADS] [CrossRef] [EDP Sciences] [Google Scholar]
- Ebeling, H., Mullis, C. R., & Tully, R. B. 2002, ApJ, 580, 774 [Google Scholar]
- Egan, M. P., Price, S. D., & Kraemer, K. E. 2003, American Astronomical Society Meeting Abstracts, 203, 57.08 [NASA ADS] [Google Scholar]
- Fedriani, R., Caratti Garatti, A., Coffey, D., et al. 2018, A&A, 616, A126 [NASA ADS] [CrossRef] [EDP Sciences] [Google Scholar]
- Fedriani, R., Caratti o Garatti, A., Purser, S. J. D., et al. 2019, Nature Communications, 10, 3630 [NASA ADS] [CrossRef] [Google Scholar]
- Fedriani, R., Caratti o Garatti, A., Cesaroni, R., et al. 2023, A&A, 676, A107 [NASA ADS] [CrossRef] [EDP Sciences] [Google Scholar]
- Fermi Science Support Development Team 2019, Astrophysics Source Code Library [record ascl:1905.011] [Google Scholar]
- Fernández-López, M., Curiel, S., Girart, J. M., et al. 2011, AJ, 141, 72 [CrossRef] [Google Scholar]
- Fernández-López, M., Girart, J. M., López-Vázquez, J. A., et al. 2023, ApJ, 956, 82 [CrossRef] [Google Scholar]
- Ferrand, G., & Safi-Harb, S. 2012, Advances in Space Research, 49, 1313 [NASA ADS] [CrossRef] [Google Scholar]
- Finkbeiner, D. P. 2003, ApJS, 146, 407 [Google Scholar]
- Frank, A., Ray, T. P., Cabrit, S., et al. 2014, in Protostars and Planets VI, eds. H. Beuther, R. S. Klessen, C. P. Dullemond, & T. Henning, 451 [Google Scholar]
- Frost, A. J., Oudmaijer, R. D., de Wit, W. J., & Lumsden, S. L. 2019, A&A, 625, A44 [NASA ADS] [CrossRef] [EDP Sciences] [Google Scholar]
- Green, D. A. 2019, Journal of Astrophysics and Astronomy, 40, 36 [NASA ADS] [CrossRef] [Google Scholar]
- Green, G. M., Schlafly, E., Zucker, C., Speagle, J. S., & Finkbeiner, D. 2019, ApJ, 887, 93 [NASA ADS] [CrossRef] [Google Scholar]
- Griffith, M. R., Wright, A. E., Burke, B. F., & Ekers, R. D. 1994, ApJS, 90, 179 [NASA ADS] [CrossRef] [Google Scholar]
- Güver, T., & Özel, F. 2009, MNRAS, 400, 2050 [Google Scholar]
- Gyulbudaghian, A. L., Glushkov, Y. I., & Denisyuk, E. K. 1978, ApJ, 224, L137 [NASA ADS] [CrossRef] [Google Scholar]
- H. E. S. S. Collaboration (Abdalla, H., et al.) 2018, A&A, 612, A1 [NASA ADS] [CrossRef] [EDP Sciences] [Google Scholar]
- Hahn, J. 2015, International Cosmic Ray Conference, 34, 917 [NASA ADS] [Google Scholar]
- Hahn, J., Romoli, C., & Breuhaus, M. 2022, Astrophysics Source Code Library [record ascl:2203.007] [Google Scholar]
- Haro, G. 1952, ApJ, 115, 572 [NASA ADS] [CrossRef] [Google Scholar]
- Heathcote, S., Reipurth, B., & Raga, A. C. 1998, AJ, 116, 1940 [Google Scholar]
- Herbig, G. H. 1951, ApJ, 113, 697 [NASA ADS] [CrossRef] [Google Scholar]
- HI4PI Collaboration (Ben Bekhti, N., et al.) 2016, A&A, 594, A116 [NASA ADS] [CrossRef] [EDP Sciences] [Google Scholar]
- Hosokawa, T., Yorke, H. W., & Omukai, K. 2010, ApJ, 721, 478 [Google Scholar]
- Hunter, T. R., Brogan, C. L., MacLeod, G., et al. 2017, ApJ, 837, L29 [NASA ADS] [CrossRef] [Google Scholar]
- Kafexhiu, E., Aharonian, F., Taylor, A. M., & Vila, G. S. 2014, Phys. Rev. D, 90, 123014 [Google Scholar]
- Kahn, F. D. 1974, A&A, 37, 149 [NASA ADS] [Google Scholar]
- Kauffmann, G., Heckman, T. M., Tremonti, C., et al. 2003, MNRAS, 346, 1055 [Google Scholar]
- Kölligan, A., & Kuiper, R. 2018, A&A, 620, A182 [NASA ADS] [CrossRef] [EDP Sciences] [Google Scholar]
- Krumholz, M. R. 2015, ArXiv e-prints [arXiv:1511.03457] [Google Scholar]
- Kuiper, R., Klahr, H., Beuther, H., & Henning, T. 2010, ApJ, 722, 1556 [NASA ADS] [CrossRef] [Google Scholar]
- Li, J. J., Immer, K., Reid, M. J., et al. 2022, ApJS, 262, 42 [NASA ADS] [CrossRef] [Google Scholar]
- López, R., Estalella, R., Beltrán, M. T., et al. 2022, A&A, 661, A106 [NASA ADS] [CrossRef] [EDP Sciences] [Google Scholar]
- López-Santiago, J., Bonito, R., Orellana, M., et al. 2015, ApJ, 806, 53 [CrossRef] [Google Scholar]
- Manchester, R. N., Hobbs, G. B., Teoh, A., & Hobbs, M. 2005, AJ, 129, 1993 [Google Scholar]
- Marti, J., Rodriguez, L. F., & Reipurth, B. 1993, ApJ, 416, 208 [Google Scholar]
- Marti, J., Rodriguez, L. F., & Reipurth, B. 1995, ApJ, 449, 184 [NASA ADS] [CrossRef] [Google Scholar]
- Martí, J., Rodríguez, L. F., & Reipurth, B. 1998, ApJ, 502, 337 [CrossRef] [Google Scholar]
- Masqué, J. M., Girart, J. M., Estalella, R., Rodríguez, L. F., & Beltrán, M. T. 2012, ApJ, 758, L10 [Google Scholar]
- Masqué, J. M., Rodríguez, L. F., Araudo, A., et al. 2015, ApJ, 814, 44 [CrossRef] [Google Scholar]
- Massi, F., Caratti Garatti, A., Cesaroni, R., et al. 2023, A&A, 672, A113 [NASA ADS] [CrossRef] [EDP Sciences] [Google Scholar]
- Moscadelli, L., Sánchez-Monge, Á., Goddi, C., et al. 2016, A&A, 585, A71 [NASA ADS] [CrossRef] [EDP Sciences] [Google Scholar]
- Munar-Adrover, P., Paredes, J. M., & Romero, G. E. 2011, A&A, 530, A72 [NASA ADS] [CrossRef] [EDP Sciences] [Google Scholar]
- Obonyo, W. O., Lumsden, S. L., Hoare, M. G., et al. 2019, MNRAS, 486, 3664 [Google Scholar]
- Ortega, M. E., Petriella, A., & Paron, S. 2024, MNRAS, 532, 4446 [NASA ADS] [CrossRef] [Google Scholar]
- Petrov, L., de Witt, A., Sadler, E. M., Phillips, C., & Horiuchi, S. 2019, MNRAS, 485, 88 [CrossRef] [Google Scholar]
- Planck Collaboration X. 2016, A&A, 594, A10 [NASA ADS] [CrossRef] [EDP Sciences] [Google Scholar]
- Plunkett, A. L., Arce, H. G., Corder, S. A., et al. 2013, ApJ, 774, 22 [NASA ADS] [CrossRef] [Google Scholar]
- Pravdo, S. H., Tsuboi, Y., & Maeda, Y. 2004, ApJ, 605, 259 [NASA ADS] [CrossRef] [Google Scholar]
- Pravdo, S. H., Tsuboi, Y., Suzuki, Y., Thompson, T. J., & Rebull, L. 2009, ApJ, 690, 850 [NASA ADS] [CrossRef] [Google Scholar]
- Purser, S. J. D., Lumsden, S. L., Hoare, M. G., & Kurtz, S. 2021, MNRAS, 504, 338 [NASA ADS] [CrossRef] [Google Scholar]
- Qiu, K., Wyrowski, F., Menten, K., Zhang, Q., & Güsten, R. 2019, ApJ, 871, 141 [NASA ADS] [CrossRef] [Google Scholar]
- Ray, T. P., McCaughrean, M. J., Caratti Garatti, A., et al. 2023, Nature, 622, 48 [NASA ADS] [CrossRef] [Google Scholar]
- Rodríguez-Kamenetzky, A., Carrasco-González, C., Araudo, A., et al. 2017, ApJ, 851, 16 [Google Scholar]
- Rodríguez-Kamenetzky, A., Carrasco-González, C., González-Martín, O., et al. 2019, MNRAS, 482, 4687 [CrossRef] [Google Scholar]
- Schneider, P. C., Günther, H. M., & Ustamujic, S. 2022, in Handbook of X-ray and Gamma-ray Astrophysics, eds. C. Bambi, & A. Sangangelo, 57 [Google Scholar]
- Sodroski, T. J., Odegard, N., Arendt, R. G., et al. 1997, ApJ, 480, 173 [NASA ADS] [CrossRef] [Google Scholar]
- Stecklum, B., Wolf, V., Linz, H., et al. 2021, A&A, 646, A161 [EDP Sciences] [Google Scholar]
- Strong, A. W., Moskalenko, I. V., & Ptuskin, V. S. 2007, Annual Review of Nuclear and Particle Science, 57, 285 [NASA ADS] [CrossRef] [Google Scholar]
- Tan, J. C., Beltrán, M. T., Caselli, P., et al. 2014, in Protostars and Planets VI, eds. H. Beuther, R. S. Klessen, C. P. Dullemond, & T. Henning, 149 [Google Scholar]
- Vig, S., Veena, V. S., Mandal, S., Tej, A., & Ghosh, S. K. 2018, MNRAS, 474, 3808 [CrossRef] [Google Scholar]
- Wolf, V., Stecklum, B., Caratti Garatti, A., et al. 2024, A&A, 688, A8 [NASA ADS] [CrossRef] [EDP Sciences] [Google Scholar]
- Wolfire, M. G., & Cassinelli, J. P. 1987, ApJ, 319, 850 [NASA ADS] [CrossRef] [Google Scholar]
- Wood, M., Caputo, R., Charles, E., et al. 2017, Astrophysics Source Code Library [record ascl:1812.006] [Google Scholar]
- Yan, D. H., Zhou, J. N., & Zhang, P. F. 2022, Res. Astron. Astrophys., 22 [Google Scholar]
- Zabalza, V. 2015, Proc. of International Cosmic Ray Conference, 2015, 922 [NASA ADS] [Google Scholar]
- Zhang, M. 2023, ApJS, 265, 59 [NASA ADS] [CrossRef] [Google Scholar]
- Zucker, C., Speagle, J. S., Schlafly, E. F., et al. 2020, A&A, 633, A51 [NASA ADS] [CrossRef] [EDP Sciences] [Google Scholar]
All Tables
Comparison of the different models for computing the spectrum of the γ-ray detection.
Comparison between the coordinates of IRAS 18162−2048 (Fernández-López et al. 2023) obtained with the Atacama Large Milimiter Array (ALMA) and the best position obtained for the Fermi-LAT source.
Integrated energy of the particle distribution and injection time required to accelerate all the particles of the distribution.
All Figures
|
Fig. 1. 4FGL DR4 source map for our ROI. the contours illustrate the Galactic plane emission at the 97th, 99th, 99.7th, and 99.9th percentile based on the gll_iem_v07 template. The magenta circle indicates the region where the normalization parameter were set free to compute the fit model of the ROI. In addition, Galactic diffuse emission and isotropic emission were also set to free. |
| In the text | |
|
Fig. 2. TS maps for a 5° ×5° region centered on IRAS 18162−2048. Contour maps show the detection significance, while color maps indicate the TS value of each spatial bin. The green cross indicates the position of the protostar driving the HH 80-81 system. Panels (a), (b), and (c) show the significance map for HH 80-81 above 300 MeV, 500 MeV, and 700 MeV, respectively. Panel (d) shows the residual TS map above 300 MeV as proof of the reliability of our fit model. |
| In the text | |
|
Fig. 3. SED of the source of interest. Blue circles represent the significant points obtained from our analysis, while blue arrows show the upper limits for those energy bins that do not reach a minimum TS value of 4. The blue line shows the power-law fit resulting from this work and the blue box shows the parameters described in Eq. (1). The previous analysis performed by Yan et al. (2022) is shown in gray. |
| In the text | |
|
Fig. 4. Variability of the γ-ray energy flux of the source of interest over 15 years of observations. The dark blue points indicate the γ-ray flux during periods in which the source detection exceeds the 2σ threshold. For undetected time intervals, upper limits are shown with arrows, representing the 95% confidence level. Besides, light blue points show the flux derived using those insignificant points, providing an indication of the behavior of the source during those periods. The horizontal dashed line and shaded area represent the detected energy flux over the 15 years of observations and the 1σ uncertainty area, respectively. |
| In the text | |
|
Fig. 5. Best location of the γ-ray detection that maximizes the likelihood of our model. White contours represent the uncertainty of the modeled position, while the color map shows the TS of the excess related to HH 80-81. The cyan mark indicates the position of 4FGL J1818.5−2036, which was removed from the initial model due to its relation to the HH 80-81 system. |
| In the text | |
|
Fig. 6. Relevant timescales for the HH 80-81 system. Solid lines show the cooling timescales for different emission models. The dashed black line represents the estimated age of the jet, and the dash-dotted green line indicates the minimum time required to accelerate particles up to different energies based on the jet properties. |
| In the text | |
|
Fig. 7. SED fitting for leptonic and hadronic models of γ-ray production. Grey points represent the Fermi-LAT emission from Fig. 3 obtained in this work. Shaded areas show the 1σ error for both fittings. |
| In the text | |
|
Fig. 8. Comparison between γ-ray emission and molecular clouds in the region of HH 80-81. The color map in the background shows a high-resolution IR map from the band A (8 μm) of the MSX experiment (Egan et al. 2003), which is used to locate HH 80-81 (magenta square). Solid green contours indicate the column density of the molecular gas in the vicinity of HH 80-81. The warm color map displays a detection map based on the square root of the TS related to the three 4FGL sources populating the molecular complex, with magenta crosses locating the other two 4FGL sources apart from HH 80-81. The dashed contour indicates the 5σ detection area of HH 80-81 (see Fig. 2). |
| In the text | |
Current usage metrics show cumulative count of Article Views (full-text article views including HTML views, PDF and ePub downloads, according to the available data) and Abstracts Views on Vision4Press platform.
Data correspond to usage on the plateform after 2015. The current usage metrics is available 48-96 hours after online publication and is updated daily on week days.
Initial download of the metrics may take a while.