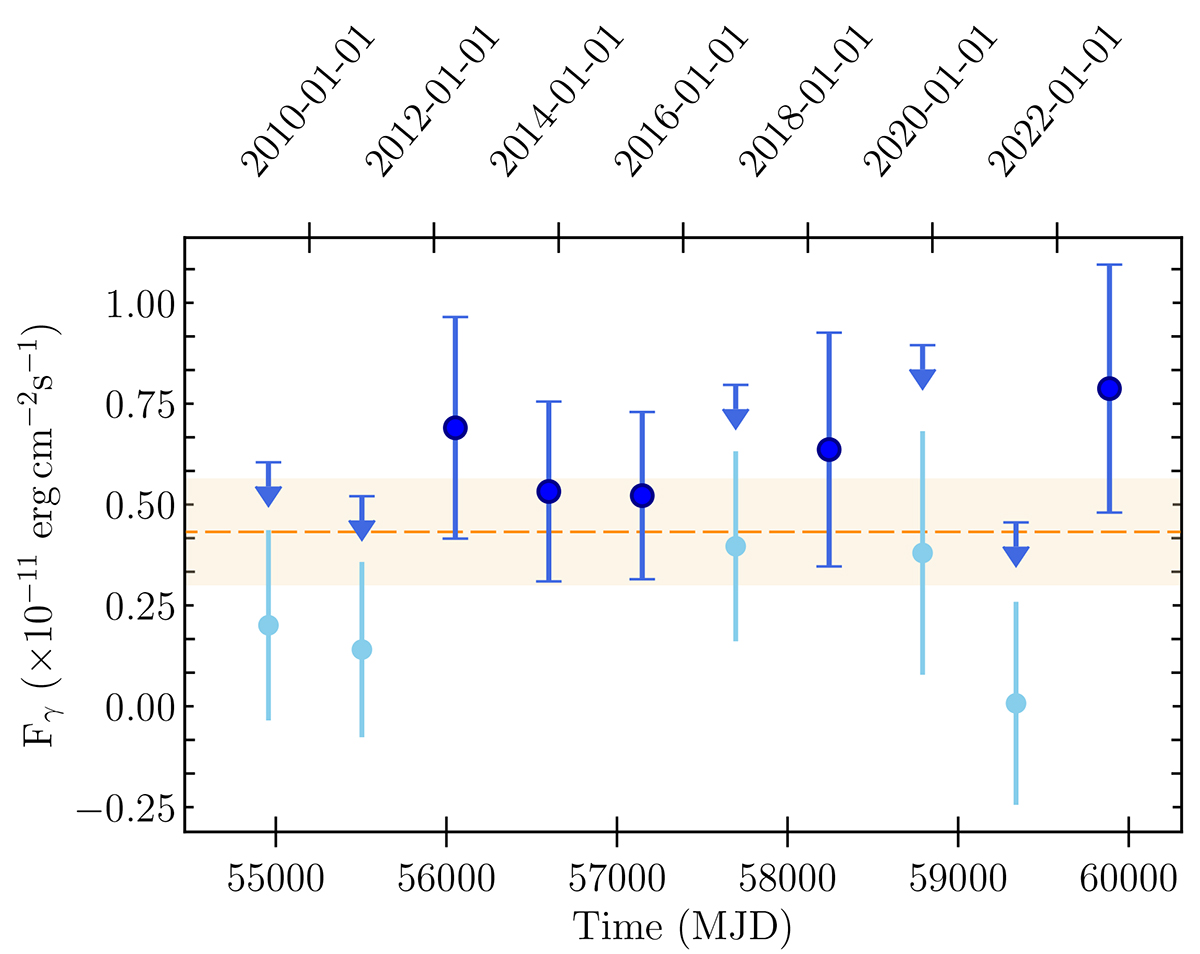
Fig. 4.
Download original image
Variability of the γ-ray energy flux of the source of interest over 15 years of observations. The dark blue points indicate the γ-ray flux during periods in which the source detection exceeds the 2σ threshold. For undetected time intervals, upper limits are shown with arrows, representing the 95% confidence level. Besides, light blue points show the flux derived using those insignificant points, providing an indication of the behavior of the source during those periods. The horizontal dashed line and shaded area represent the detected energy flux over the 15 years of observations and the 1σ uncertainty area, respectively.
Current usage metrics show cumulative count of Article Views (full-text article views including HTML views, PDF and ePub downloads, according to the available data) and Abstracts Views on Vision4Press platform.
Data correspond to usage on the plateform after 2015. The current usage metrics is available 48-96 hours after online publication and is updated daily on week days.
Initial download of the metrics may take a while.