Fig. 1.
Download original image
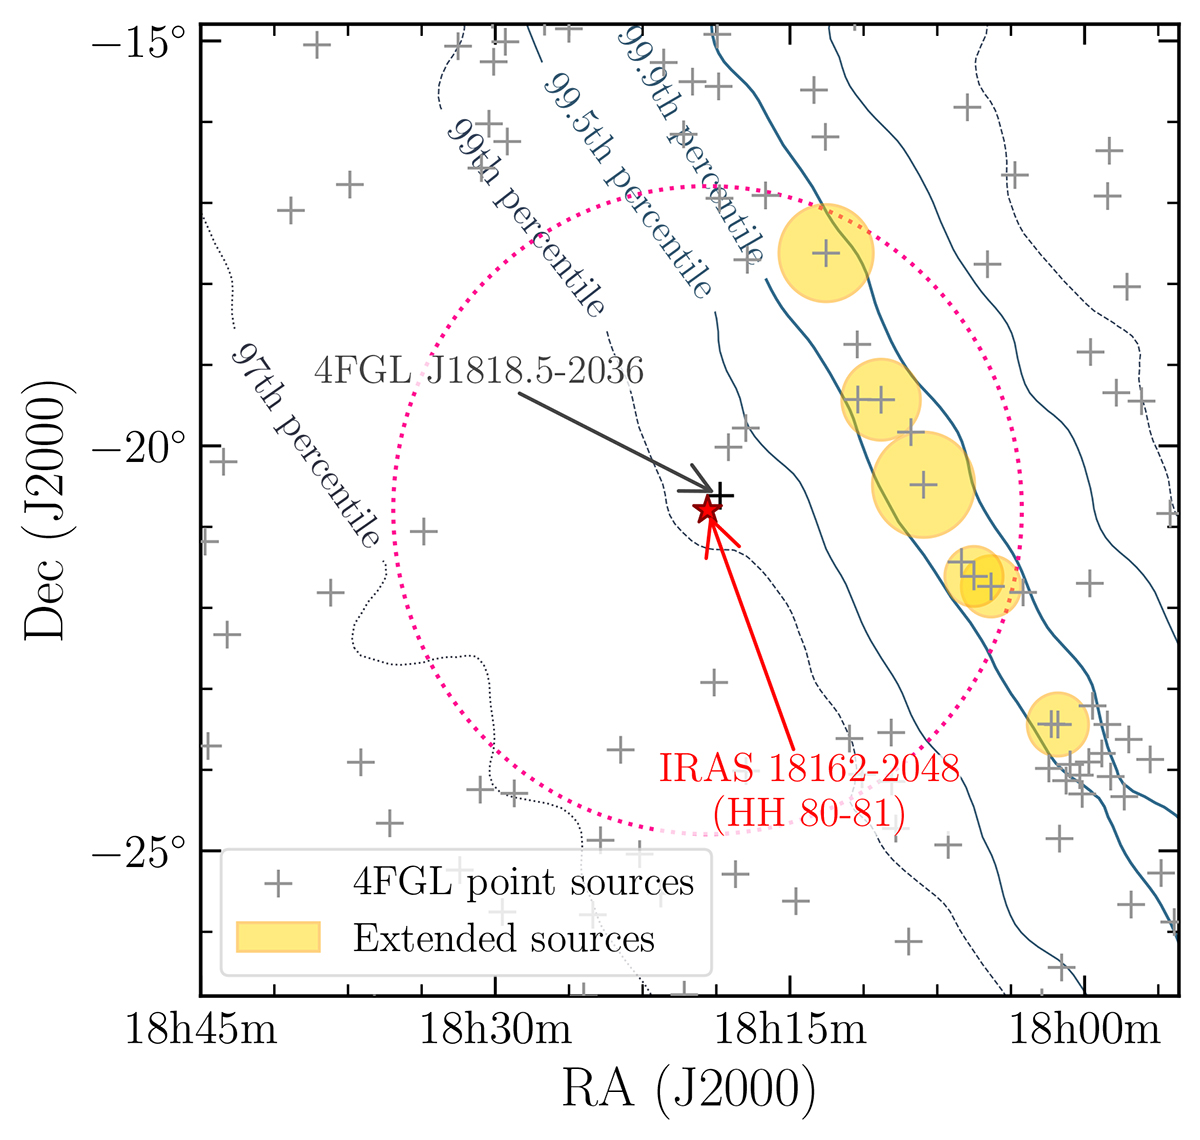
4FGL DR4 source map for our ROI. the contours illustrate the Galactic plane emission at the 97th, 99th, 99.7th, and 99.9th percentile based on the gll_iem_v07 template. The magenta circle indicates the region where the normalization parameter were set free to compute the fit model of the ROI. In addition, Galactic diffuse emission and isotropic emission were also set to free.
Current usage metrics show cumulative count of Article Views (full-text article views including HTML views, PDF and ePub downloads, according to the available data) and Abstracts Views on Vision4Press platform.
Data correspond to usage on the plateform after 2015. The current usage metrics is available 48-96 hours after online publication and is updated daily on week days.
Initial download of the metrics may take a while.