Fig. 8.
Download original image
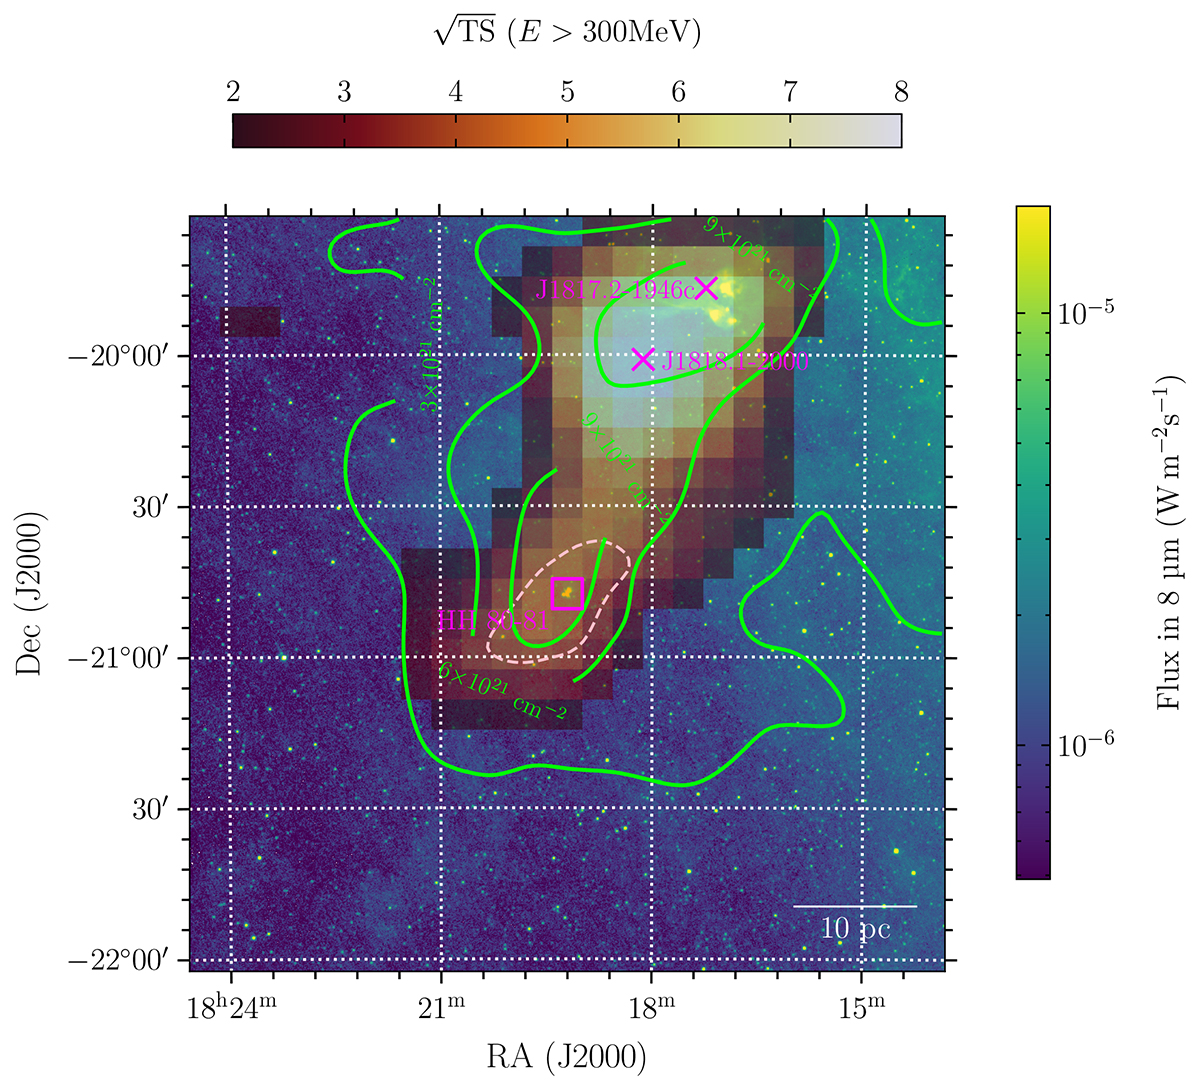
Comparison between γ-ray emission and molecular clouds in the region of HH 80-81. The color map in the background shows a high-resolution IR map from the band A (8 μm) of the MSX experiment (Egan et al. 2003), which is used to locate HH 80-81 (magenta square). Solid green contours indicate the column density of the molecular gas in the vicinity of HH 80-81. The warm color map displays a detection map based on the square root of the TS related to the three 4FGL sources populating the molecular complex, with magenta crosses locating the other two 4FGL sources apart from HH 80-81. The dashed contour indicates the 5σ detection area of HH 80-81 (see Fig. 2).
Current usage metrics show cumulative count of Article Views (full-text article views including HTML views, PDF and ePub downloads, according to the available data) and Abstracts Views on Vision4Press platform.
Data correspond to usage on the plateform after 2015. The current usage metrics is available 48-96 hours after online publication and is updated daily on week days.
Initial download of the metrics may take a while.