Fig. 5.
Download original image
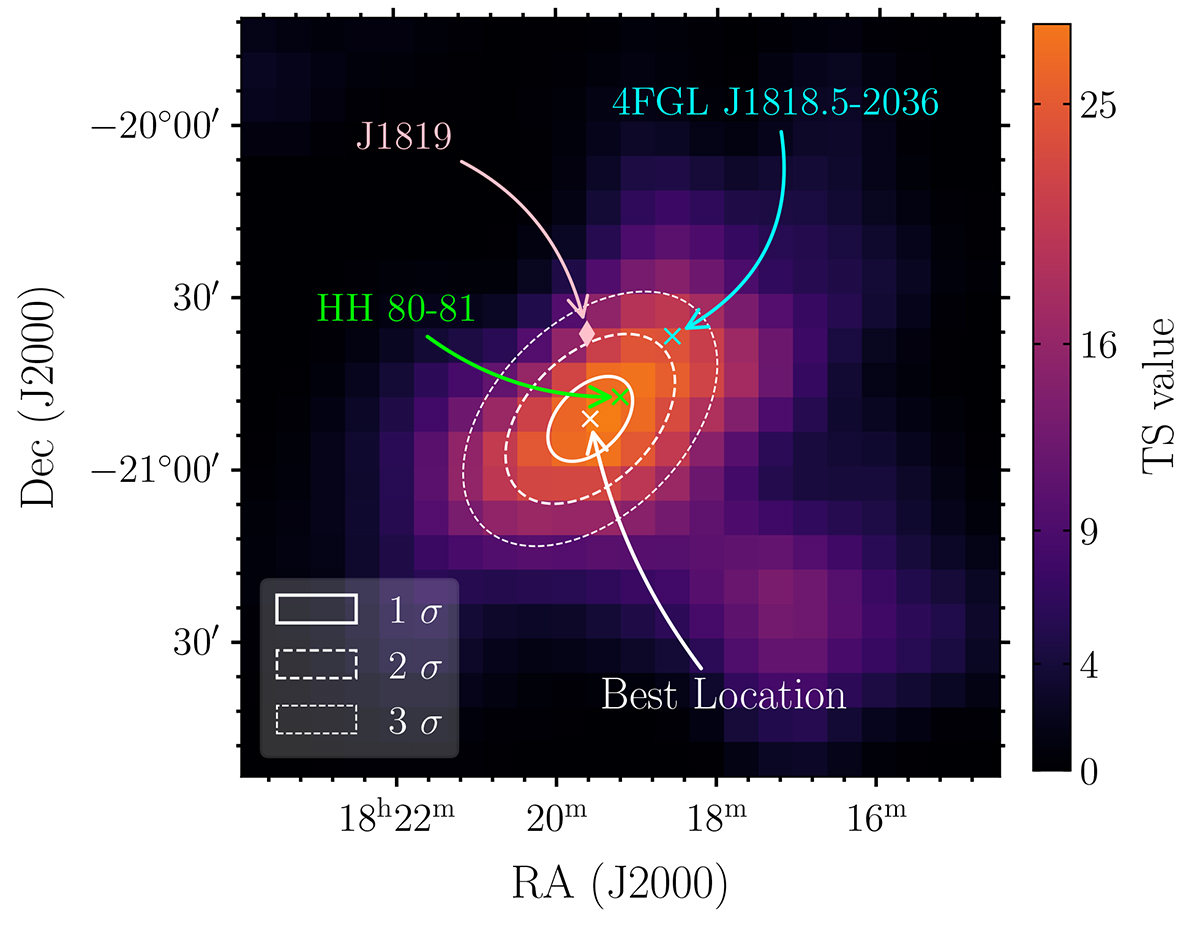
Best location of the γ-ray detection that maximizes the likelihood of our model. White contours represent the uncertainty of the modeled position, while the color map shows the TS of the excess related to HH 80-81. The cyan mark indicates the position of 4FGL J1818.5−2036, which was removed from the initial model due to its relation to the HH 80-81 system.
Current usage metrics show cumulative count of Article Views (full-text article views including HTML views, PDF and ePub downloads, according to the available data) and Abstracts Views on Vision4Press platform.
Data correspond to usage on the plateform after 2015. The current usage metrics is available 48-96 hours after online publication and is updated daily on week days.
Initial download of the metrics may take a while.