Fig. 2.
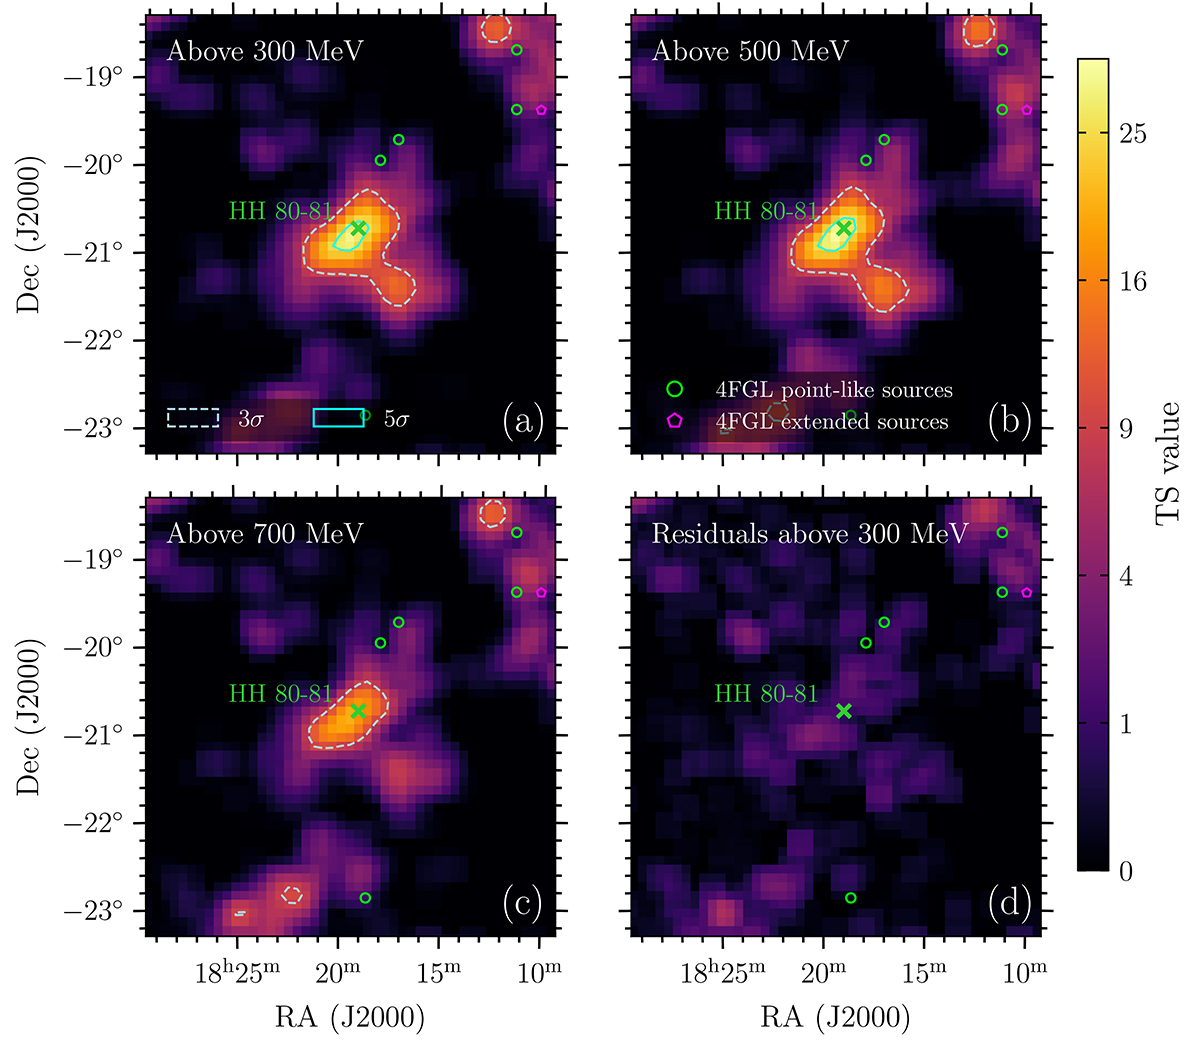
Download original image
TS maps for a 5° ×5° region centered on IRAS 18162−2048. Contour maps show the detection significance, while color maps indicate the TS value of each spatial bin. The green cross indicates the position of the protostar driving the HH 80-81 system. Panels (a), (b), and (c) show the significance map for HH 80-81 above 300 MeV, 500 MeV, and 700 MeV, respectively. Panel (d) shows the residual TS map above 300 MeV as proof of the reliability of our fit model.
Current usage metrics show cumulative count of Article Views (full-text article views including HTML views, PDF and ePub downloads, according to the available data) and Abstracts Views on Vision4Press platform.
Data correspond to usage on the plateform after 2015. The current usage metrics is available 48-96 hours after online publication and is updated daily on week days.
Initial download of the metrics may take a while.