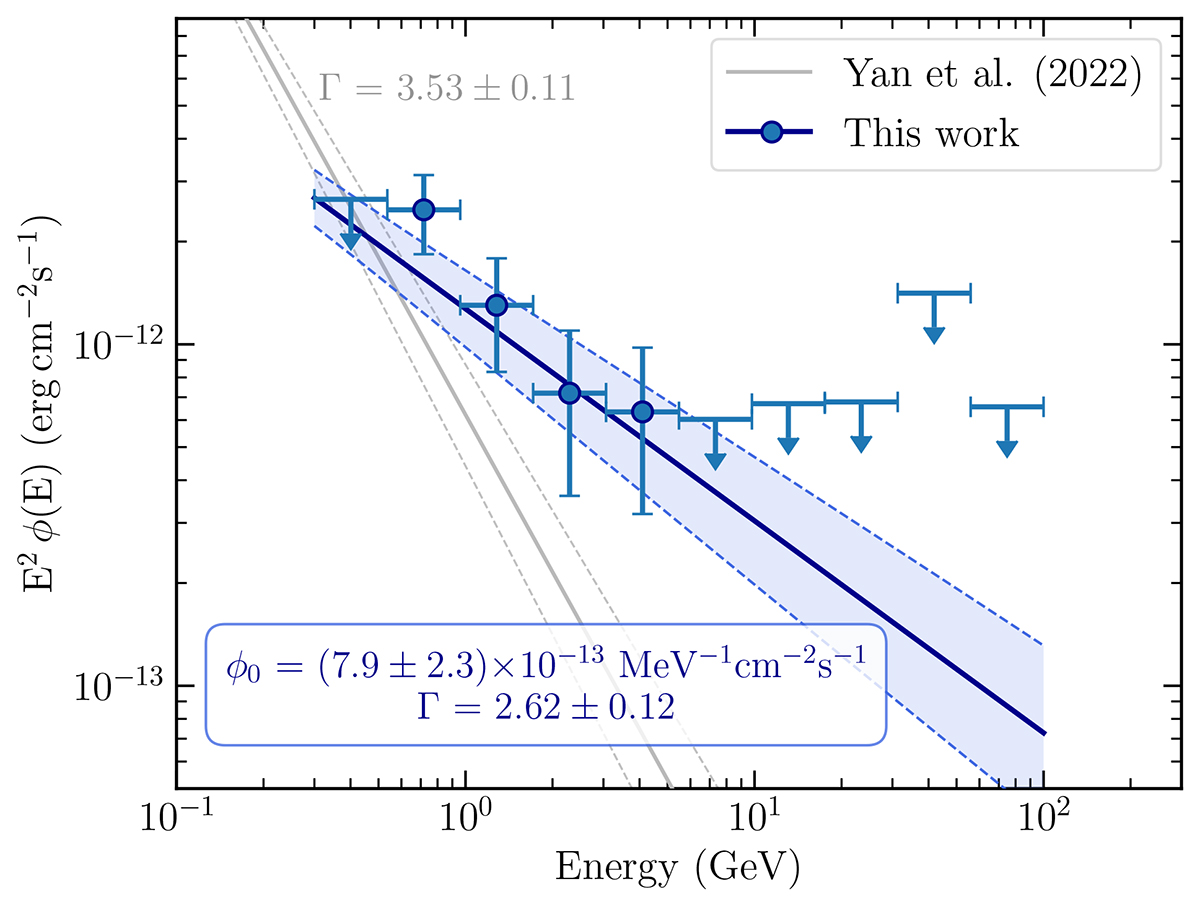
Fig. 3.
Download original image
SED of the source of interest. Blue circles represent the significant points obtained from our analysis, while blue arrows show the upper limits for those energy bins that do not reach a minimum TS value of 4. The blue line shows the power-law fit resulting from this work and the blue box shows the parameters described in Eq. (1). The previous analysis performed by Yan et al. (2022) is shown in gray.
Current usage metrics show cumulative count of Article Views (full-text article views including HTML views, PDF and ePub downloads, according to the available data) and Abstracts Views on Vision4Press platform.
Data correspond to usage on the plateform after 2015. The current usage metrics is available 48-96 hours after online publication and is updated daily on week days.
Initial download of the metrics may take a while.