| Issue |
A&A
Volume 695, March 2025
|
|
|---|---|---|
| Article Number | A259 | |
| Number of page(s) | 15 | |
| Section | Extragalactic astronomy | |
| DOI | https://doi.org/10.1051/0004-6361/202451849 | |
| Published online | 28 March 2025 | |
Euclid preparation
LXIV. The Cosmic Dawn Survey (DAWN) of the Euclid Deep and Auxiliary Fields
1
Cosmic Dawn Center (DAWN), Denmark
2
Niels Bohr Institute, University of Copenhagen, Jagtvej 128, 2200 Copenhagen, Denmark
3
Institute for Astronomy, University of Hawaii, 2680 Woodlawn Drive, Honolulu, HI 96822, USA
4
Physics and Astronomy Department, University of California, 900 University Ave., Riverside, CA 92521, USA
5
Department of Astronomy, University of Massachusetts, Amherst, MA 01003, USA
6
Lawrence Berkeley National Laboratory, One Cyclotron Road, Berkeley, CA 94720, USA
7
Carnegie Observatories, Pasadena, CA 91101, USA
8
Jet Propulsion Laboratory, California Institute of Technology, 4800 Oak Grove Drive, Pasadena, CA 91109, USA
9
Aix-Marseille Université, CNRS, CNES, LAM, Marseille, France
10
Institut d’Astrophysique de Paris, UMR 7095, CNRS, and Sorbonne Université, 98 bis boulevard Arago, 75014 Paris, France
11
Instituto de Astrofísica e Ciências do Espaço, Universidade do Porto, CAUP, Rua das Estrelas, PT4150-762 Porto, Portugal
12
INAF-Osservatorio Astronomico di Roma, Via Frascati 33, 00078 Monteporzio Catone, Italy
13
Infrared Processing and Analysis Center, California Institute of Technology, Pasadena, CA 91125, USA
14
The University of Texas at Austin, Austin, TX 78712, USA
15
Canada-France-Hawaii Telescope, 65-1238 Mamalahoa Hwy, Kamuela, HI 96743, USA
16
Center for Frontier Science, Chiba University, 1-33 Yayoi-cho, Inage-ku, Chiba 263-8522, Japan
17
NRC Herzberg, 5071 West Saanich Rd, Victoria, BC V9E 2E7, Canada
18
Institute for Cosmic Ray Research, The University of Tokyo, 5-1-5 Kashiwanoha, Kashiwa, Chiba 277-8582, Japan
19
Department of Physics, School of Advanced Science and Engineering, Faculty of Science and Engineering, Waseda University, 3-4-1 Okubo, Shinjuku, 169-8555 Tokyo, Japan
20
Waseda Research Institute for Science and Engineering, Faculty of Science and Engineering, Waseda University, 3-4-1 Okubo, Shinjuku, Tokyo 169-8555, Japan
21
Universitäts-Sternwarte München, Fakultät für Physik, Ludwig-Maximilians-Universität München, Scheinerstrasse 1, 81679 München, Germany
22
Max Planck Institute for Extraterrestrial Physics, Giessenbachstr. 1, 85748 Garching, Germany
23
Department of Astronomy, University of Geneva, ch. d’Ecogia 16, 1290 Versoix, Switzerland
24
National Astronomical Observatory of Japan, 2-21-1 Osawa, Mitaka, Tokyo 181-8588, Japan
25
Department of Astronomical Science, SOKENDAI (The Graduate University for Advanced Studies), Osawa 2-21-1, Mitaka, Tokyo 181-8588, Japan
26
Kavli Institute for the Physics and Mathematics of the Universe (WPI), University of Tokyo, Kashiwa, Chiba 277-8583, Japan
27
Department of Physics, Graduate School of Science, Chiba University, 1-33 Yayoi-Cho, Inage-Ku, Chiba 263-8522, Japan
28
Leiden Observatory, Leiden University, Einsteinweg 55, 2333 CC Leiden, The Netherlands
29
Department of Astronomy & Physics and Institute for Computational Astrophysics, Saint Mary’s University, 923 Robie Street, Halifax, Nova Scotia B3H 3C3, Canada
30
INFN-Sezione di Roma, Piazzale Aldo Moro, 2 – c/o Dipartimento di Fisica, Edificio G. Marconi, 00185 Roma, Italy
31
Minnesota Institute for Astrophysics, University of Minnesota, 116 Church St SE, Minneapolis, MN 55455, USA
32
Department of Astronomy, School of Science, The University of Tokyo, 7-3-1 Hongo, Bunkyo, Tokyo 113-0033, Japan
33
Center for Data-Driven Discovery, Kavli IPMU (WPI), UTIAS, The University of Tokyo, Kashiwa, Chiba 277-8583, Japan
34
Institut d’Astrophysique de Paris, 98 bis Boulevard Arago, 75014 Paris, France
35
ESAC/ESA, Camino Bajo del Castillo s/n, Urb. Villafranca del Castillo, 28692 Villanueva de la Cañada, Madrid, Spain
36
School of Mathematics and Physics, University of Surrey, Guildford, Surrey GU2 7XH, UK
37
INAF-Osservatorio Astronomico di Brera, Via Brera 28, 20122 Milano, Italy
38
INAF-Osservatorio di Astrofisica e Scienza dello Spazio di Bologna, Via Piero Gobetti 93/3, 40129 Bologna, Italy
39
Université Paris-Saclay, Université Paris Cité, CEA, CNRS, AIM, 91191 Gif-sur-Yvette, France
40
SISSA, International School for Advanced Studies, Via Bonomea 265, 34136 Trieste, TS, Italy
41
INAF-Osservatorio Astronomico di Trieste, Via G. B. Tiepolo 11, 34143 Trieste, Italy
42
INFN, Sezione di Trieste, Via Valerio 2, 34127 Trieste, TS, Italy
43
IFPU, Institute for Fundamental Physics of the Universe, via Beirut 2, 34151 Trieste, Italy
44
Dipartimento di Fisica e Astronomia, Università di Bologna, Via Gobetti 93/2, 40129 Bologna, Italy
45
INFN-Sezione di Bologna, Viale Berti Pichat 6/2, 40127 Bologna, Italy
46
INAF-Osservatorio Astrofisico di Torino, Via Osservatorio 20, 10025 Pino Torinese (TO), Italy
47
Dipartimento di Fisica, Università di Genova, Via Dodecaneso 33, 16146 Genova, Italy
48
INFN-Sezione di Genova, Via Dodecaneso 33, 16146 Genova, Italy
49
Department of Physics “E. Pancini”, University Federico II, Via Cinthia 6, 80126 Napoli, Italy
50
INAF-Osservatorio Astronomico di Capodimonte, Via Moiariello 16, 80131 Napoli, Italy
51
INFN section of Naples, Via Cinthia 6, 80126 Napoli, Italy
52
Dipartimento di Fisica, Università degli Studi di Torino, Via P. Giuria 1, 10125 Torino, Italy
53
INFN-Sezione di Torino, Via P. Giuria 1, 10125 Torino, Italy
54
INAF-IASF Milano, Via Alfonso Corti 12, 20133 Milano, Italy
55
Institut de Física d’Altes Energies (IFAE), The Barcelona Institute of Science and Technology, Campus UAB, 08193 Bellaterra (Barcelona), Spain
56
Port d’InformacióCientífica, Campus UAB, C. Albareda s/n, 08193 Bellaterra (Barcelona), Spain
57
Institute for Theoretical Particle Physics and Cosmology (TTK), RWTH Aachen University, 52056 Aachen, Germany
58
Institute of Space Sciences (ICE, CSIC), Campus UAB, Carrer de Can Magrans s/n, 08193 Barcelona, Spain
59
Institut d’Estudis Espacials de Catalunya (IEEC), Edifici RDIT, Campus UPC, 08860 Castelldefels, Barcelona, Spain
60
Dipartimento di Fisica e Astronomia “Augusto Righi” – Alma Mater Studiorum Università di Bologna, Via Piero Gobetti 93/2, 40129 Bologna, Italy
61
Dipartimento di Fisica e Astronomia “Augusto Righi” – Alma Mater Studiorum Università di Bologna, Viale Berti Pichat 6/2, 40127 Bologna, Italy
62
Instituto de Astrofísica de Canarias, Calle Vía Láctea s/n, 38204 San Cristóbal de La Laguna, Tenerife, Spain
63
Institute for Astronomy, University of Edinburgh, Royal Observatory, Blackford Hill, Edinburgh EH9 3HJ, UK
64
Jodrell Bank Centre for Astrophysics, Department of Physics and Astronomy, University of Manchester, Oxford Road, Manchester M13 9PL, UK
65
European Space Agency/ESRIN, Largo Galileo Galilei 1, 00044 Frascati, Roma, Italy
66
Université Claude Bernard Lyon 1, CNRS/IN2P3, IP2I Lyon, UMR 5822, Villeurbanne F-69100, France
67
Institute of Physics, Laboratory of Astrophysics, École Polytechnique Fédérale de Lausanne (EPFL), Observatoire de Sauverny, 1290 Versoix, Switzerland
68
UCB Lyon 1, CNRS/IN2P3, IUF, IP2I Lyon, 4 rue Enrico Fermi, 69622 Villeurbanne, France
69
Departamento de Física, Faculdade de Ciências, Universidade de Lisboa, Edifício C8, Campo Grande, PT1749-016 Lisboa, Portugal
70
Instituto de Astrofísica e Ciências do Espaço, Faculdade de Ciências, Universidade de Lisboa, Campo Grande, 1749-016 Lisboa, Portugal
71
INAF-Istituto di Astrofisica e Planetologia Spaziali, Via del Fosso del Cavaliere, 100, 00100 Roma, Italy
72
Université Paris-Saclay, CNRS, Institut d’astrophysique spatiale, 91405 Orsay, France
73
INFN-Padova, Via Marzolo 8, 35131 Padova, Italy
74
School of Physics, HH Wills Physics Laboratory, University of Bristol, Tyndall Avenue, Bristol BS8 1TL, UK
75
Istituto Nazionale di Fisica Nucleare, Sezione di Bologna, Via Irnerio 46, 40126 Bologna, Italy
76
INAF-Osservatorio Astronomico di Padova, Via dell’Osservatorio 5, 35122 Padova, Italy
77
Dipartimento di Fisica “Aldo Pontremoli”, Università degli Studi di Milano, Via Celoria 16, 20133 Milano, Italy
78
Department of Physics, Lancaster University, Lancaster LA1 4YB, UK
79
von Hoerner & Sulger GmbH, Schlossplatz 8, 68723 Schwetzingen, Germany
80
Technical University of Denmark, Elektrovej 327, 2800 Kgs. Lyngby, Denmark
81
Max-Planck-Institut für Astronomie, Königstuhl 17, 69117 Heidelberg, Germany
82
Department of Physics and Helsinki Institute of Physics, Gustaf Hällströmin katu 2, 00014 University of Helsinki, Finland
83
Aix-Marseille Université, CNRS/IN2P3, CPPM, Marseille, France
84
Mullard Space Science Laboratory, University College London, Holmbury St Mary, Dorking, Surrey RH5 6NT, UK
85
Université de Genève, Département de Physique Théorique and Centre for Astroparticle Physics, 24 quai Ernest-Ansermet, CH-1211 Genève 4, Switzerland
86
Department of Physics, PO Box 64 00014 University of Helsinki, Finland
87
Helsinki Institute of Physics, University of Helsinki, Gustaf Hällströmin katu 2, Helsinki, Finland
88
Institute of Theoretical Astrophysics, University of Oslo, PO Box 1029 Blindern, 0315 Oslo, Norway
89
NOVA optical infrared instrumentation group at ASTRON, Oude Hoogeveensedijk 4, 7991 PD Dwingeloo, The Netherlands
90
Centre de Calcul de l’IN2P3/CNRS, 21 Avenue Pierre de Coubertin, 69627 Villeurbanne Cedex, France
91
Universität Bonn, Argelander-Institut für Astronomie, Auf dem Hügel 71, 53121 Bonn, Germany
92
Department of Physics, Institute for Computational Cosmology, Durham University, South Road DH1 3LE, UK
93
Université Côte d’Azur, Observatoire de la Côte d’Azur, CNRS, Laboratoire Lagrange, Bd de l’Observatoire, CS 34229, 06304 Nice Cedex 4, France
94
Université Paris Cité, CNRS, Astroparticule et Cosmologie, 75013 Paris, France
95
University of Applied Sciences and Arts of Northwestern Switzerland, School of Engineering, 5210 Windisch, Switzerland
96
European Space Agency/ESTEC, Keplerlaan 1, 2201 AZ Noordwijk, The Netherlands
97
School of Mathematics, Statistics and Physics, Newcastle University, Herschel Building, Newcastle-upon-Tyne NE1 7RU, UK
98
Department of Physics and Astronomy, University of Aarhus, Ny Munkegade 120, DK-8000 Aarhus C, Denmark
99
Waterloo Centre for Astrophysics, University of Waterloo, Waterloo, Ontario N2L 3G1, Canada
100
Department of Physics and Astronomy, University of Waterloo, Waterloo, Ontario N2L 3G1, Canada
101
Perimeter Institute for Theoretical Physics, Waterloo, Ontario N2L 2Y5, Canada
102
Space Science Data Center, Italian Space Agency, Via del Politecnico snc, 00133 Roma, Italy
103
Centre National d’Études Spatiales – Centre spatial de Toulouse, 18 avenue Edouard Belin, 31401 Toulouse Cedex 9, France
104
Institute of Space Science, Str. Atomistilor, nr. 409 Măgurele, Ilfov 077125, Romania
105
Departamento de Astrofísica, Universidad de La Laguna, 38206 La Laguna, Tenerife, Spain
106
Dipartimento di Fisica e Astronomia “G. Galilei”, Università di Padova, Via Marzolo 8, 35131 Padova, Italy
107
Institut für Theoretische Physik, University of Heidelberg, Philosophenweg 16, 69120 Heidelberg, Germany
108
Institut de Recherche en Astrophysique et Planétologie (IRAP), Université de Toulouse, CNRS, UPS, CNES, 14 Av. Edouard Belin, 31400 Toulouse, France
109
Université St Joseph; Faculty of Sciences, Beirut, Lebanon
110
Departamento de Física, FCFM, Universidad de Chile, Blanco Encalada 2008, Santiago, Chile
111
Universität Innsbruck, Institut für Astro- und Teilchenphysik, Technikerstr. 25/8, 6020 Innsbruck, Austria
112
Satlantis, University Science Park, Sede Bld 48940, Leioa-Bilbao, Spain
113
Centro de Investigaciones Energéticas, Medioambientales y Tecnológicas (CIEMAT), Avenida Complutense 40, 28040 Madrid, Spain
114
Instituto de Astrofísica e Ciências do Espaço, Faculdade de Ciências, Universidade de Lisboa, Tapada da Ajuda, 1349-018 Lisboa, Portugal
115
Universidad Politécnica de Cartagena, Departamento de Electrónica y Tecnología de Computadoras, Plaza del Hospital 1, 30202 Cartagena, Spain
116
Kapteyn Astronomical Institute, University of Groningen, PO Box 800 9700 AV Groningen, The Netherlands
117
INFN-Bologna, Via Irnerio 46, 40126 Bologna, Italy
118
INAF, Istituto di Radioastronomia, Via Piero Gobetti 101, 40129 Bologna, Italy
119
Junia, EPA department, 41 Bd Vauban, 59800 Lille, France
120
ICSC – Centro Nazionale di Ricerca in High Performance Computing, Big Data e Quantum Computing, Via Magnanelli 2, Bologna, Italy
121
Instituto de Física Teórica UAM-CSIC, Campus de Cantoblanco, 28049 Madrid, Spain
122
CERCA/ISO, Department of Physics, Case Western Reserve University, 10900 Euclid Avenue, Cleveland, OH 44106, USA
123
Laboratoire Univers et Théorie, Observatoire de Paris, Université PSL, Université Paris Cité, CNRS, 92190 Meudon, France
124
Dipartimento di Fisica e Scienze della Terra, Università degli Studi di Ferrara, Via Giuseppe Saragat 1, 44122 Ferrara, Italy
125
Istituto Nazionale di Fisica Nucleare, Sezione di Ferrara, Via Giuseppe Saragat 1, 44122 Ferrara, Italy
126
Université de Strasbourg, CNRS, Observatoire astronomique de Strasbourg, UMR 7550, 67000 Strasbourg, France
127
Dipartimento di Fisica – Sezione di Astronomia, Università di Trieste, Via Tiepolo 11, 34131 Trieste, Italy
128
NASA Ames Research Center, Moffett Field, CA 94035, USA
129
Bay Area Environmental Research Institute, Moffett Field, California 94035, USA
130
Institute Lorentz, Leiden University, Niels Bohrweg 2, 2333 CA Leiden, The Netherlands
131
Department of Physics & Astronomy, University of California Irvine, Irvine, CA 92697, USA
132
Departamento Física Aplicada, Universidad Politécnica de Cartagena, Campus Muralla del Mar, 30202 Cartagena, Murcia, Spain
133
Department of Physics, Oxford University, Keble Road, Oxford OX1 3RH, UK
134
CEA Saclay, DFR/IRFU, Service d’Astrophysique, Bât. 709, 91191 Gif-sur-Yvette, France
135
Institute of Cosmology and Gravitation, University of Portsmouth, Portsmouth PO1 3FX, UK
136
Department of Computer Science, Aalto University, PO Box 15400 Espoo FI-00 076, Finland
137
Ruhr University Bochum, Faculty of Physics and Astronomy, Astronomical Institute (AIRUB), German Centre for Cosmological Lensing (GCCL), 44780 Bochum, Germany
138
DARK, Niels Bohr Institute, University of Copenhagen, Jagtvej 155, 2200 Copenhagen, Denmark
139
Instituto de Astrofísica de Canarias (IAC), Departamento de Astrofísica, Universidad de La Laguna (ULL), 38200 La Laguna, Tenerife, Spain
140
Université PSL, Observatoire de Paris, Sorbonne Université, CNRS, LERMA, 75014 Paris, France
141
Université Paris-Cité, 5 Rue Thomas Mann, 75013 Paris, France
142
Department of Physics and Astronomy, Vesilinnantie 5, 20014 University of Turku, Finland
143
Serco for European Space Agency (ESA), Camino bajo del Castillo s/n, Urbanizacion Villafranca del Castillo, Villanueva de la Cañada, 28692 Madrid, Spain
144
ARC Centre of Excellence for Dark Matter Particle Physics, Melbourne, Australia
145
Centre for Astrophysics & Supercomputing, Swinburne University of Technology, Hawthorn, Victoria 3122, Australia
146
School of Physics and Astronomy, Queen Mary University of London, Mile End Road, London E1 4NS, UK
147
Department of Physics and Astronomy, University of the Western Cape, Bellville, Cape Town 7535, South Africa
148
ICTP South American Institute for Fundamental Research, Instituto de Física Teórica, Universidade Estadual Paulista, São Paulo, Brazil
149
Oskar Klein Centre for Cosmoparticle Physics, Department of Physics, Stockholm University, Stockholm SE-106 91, Sweden
150
Astrophysics Group, Blackett Laboratory, Imperial College London, London SW7 2AZ, UK
151
Univ. Grenoble Alpes, CNRS, Grenoble INP, LPSC-IN2P3, 53 Avenue des Martyrs, 38000 Grenoble, France
152
INAF-Osservatorio Astrofisico di Arcetri, Largo E. Fermi 5, 50125 Firenze, Italy
153
Dipartimento di Fisica, Sapienza Università di Roma, Piazzale Aldo Moro 2, 00185 Roma, Italy
154
Centro de Astrofísica da Universidade do Porto, Rua das Estrelas, 4150-762 Porto, Portugal
155
Zentrum für Astronomie, Universität Heidelberg, Philosophenweg 12, 69120 Heidelberg, Germany
156
Thales Alenia Space – Euclid satellite Prime contractor, Strada Antica di Collegno 253, 10146 Torino, Italy
157
Institute of Astronomy, University of Cambridge, Madingley Road, Cambridge CB3 0HA, UK
158
Department of Astrophysics, University of Zurich, Winterthurerstrasse 190, 8057 Zurich, Switzerland
159
Dipartimento di Fisica, Università degli studi di Genova, and INFN-Sezione di Genova, Via Dodecaneso 33, 16146 Genova, Italy
160
Theoretical astrophysics, Department of Physics and Astronomy, Uppsala University, Box 515 751 20 Uppsala, Sweden
161
Department of Physics and Astronomy, University of California, Davis, CA 95616, USA
162
Department of Astrophysical Sciences, Peyton Hall, Princeton University, Princeton, NJ 08544, USA
163
Center for Cosmology and Particle Physics, Department of Physics, New York University, New York, NY 10003, USA
164
Center for Computational Astrophysics, Flatiron Institute, 162 5th Avenue, 10010 New York, NY, USA
165
School of Physics & Astronomy, University of Southampton, Highfield Campus, Southampton SO17 1BJ, UK
⋆ Corresponding author; This email address is being protected from spambots. You need JavaScript enabled to view it.
Received:
9
August
2024
Accepted:
10
December
2024
Abstract
Euclid will provide deep near-infrared (NIR) imaging to ∼26.5 AB magnitude over ∼59 deg2 in its deep and auxiliary fields. The Cosmic DAWN survey combines dedicated and archival UV–NIR observations to provide matched depth multiwavelength imaging of the Euclid deep and auxiliary fields. The DAWN survey will provide consistently measured Euclid NIR-selected photometric catalogues, accurate photometric redshifts, and measurements of galaxy properties to a redshift of z ∼ 10. The DAWN catalogues include Spitzer IRAC data that are critical for stellar mass measurements at z ≳ 2.5 and high-z science. These catalogues complement the standard Euclid catalogues, which will not include Spitzer IRAC data. In this paper, we present an overview of the survey, including the footprints of the survey fields, the existing and planned observations, and the primary science goals for the combined data set.
Key words: catalogs / surveys / galaxies: evolution / galaxies: high-redshift / galaxies: luminosity function / mass function
© The Authors 2025
 Open Access article, published by EDP Sciences, under the terms of the Creative Commons Attribution License (https://creativecommons.org/licenses/by/4.0), which permits unrestricted use, distribution, and reproduction in any medium, provided the original work is properly cited.
This article is published in open access under the Subscribe to Open model. This email address is being protected from spambots. You need JavaScript enabled to view it. to support open access publication.
1. Introduction
The Euclid mission (Laureijs et al. 2011; Euclid Collaboration: Mellier et al. 2024; Euclid Collaboration: Cropper et al. 2025; Euclid Collaboration: Jahnke et al. 2025) is designed to constrain the properties of dark matter and dark energy through weak lensing, galaxy cluster counts, and clustering measurements. The majority of the six-year mission will be spent carrying out wide-area imaging and a spectroscopic survey, namely the Euclid Wide Survey (EWS; Euclid Collaboration: Scaramella et al. 2022), covering roughly 14 000 deg2 of the extragalactic sky. The EWS will measure the shape and colour of billions of galaxies from imaging observations in a single broad visible band (IE) and three NIR bands (YE, JE, HE) with expected 5σ point source depths of 26.2 AB for IE and 24.5 AB for YE, JE, and HE (respectively). The spectroscopic component of EWS will measure redshifts for around thirty million galaxies with emission line fluxes of 2 × 10⁻¹⁶ erg cm−2 s−1 at 1.6 μm. Redshifts for the remaining galaxies will be measured photometrically by combining ground-based optical photometry with the Euclid data.
Euclid will also devote 17% of the primary mission time to obtaining deeper observations needed for calibration, control of systematic effects, and characterising the galaxy sample from the EWS. The six Euclid Auxiliary fields (EAFs), which include CDFS, COSMOS, SXDS, VVDS, AEGIS, and GOODS-N (see Sect. 2 for details), each have extensive UV–NIR imaging observations and large catalogues of spectroscopic redshift measurements. Three large (10–20 deg2) Euclid Deep Fields (EDFs), namely EDF-North (EDF-N), EDF-South (EDF-S), and EDF-Fornax (EDF-F), were also selected for observations that are two magnitudes deeper than EWS. Consistent processing and photometric measurements from the Euclid and ancillary data in the EAFs and EDFs is essential for calibrating photometric redshift measurements and quantifying biases in shape measurements from the broader EWS.
The Cosmic DAWN Survey (DAWN) is a 59 deg2 multiwavelength imaging survey that combines new dedicated observations with archival data with comparable depth to the Euclid data in the EDFs and EAFs. Spitzer data cover all the DAWN fields at 3.6 and 4.5 μm (Euclid Collaboration: Moneti et al. 2022) and incorporate the single largest allocation of Spitzer observing time (Capak et al. 2016). The Hawaii Twenty deg2 Survey (H20; Euclid Collaboration: Zalesky et al. 2025) provides Subaru Hyper Suprime-Cam optical data and CFHT MegaCam UV data for EDF-N and EDF-F. The Hyper Suprime-Cam Subaru Strategic Survey (HSC-SSP Aihara et al. 2018a) provides optical data for COSMOS, SXDS, VVDS, and AEGIS. Additional UV–optical data for EDF-F and EDF-S will also be provided by the Vera C. Rubin Observatory (Ivezić et al. 2019). The CFHT large area U-band deep survey (CLAUDS; Sawicki et al. 2019) and the ongoing Deep Euclid U-band
Survey (DEUS) program provide additional CFHT MegaCam UV data in COSMOS, SXDS, EDF-N, and GOODS-N.
The combination of depth, area, and wavelength coverage makes DAWN an excellent data set for studying galaxy evolution and robustly characterising the z > 4 galaxy population. Deep rest-frame UV–near-IR data are critical for estimating photometric redshifts and physical parameters (e.g. stellar mass, star-formation rate) of galaxies. Robustly characterizing the z > 4 galaxy population requires multiwavelength data that cover observed wavelengths from the near UV (0.3 μm) to NIR (3–5 μm) and are deep enough to detect faint (zAB ∼ 26) galaxies. Large fields (≳10 deg2) are needed to identify rare sources in the high-redshift Universe and probe cosmologically significant volumes (∼1 Gpc3), and making them contiguous allows one to study the evolution of the large-scale structure (LSS) with cosmic time. Existing deep fields with similar depth and wavelength coverage such as the CANDELS fields (Grogin et al. 2011; Koekemoer et al. 2011) and COSMOS deep field (Scoville 2007) are prone to small number statistics and cosmic variance due to the scale of variations in the underlying dark matter density field at high redshifts (see Fig. 1).
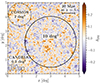 |
Fig. 1. Illustration of the dark matter overdensity, |

The COSMOS field has shown the power of multiwavelength data sets spanning large areas of the sky. The DAWN survey aims to expand on the legacy of COSMOS by providing value-added catalogues with consistently measured Euclid NIR-selected multiwavelength photometry and physical properties in the EDFs and EAFs, which together represent an area 30 times larger than the COSMOS field. By including the Spitzer/IRAC data needed to probe the rest-frame optical at z > 4, the DAWN catalogues are optimised for high-redshift and galaxy evolution science and are thus complementary to the official Euclid catalogues. This paper describes the fields, observations, and science goals of the DAWN survey. A companion paper (Euclid Collaboration: Zalesky et al. 2025) provides the first DAWN survey catalogue of the pre-launch data in EDF-N and EDF-F. Future DAWN data releases (including EDF-S and the EAFs) will follow each of the Euclid data releases.
This work is organised as follows: Section 2 describes the fields covered by the DAWN survey. Sections 3 and 4 summarise the broad-band imaging and spectroscopic observations (respectively) in each field. The main science goals of the survey are discussed in Sections 5 and 6 provides a summary of the survey.
2. Survey fields
The DAWN survey covers each of the EDFs and EAFs. The centre coordinates and area of each field are presented in Table 1, and Fig. 2 shows their positions on an all-sky map. The following subsections give a brief summary of the EDFs and EAFs. For more details, the Euclid overview paper (Euclid Collaboration: Mellier et al. 2025) can be consulted.
Centre coordinates (J2000), area coverage, and foreground dust reddening E(B − V) of the EDFs and EAFs.
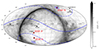 |
Fig. 2. Mollweide projection of the Galactic foreground reddening – E(B − V) – on the celestial sphere from the Planck Collaboration XLVII (2016) generated using the dustmaps Python package (Green 2018). The coordinates of each of the EAFs are indicated with black squares, and the EDFs are highlighted with red stars. The solid blue line shows the ecliptic. The dotted blue lines indicate the continuous viewing zone for the Euclid mission at |

2.1. Euclid Deep Fields
The deepest observations from the Euclid mission focus on three fields: EDF-N, EDF-F, and EDF-S. The locations of EDF-N and EDF-S were strategically chosen to maximise their observability throughout the duration of the Euclid mission. Each field will receive Euclid imaging observations that are 2 mag deeper than the EWS, which is essential for calibration of the bias introduced by noise in weak lensing measurements. The depth and area (see Tables 1 and 2) of the EDFs make them the primary fields for galaxy evolution and high-redshift science from the Euclid mission.
Expected photometric depths for each of the fields covered by the DAWN survey.
The deep feild EDF-N covers a 20 deg2 circular region centred on the North Ecliptic Pole (NEP) in the constellation Draco. Due to its proximity to the ecliptic pole, Euclid has perennial visibility of EDF-N allowing for regularly repeated observations throughout the mission. The deep field EDF-F is a 10 deg2 circular region in the constellation Fornax, and EDF-S covers a 23 deg2 elongated region in the southern constellation of Horologium.
2.2. Euclid Auxiliary Fields
The EAFs focus on well-studied galaxy deep fields (COSMOS, AEGIS, SXDS, VVDS, CDFS, and GOODS-N) and will receive observations from Euclid that are four to five times deeper than the EWS. Due to the large amount of existing multiwavelength data in these fields, the EAFs will be essential for calibrating photometric redshift estimates and the effect of colour gradients in galaxies on shear measurements for the EWS.
The COSMOS EAF (Scoville 2007) has deep multiwavelength observations from X-ray to radio and an extensive spectroscopic database. The COSMOS2020 catalogue (Weaver et al. 2022) provides the most up-to-date compilation of photometry, photo-zs, and stellar mass estimates. The Chandra Deep Field South (CDFS; Giacconi et al. 2002; Luo et al. 2008; Xue et al. 2011) EAF lies within EDF-F and contains one of the deepest observations by the Chandra X-ray observatory as well as complementary observations from UV to radio. Two EAFs lie within the XMM Large Scale Structure (XMM-LSS) survey field (Clerc et al. 2014): the Subaru/XMM-Newton Deep Survey (SXDS; Sekiguchi et al. 2004) and the VIMOS VLT Deep Survey (VVDS; Le Fèvre et al. 2005a). The SXDS EAF overlaps with the UKIRT Infrared Deep Sky Survey (UKIDSS; Lawrence et al. 2007) UDS field, which has extensive spectroscopic coverage from the UDSz program (Bradshaw et al. 2013; McLure et al. 2013; Maltby et al. 2016). The VVDS EAF focuses on the VVDS-02h field, which includes a total area of 0.61 deg2 from VVDS and 512 arcmin2 from the VVDS Ultra-Deep survey (Le Fèvre et al. 2005b; Le Fevre et al. 2013). The Great Observatories Origins Deep Survey North (GOODS-N; Dickinson et al. 2003) EAF is centred on the Hubble Deep Field which contains some of the deepest observations obtained by HST along with complementary observations from the ground and space. The All-Wavelength Extended Groth Strip International Survey (AEGIS; Davis et al. 2007) EAF is a multiwavelength survey field with low Galactic extinction and observations covering X-ray to radio wavelengths. AEGIS, CDFS, COSMOS, GOODS-N, and SXDS were all targeted as part of the Cosmic Assembly Near-infrared Deep Extragalactic Legacy Survey (CANDELS; Grogin et al. 2011, 0.2 deg2 in total) and have also been observed by the James Webb Space Telescope (JWST) through the CEERS (Bagley et al. 2023, 100 arcmin2), JADES (Eisenstein et al. 2023, 45 arcmin2), PRIMER (Dunlop et al. 2021, 378 arcmin2), NGDEEP (Bagley et al. 2024, 10 arcmin2), and COSMOS-Web (Casey et al. 2023, 0.54 deg2) surveys.
3. Image data
The core data set of the DAWN Survey is deep space-based near-IR imaging in the Euclid EDFs and EAFs coupled with deep wide-area Spitzer/IRAC data. Table 2 provides the median limiting magnitudes for each band and field and Fig. 3 compares the depths with model spectra of galaxies at a range of redshifts. Figures 4 and 5 show the footprints of the UV–NIR image data in the EDFs and EAFs, respectively. Figure 6 shows an example of the image data in EDF-N. The rest of this section summarises the UV–NIR imaging observations and archival data that comprise the DAWN survey data set.
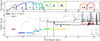 |
Fig. 3. Photometric depths and filters for the EDFs. Top panel: Throughput curves for the photometric bands in the DAWN survey. Bottom panel: photometric sensitivity limits for the EDFs at 5σ with HSC, MegaCam, IRAC, Euclid and Rubin (see Table 2 for details). The solid coloured lines show throughputs and depths for EDF-N and EDF-F data from MegaCam, HSC, and IRAC. The dotted lines show the same for EDF-S coverage from Rubin (expected) and IRAC. Euclid NISP depths are shown with solid lines for all three fields since they are identical. The grey scale lines show FSPS (Conroy et al. 2010; Conroy & Gunn 2010) model spectra for galaxies at a range of redshifts (see legend). The model spectra have been normalised to the characteristic stellar mass of galaxies (M*) at the respective redshift based on Weaver et al. (2023) and Stefanon et al. (2021) which have values of log M⋆ = 10.65, 10.24, 10.0, 9.5 for redshifts z = 4, 6, 8, 10, respectively. All models assume a Chabrier (2003) IMF, a delayed exponential star-formation history with τ = 2 Gyr, Solar metalicity, and Calzetti et al. (2000) dust with AV = 0.2. |
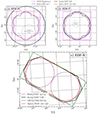 |
Fig. 4. Footprints of the DAWN survey image data in the EDFs. We note that the Rubin/LSST footprint in EDF-S shows the expected pointing pattern for the EDF-S Deep Drilling Field and may change once the survey begins (Ivezić et al. 2019). |
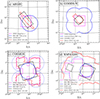 |
Fig. 5. Footprints of the DAWN survey image data in the EAFs. The coloured lines show the extent of the image data indicated in the legend. We note that the EAF footprints are approximations based on the Euclid survey plan. Updated footprints that reflect the actual Euclid coverage in the EAFs will be provided in subsequent DAWN data releases. |
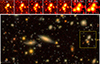 |
Fig. 6. Example of the image data quality from the DAWN MegaCam, HSC, and IRAC programs in EDF-N. The bottom panel shows a riz colour image (2′ × 1′), and the top row shows a zoom-in (20″ × 20″) of the highlighted region in each band of the DAWN data. |
3.1. Euclid space telescope observations
Euclid is a Korsch telescope comprising a 1.2 m mirror that provides an effective collecting area of 1 m2 (Racca et al. 2016) and two instruments. One instrument is the Euclid visible imager (VIS; Euclid Collaboration: Cropper et al. 2025), which has one broad visible band (IE) that covers 530–920 nm with a  pixel scale. The second instrument is the Near-Infrared Spectrometer and Photometer (NISP; Euclid Collaboration: Jahnke et al. 2025), which has three bands–YE, JE, and HE– that cover 949.6–1212.3 nm, 1167.6–1567.0 nm, and 1521.5–2021.4 nm (respectively; Euclid Collaboration: Schirmer et al. 2022) and a pixel scale of
  . The VIS and NISP instruments share a common field of view (FoV) of 0.53 deg2.
Euclid observations in the EDFs and EAFs are the primary motivation for the DAWN survey. The EDFs will each receive more than 40 visits with a final depth that is 2 mag deeper than the EWS. The EAFs will be covered by one to four Euclid pointings with varying depths listed in Table 2.
3.2. Spitzer/IRAC observations
The Spitzer Space Telescope (Werner et al. 2004) Infrared Array Camera (IRAC; Fazio et al. 2004) is an imaging camera with four channels centred at 3.6, 4.5, 5.8, and 8.0 μm (referred to as channels 1–4, respectively). Each channel has a  FoV and a pixel scale of
  .
.
The DAWN survey covers the EDFs with uniform Spitzer/IRAC imaging data at 3.6 and 4.5 μm from two dedicated programs: the Euclid/WFIRST Spitzer Legacy Survey (SLS; Capak et al. 2016) that covers EDF-N and EDF-F; and a separate program to observe EDF-S (Scarlata et al. 2019). The dedicated observations of the deep fields are supplemented by previous observations extracted from the archive. Observations of the EAFs are also compiled from the archive. All available data in the Euclid fields have been uniformly reduced and are described in detail in Euclid Collaboration: Moneti et al. (2022).
3.3. Hyper Suprime-Cam optical observations
The Hyper Suprime-Cam (HSC; Miyazaki et al. 2018) is a wide-field optical imaging camera at the prime focus of the 8.2 m Subaru Telescope on Maunakea, Hawaii. With a  diameter FoV and a
  pixel scale combined with the large collecting area of Subaru, HSC is an efficient instrument for deep surveys covering large areas of the sky.
3.3.1. H20
The Hawaii Twenty deg2 Survey (H20) is a dedicated observation program for the DAWN survey that covers two 10 deg2 fields in the EDF-N and EDF-F with the Subaru HSC griz bands. Observations of each field were obtained using a seven-point flower petal pattern with one central pointing surrounded by the remaining six pointings spread over a circle with a radius of 1.1 deg (see Fig. 4). The pointings are executed using a standard five-point dither pattern with a throw of 120″. The target exposure times are 1.1, 2.5, 4.1, and 4.8 hours per pointing for the griz bands, respectively. As these observations are still ongoing, we defer a full accounting of the total number of exposures to a future publication describing the final DAWN data release.
3.3.2. HSC-SSP
The Hyper Suprime-Cam Subaru Strategic Program (HSC-SSP; Aihara et al. 2018a) is a 330-night grizy band imaging survey of the extragalactic sky. HSC-SSP is a three tier ‘wedding cake’ survey composed of a 1400 deg2 wide layer, a 26 deg2 deep layer covering four fields, and a 3.5 deg2 ultra-deep layer covering COSMOS and SXDS. The extended COSMOS field and XMM-LSS, which encompasses SXDS and VVDS, were both observed as part of the deep survey. A single pointing centred on the AEGIS field was also observed to the depth of the wide survey for photo-z calibration. The HSC-SSP observing strategy is discussed in Aihara et al. (2018a) and details of the data reduction are described in Bosch et al. (2018) and Aihara et al. (2018b, 2019, 2022).
3.3.3. Archival Hyper Suprime-Cam data
Additional HSC observations were extracted from the archive, where available. The HEROES (Taylor et al. 2023a) and AKARI-NEP (Oi et al. 2021) programs both obtained grizy observations in EDF-N. Various PI-led programs at the University of Hawaii provide supplementary data for the COSMOS (see Hu et al. 2016; Tanaka et al. 2017, for details) and GOODS-N fields.
3.4. MegaCam ultraviolet observations
MegaCam (Boulade et al. 2003) is an optical wide-field imaging camera mounted at the prime focus of the 3.6 m Canada France Hawaii Telescope (CFHT) on Maunakea, Hawaii. MegaCam has a 1° ×1° FoV and a pixel scale of  . Over its lifetime, MegaCam has had two different u band filters: an original u* filter that was discontinued in 2015 due to a red leak around 5000 Å and a new bluer u filter that has been in use since then (Sawicki et al. 2019).
The H20 team conducted a dedicated MegaCam u band imaging survey in EDF-N and EDF-F. Observations were obtained in a 4 × 4 grid with a total area coverage of 13.7 deg2 in each field. In the EDF-N the ongoing 240-hour DEUS program (PIs: Arnouts and Sawicki) will reach a depth of u = 27 AB over ∼10 deg2 when completed. The DEUS data taken to date have been shared by the DEUS team and were used in the making of the u band mosaic for this field. The third EDF, EDF-S, has not been observed by MegaCam, as it is not accessible from Maunakea. Planned observations of EDF-S by the Rubin observatory are discussed in Sect. 3.6.
A variety of programs provide MegaCam observations of the EAFs. The CFHT Large Area U-band Deep Survey (CLAUDS; Sawicki et al. 2019) performed dedicated observations using the u band in the COSMOS EAF. CLAUDS and the MegaCam Ultra-deep Survey: u* band Imaging (MUSUBI; Wang et al. 2022) survey provide u* band in XMM-LSS and COSMOS. Observations of the AEGIS EAF were obtained through the CFHT Legacy Survey (CFHTLS; Gwyn 2012) in the u* band, with deep imaging in the CFHTLS-D3 field covering 1 deg2 and shallower data in the larger CFHTLS-W3 field covering 7 deg2. Archival u* band observations of GOODS-N (PI: L. Cowie) were extracted from the Canadian Astronomy Data Centre1 (CADC) and reduced in the same manner as the data obtained by the H20 team.
3.5. K band observations
Ground-based observations in the K band provide supplementary data to fill in the wavelength gap between the Euclid NISP and Spitzer/IRAC data. Various programs have obtained K band data in the DAWN fields, which we briefly summarise here and provide relevant citations where available. The UltraVISTA program (McCracken et al. 2012; Moneti et al. 2023) performed Ks band observations of the COSMOS field using VIRCAM on the 4 m VISTA telescope at the Cerro Paranal Observatory in Chile. Deep observations of 20 deg2 in EDF-S have been executed through the dedicated DAWN EDFS-Ks survey program (PI M. Nonino). The VIDEO (Jarvis et al. 2013) and VEILS (Hönig et al. 2017) surveys provide VIRCAM Ks data in XMM-LSS and CDFS. Additional K band observations from the UKIRT WFCAM also exist in SXDS from UKIDSS UDS (Lawrence et al. 2007).
3.6. Future Rubin observations
The Vera Rubin Observatory will perform repeated observations over 18 000 deg2 to identify optical transients, study dark energy and dark matter, map the Milky Way, and characterise the population of Solar System objects through the ten-year Legacy Survey of Space and Time (LSST) survey (Ivezić et al. 2019). In addition to the main LSST program, Rubin will also observe a set of deep drilling fields with more frequent visits that will ultimately have much deeper data in the ugrizy bands than the main survey. Although the specific fields for the deep drilling survey have not been finalised at this time, they will likely include EDF-S, CDFS, COSMOS, and XMM-LSS. When available, these data will also be incorporated into the DAWN survey data set.
4. Spectroscopic follow-up
Spectroscopic follow-up is essential for precise redshift measurements, confirming objects of interest, and photo-z calibration. Extensive spectroscopic surveys have already been conducted in the EAFs and will be summarised along with the DAWN catalogue release for those regions. This section provides a brief summary of ongoing spectroscopic follow-up in the EDFs.
4.1. Keck DEIMOS
The H20 team in Hawaii is conducting an ongoing spectroscopic survey of high-redshift galaxies in the EDF-N and EDF-F using the Deep Extragalactic Imaging Multi-Object Spectrograph (DEIMOS; Faber et al. 2003) on the 10 m Keck II telescope. The survey, so far, has focused on Lyman break galaxies (Steidel et al. 1996), also known as ‘dropout’ galaxies, selected using observed optical colours. Specifically, the program has focused on targeting Ly-α emission in overdensities of g band dropout galaxies at z ∼ 4. We refer to Murphree et al. (in prep.) for a full description of the colour selection criteria, overdensity calculations, and results.
High-z galaxies in protoclusters are scientifically interesting and convenient observationally because a large number of galaxies can be observed in a single mask. These observations increase the number of high-redshift spec-z measurements, which has an immediate impact on achieving the science goals of the DAWN survey and helps improve the redshift estimates derived from the photometry.
4.2. Hobby-Eberly Telescope VIRUS IFU
The Texas-Euclid Survey for Lyman-Alpha (TESLA; Chávez Ortiz et al. 2023) is a spectroscopic survey targeting a 10 deg2 region in the centre of EDF-N to generate a large sample (∼50 000) of Ly-α emitting galaxies (LAEs) at redshifts z = 2–3.5 in order to explore how the physical properties of LAEs correlate with emerging Ly-α emission. The combination of these spectra with the deep H20 imaging allows for redshift identification of TESLA-identified emission lines via spectral energy distribution (SED) fitting and subsequent analyses, including the study of the physical properties of identified LAEs. TESLA spectroscopic data is acquired by the Visible Integral-field Replicable Unit Spectrograph (VIRUS; Hill et al. 2018) instrument atop the Hobby-Eberly Telescope. The VIRUS instrument has a wavelength coverage of 3500–5500 Å with a resolving power of R ∼ 800 making the VIRUS instrument optimal for detecting Ly-α emission from galaxies at redshifts z = 1.9–3.5, as well as O II-emitting galaxies at z < 0.5.
5. Science goals
The deep NIR imaging from Euclid and the matched depth of UV-NIR data provided by the DAWN survey facilitate a wide range of scientific analyses. Though sharing similarities in wavelength coverage and depth with previous surveys such as CANDELS (Grogin et al. 2011) and COSMOS (Scoville 2007), DAWN stands out due to its significantly larger area coverage of thirty times that of the COSMOS field. The DAWN catalogues also stand out in comparison to the standard Euclid catalogues due to the inclusion of Spitzer/IRAC data, which are essential for stellar mass measurements of galaxies at z ≳ 2.5. This expanded scope opens up numerous new analytical possibilities. The primary scientific goals of the DAWN survey revolve around understanding galaxy formation and evolution, particularly in the high-redshift Universe. This section outlines the core objectives for the survey team, although the dataset will also support a multitude of other research endeavours.
5.1. Ultraviolet luminosity functions and mapping reionisation
The epoch of reionisation (EoR) marks the period of ‘cosmic dawn’ in which light from the first galaxies ionised the predominately neutral intergalactic medium (IGM), allowing this radiation to stream freely throughout the Universe. Although observations of the cosmic microwave background (CMB) (Planck Collaboration VI 2020), high-z quasars (Bouwens et al. 2015; Robertson et al. 2015), and Ly-α emitting galaxies (Treu et al. 2012; Castellano et al. 2016; Kakiichi et al. 2016) constrain the end of the EoR to z ≳ 6, many important questions remain, such as when the EoR began, the relative contribution of rarer luminous galaxies versus more numerous faint galaxies to the budget of ionising photons (e.g. Naidu et al. 2020; Hutter et al. 2021, 2023), and how reionization efficiency and the Ly-α escape fraction scale with the local density of galaxies.
One of the primary means of addressing these questions is through measurements of the rest-frame UV luminosity function (UVLF), which describes the comoving volume density of galaxies as a function of their UV luminosity. Integrating the UVLF not only yields an estimate of the ionising photon budget at a given redshift, it also provides constraints on the unobscured cosmic star-formation rate density (see Madau & Dickinson 2014, for a review). Although deep surveys from HST and JWST have been and will continue to be instrumental for measuring the faint end of the UVLF (e.g. Oesch et al. 2018; Bouwens et al. 2021; Casey et al. 2023), larger survey areas are needed to definitively constrain the abundance of rare luminous sources on the bright end (see Fig. 7). Thanks to the combination of depth and area, the DAWN survey will robustly constrain the bright end of the UVLF to absolute magnitudes of MUV ∼ −24 at z = 8–10, with sufficient depth to overlap at fainter magnitudes studied by HST (e.g. Bouwens et al. 2021) and JWST surveys (e.g. Casey et al. 2023; Donnan et al. 2023).
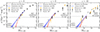 |
Fig. 7. Measurements of the UV luminosity function ϕ at z = 8–10 from the literature (Oesch et al. 2018; Bowler et al. 2020; Bouwens et al. 2021; Finkelstein & Bagley 2022; Adams et al. 2024; Donnan et al. 2023). The red and blue lines show extrapolations to the volume of the DAWN survey based on the best-fitting Schechter and double power-law (DPL) functions, with the shaded regions showing associated Poisson uncertainties for the DAWN survey volume. Upper limits based on survey volume are indicated with the horizontal lines. The DAWN volume in each panel assumes an area of 59 deg2, a redshift slice of ±0.5 from the redshift bin centre, and a Planck Collaboration VI (2020)ΛCDM cosmology. |
Theoretical models predict that the most massive galaxies trace the LSS at high redshifts, with lower mass galaxies clustered around them (e.g. Mo & White 1996; Vogelsberger et al. 2014). They also predict that reionisation proceeds more efficiently in these over-dense regions (e.g. Treu et al. 2012; Kakiichi et al. 2016; Castellano et al. 2016). However, the details are still poorly understood (Mason & Gronke 2020; Naidu et al. 2020; Larson et al. 2022; Finkelstein & Bagley 2022). For example, what the observational evidence is for the association between massive galaxies and the LSS at high-redshifts is uncertain (Hatfield et al. 2018; Harikane et al. 2022).
Structures extending over  at z > 3 are rare, and the existing pre-EDFs do not cover a sufficient contiguous area to capture them. Thus, a survey such as DAWN is essential to probe the full range of reionisation conditions in diverse environments, probing the same variety of structures in the real Universe as those found in cosmological simulations. According to the Millennium simulation (Springel et al. 2005), the DAWN survey will find ∼125–250 proto-structures, that is, progenitors of modern day > 5 × 10¹⁴ M⊙ clusters, and ∼1250–2500 regions with densities more than three times the mean density of the Universe at 3 < z < 8. For example, the comoving volume of the DAWN survey at 6.5 < z < 7.5 will contain more than 100 dark matter halos with masses (M200) greater than 1012 M⊙, with only 5 ± 2 such massive halos expected in a survey such as COSMOS (Despali et al. 2016). Figure 8 shows reionisation bubbles around luminous galaxies at z ∼ 7 from the ASTREUS simulation framework (Hutter et al. 2023) in a similar area as the COSMOS field.
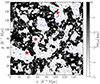 |
Fig. 8. Large-scale spatial distribution of the neutral hydrogen fraction at z ≃ 7 (neutral = black, white and grey = ionised) of the MHDEC (i.e. fesc decreases with halo mass, Mh) simulation presented in Hutter et al. (2023). The neutral hydrogen fraction shown here is averaged over three cells along the line of sight, where each cell has a comoving depth of 312.5 h−1 kpc and the dimensionless Hubble constant h = 0.6777. The width and height of the box are given in comoving units and correspond to 1° at z = 7. Blue circles depict galaxies with UV luminosities of at least MUV ≥ −18 and red stars the brightest galaxies in the simulation box with MUV ≥ −21. |
5.2. Galaxy stellar mass function
Among the most outstanding problems in astronomy today is understanding the nature and formation mechanism of the most massive galaxies (M⋆ ≳ 3 × 10¹⁰ M⊙) in the early Universe (z ≳ 2). These rare systems are the best candidate progenitors of local early-type galaxies with M⋆ ∼ 1012 M⊙. Some have been shown to be surprisingly mature, having no ongoing star formation and well-formed discs in contrast with the hierarchical formation scenario (e.g. Toft et al. 2017). In a hierarchical model, the mapping between the galaxies and host dark matter halos is controlled by the stellar mass–halo mass relation. Different mappings generate different merger histories as well as different star-formation histories (e.g. Grylls et al. 2019; Fu et al. 2022). The shape of the high-z galaxy stellar mass function (SMF) is particularly valuable in this respect as it provides a benchmark for the evolution of galaxies at lower redshifts. For example, it has been shown that an abundance of massive galaxies at high redshift is more consistent with the nearly flat star-formation histories retrieved from galaxies at lower redshifts, which suggest that galaxies gained much of their stellar mass at early epochs (Fu et al. 2022).
Understanding the evolution of these systems involves investigating the number density of different galaxy populations at z = 3–8, the processes governing the build-up of mass in massive galaxies, the mechanisms driving the quenching of star formation, and the role of environmental in determiing a galaxy’s stellar mass. Pursuing these questions with existing resources has already yielded surprises. While detailed follow-up of individual objects has clarified their unusual properties (e.g. Toft et al. 2017), statistical arguments as to their demographics – namely the galaxy SMF – have provided meaningful clues (Cole et al. 2001; Adams et al. 2021; McLeod et al. 2021; Stefanon et al. 2021; Weaver et al. 2022). The shape and evolution with time of the SMF is sensitive not only to star-formation histories and galaxy mergers but also to the associated physical processes thought responsible for ceasing galaxy growth such as heating of gas by accreting central supermassive black holes or by supernovae explosions, gas removal by outflows, or a host of other proposed scenarios (Dubois et al. 2013; Gabor & Davé 2015).
Massive galaxies are some of the best laboratories for testing galaxy formation theories. However, a comprehensive view of massive galaxy evolution cannot come from shallow large-area surveys such as SDSS or GAMA, which are restricted to z < 0.5, nor from deep but narrow surveys such as HUDF or CANDELS, which reach z ∼ 9–10 but only cover a total area of < 0.25 deg2 (see Finkelstein 2016, for a review). Only a handful of high-z detections have ∼5 × 10¹⁰ M⊙ in the small cosmic volume probed by HST, with no M⋆ > 1011 M⊙ candidates found at z > 5. Even the largest contiguous HST galaxy survey, COSMOS, has not detected massive galaxy candidates beyond z ∼ 5 (Weaver et al. 2023).
The DAWN survey will measure the shape and evolution of the SMF to z ∼ 8 with directly measured stellar masses from Spitzer/IRAC. Thanks to its large area coverage, the DAWN survey will reduce Poisson uncertainties by a factor of approximately six compared to the Weaver et al. (2023) SMF from COSMOS and will provide the first robust constraints on the number density of ultra-massive galaxies (M⋆ > 1011 M⊙) at z = 6–8 (see Fig. 9).
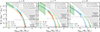 |
Fig. 9. Stellar mass function, Φ, measurements (hatched regions) from HST (S+21; Stefanon et al. 2021), the COSMOS field (W+22; Weaver et al. 2023), and JWST (N-C+23; Navarro-Carrera et al. 2024) in three redshift bins: z ∼ 6 (left), 7 (middle), and 8 (right). The dashed lines show extrapolations to higher masses for the DAWN survey volume (calculated in the same way as in Fig. 7) assuming the corresponding literature Schechter function fits, and the accompanying shaded regions show estimated uncertainties. Upper limits for empty bins for the respective survey are indicated with horizontal lines. We note that due to the shallower IRAC data in EDF-S (see Table 2), the z ∼ 8 bin assumes a smaller effective area of 39 deg2. The grey shaded regions indicate the theoretical upper limit of the SMF in each redshift bin based on the Despali et al. (2016) halo mass function when assuming a fixed baryon fraction of 0.018 as in Weaver et al. (2023). |
The large area of the DAWN survey will also improve measurements of the SMF for quiescent and star-forming galaxies as well as galaxies in different environments. Colour–colour selection criteria are often used to separate star-forming and quiescent galaxies (Williams et al. 2009; Arnouts et al. 2013; Ilbert et al. 2010; Davidzon et al. 2017; Gould et al. 2023). Weaver et al. (2023) only find 52 quiescent galaxies at z = 4.5–6.5 in 1.3 deg2 of the COSMOS field, which limited their analysis of the quiescent SMF to z < 4.5. Assuming a similar source density, the DAWN survey will detect ∼2000 quiescent galaxies at z = 4.5–6.5, providing new constraints on the quiescent SMF in the early Universe. So far, measurements of the SMF as a function of environment have been limited to redshifts z < 3 (Baldry et al. 2006; Peng et al. 2010; Papovich et al. 2018; Taylor et al. 2023b). The DAWN survey will not only expand this type of analysis to higher redshifts but will also be able to explore more extreme under- or over-dense environments thanks to the large contiguous areas of the EDFs.
5.3. Origins of large-scale structure at high-redshift
The current standard model for cosmology, Lambda cold dark matter (ΛCDM), describes the growth of structure from density fluctuations in the primordial plasma to the LSS that we observe today. The ΛCDM model has been successful in describing the power spectra of galaxies and the CMB, but recent work has found tensions (Abdalla et al. 2022) in two of its key parameters: H0, the Hubble rate at present day (e.g. Planck Collaboration VI 2020; Riess et al. 2022), and σ8, the amplitude of matter density fluctuations at present day (e.g. Planck Collaboration VI 2020; Asgari et al. 2021; Heymans et al. 2021; Abbott et al. 2022; Amon et al. 2022). Both tensions arise between early (CMB-based) and late (galaxy-based) methods. While H0 has been measured across a wide range of redshifts, σ8 remains unconstrained at z ∼ 3–7.
The DAWN dataset will allow us to measure galaxy clustering at these high redshifts. As galaxies are a biased tracer of the underlying matter distribution, we will assume a linear galaxy bias bgal. This galaxy bias is similarly unconstrained at z ∼ 3–7 and is degenerate with σ8 in two-point clustering measurements. At high redshift, we can break this degeneracy by cross-correlating galaxy clustering measurements with CMB lensing or by combining galaxy bias measurements with higher-order statistics (e.g. Repp & Szapudi 2022). Using HSC data from SSP and the University of Hawaii (SSP+UH; Tanaka et al. 2017) in the ∼2 deg2 COSMOS field, Beck et al. (2020) measured linear galaxy bias out to z ∼ 6 for g, r, and i band dropouts. We will extend this analysis to the full 59 deg2 of the DAWN survey and use its robust photometric redshifts to select our galaxy samples, which should reduce the uncertainties by more than a factor of three. By cross-correlating our galaxy clustering measurements with CMB lensing (e.g. Planck Collaboration VI 2020), we can constrain σ8 at high-redshift and compare our result with constraints from previous work (Murphree et al., in prep.).
The total volume of the DAWN survey out to z ∼ 7 will be about 3.8 Gpc3. This volume is large enough to include several extreme density fluctuations. By applying advanced statistical techniques such as sufficient statistics and indicator functions, we can double this volume and make robust estimates of cosmological parameters (Wolk et al. 2015; Repp & Szapudi 2022). The DAWN data set will allow us to constrain parameters (see Fig. 10) well beyond the z ∼ 2.5 forecasted for the photometric Euclid data set (Euclid Collaboration: Ilić et al. 2022).
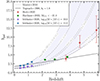 |
Fig. 10. Redshift evolution of linear galaxy bias. The early prediction from Tegmark & Peebles (1998) is shown in solid grey, and more recent models separated by stellar mass from Moster et al. (2010) are shown as dashed grey curves. High-z measurements for dropout-selected samples from Beck et al. (2020) and Harikane et al. (2022) are shown in red and green, respectively. Low-z measurements for two stellar masses from Ishikawa et al. (2020) are shown in blue and purple. The DAWN survey will allow us to constrain bias as a function of redshift and stellar mass in the shaded region. |
6. Summary
The DAWN survey is a deep multiwavelength imaging survey that covers ∼59 deg2 in the EEDFs and EAFs. Deep space-based NIR image data from Euclid NISP and Spitzer/IRAC form the core of the DAWN data set along with complementary ground-based UV–optical data from CFHT/MegaCam, Subaru/HSC, and future observations from the Vera Rubin Observatory. The DAWN survey aims to provide catalogues for the widest area collection of extragalactic deep fields with consistently measured photometry. These data will be essential for photometric redshift calibration of the EWS and will be the reference data set for extragalactic studies in the EDFs and EAFs.
The DAWN survey is designed to address a variety of science goals including measuring the galaxy SMF to z = 8, mapping reionisation, studying the formation of LSS, and characterising the first quenched galaxies. Data collection for the survey is ongoing with the ground-based component planned to be completed in the next few years and the Euclid observations scheduled to be completed by 2030. A companion paper, Euclid Collaboration: Zalesky et al. (2025), will provide the first DAWN data release of photometric catalogues and galaxy physical parameters in EDF-N and EDF-F. Future publications will present subsequent data releases of image data and catalogues that include all DAWN fields. The DAWN data have immediate value for studying galaxy formation and evolution in the high-redshift Universe and that legacy value will only increase as the survey is completed.
Acknowledgments
We thank the anonymous reviewer for helpful suggestions, which greatly improved the manuscript. We also thank the Euclid Collaboration editorial board for their help in formatting the manuscript and internal reviewers Rebecca Bowler and Roser Pello for their feedback on the text. The Cosmic Dawn Center is funded by the Danish National Research Foundation under grant DNRF140. C.J.R.M., L.Z., D.B.S., I.S., I.V., and G.M. acknowledge support from NASA-JPL RSA award Nos. 1704873 and 1689844, NASA ADAP grant No. 80NSSC19K1022, and from the National Science Foundation under Grant Nos. 2206844 and 2319554. B.M. and S.T. acknowledge support from the National Science Foundation under Grant No. 2206813. The Euclid Consortium acknowledges the European Space Agency and a number of agencies and institutes that have supported the development of Euclid, in particular the Agenzia Spaziale Italiana, the Austrian Forschungsförderungsgesellschaft funded through BMK, the Belgian Science Policy, the Canadian Euclid Consortium, the Deutsches Zentrum für Luft- und Raumfahrt, the DTU Space and the Niels Bohr Institute in Denmark, the French Centre National d’Etudes Spatiales, the Fundação para a Ciência e a Tecnologia, the Hungarian Academy of Sciences, the Ministerio de Ciencia, Innovación y Universidades, the National Aeronautics and Space Administration, the National Astronomical Observatory of Japan, the Netherlandse Onderzoekschool Voor Astronomie, the Norwegian Space Agency, the Research Council of Finland, the Romanian Space Agency, the State Secretariat for Education, Research, and Innovation (SERI) at the Swiss Space Office (SSO), and the United Kingdom Space Agency. A complete and detailed list is available on the Euclid web site (https://www.euclid-ec.org).
References
- Abbott, T., Aguena, M., Alarcon, A., et al. 2022, Phys. Rev. D, 105 [Google Scholar]
- Abdalla, E., Abellán, G. F., Aboubrahim, A., et al. 2022, Journal of High Energy Astrophysics, 34, 49 [Google Scholar]
- Adams, N. J., Bowler, R. A. A., Jarvis, M. J., Häußler, B., & Lagos, C. D. P. 2021, MNRAS, 506, 4933 [CrossRef] [Google Scholar]
- Adams, N. J., Conselice, C. J., Austin, D., et al. 2024, ApJ, 965, 169 [NASA ADS] [CrossRef] [Google Scholar]
- Aihara, H., Arimoto, N., Armstrong, R., et al. 2018a, PASJ, 70, S4 [NASA ADS] [Google Scholar]
- Aihara, H., Armstrong, R., Bickerton, S., et al. 2018b, PASJ, 70, S8 [NASA ADS] [Google Scholar]
- Aihara, H., AlSayyad, Y., Ando, M., et al. 2019, PASJ, 71, 114 [Google Scholar]
- Aihara, H., AlSayyad, Y., Ando, M., et al. 2022, PASJ, 74, 247 [NASA ADS] [CrossRef] [Google Scholar]
- Amon, A., Gruen, D., Troxel, M. A., et al. 2022, Phys. Rev. D, 105, 023514 [NASA ADS] [CrossRef] [Google Scholar]
- Arnouts, S., Le Floc’h, E., Chevallard, J., et al. 2013, A&A, 558, A67 [NASA ADS] [CrossRef] [EDP Sciences] [Google Scholar]
- Asgari, M., Lin, C.-A., Joachimi, B., et al. 2021, A&A, 645, A104 [NASA ADS] [CrossRef] [EDP Sciences] [Google Scholar]
- Bagley, M. B., Finkelstein, S. L., Koekemoer, A. M., et al. 2023, ApJ, 946, L12 [NASA ADS] [CrossRef] [Google Scholar]
- Bagley, M. B., Pirzkal, N., Finkelstein, S. L., et al. 2024, ApJ, 965, L6 [NASA ADS] [CrossRef] [Google Scholar]
- Baldry, I. K., Balogh, M. L., Bower, R. G., et al. 2006, MNRAS, 373, 469 [Google Scholar]
- Beck, R., McPartland, C., Repp, A., Sanders, D., & Szapudi, I. 2020, MNRAS, 493, 2318 [NASA ADS] [CrossRef] [Google Scholar]
- Bosch, J., Armstrong, R., Bickerton, S., et al. 2018, PASJ, 70, S5 [Google Scholar]
- Boulade, O., Charlot, X., Abbon, P., et al. 2003, in Instrument Design and Performance for Optical/Infrared Ground-based Telescopes, eds. M. Iye, & A. F. M. Moorwood, SPIE Conf. Ser., 4841, 72 [NASA ADS] [CrossRef] [Google Scholar]
- Bouwens, R. J., Illingworth, G. D., Oesch, P. A., et al. 2015, ApJ, 811, 140 [NASA ADS] [CrossRef] [Google Scholar]
- Bouwens, R. J., Oesch, P. A., Stefanon, M., et al. 2021, AJ, 162, 47 [NASA ADS] [CrossRef] [Google Scholar]
- Bowler, R. A. A., Jarvis, M. J., Dunlop, J. S., et al. 2020, MNRAS, 493, 2059 [Google Scholar]
- Bradshaw, E. J., Almaini, O., Hartley, W. G., et al. 2013, MNRAS, 433, 194 [NASA ADS] [CrossRef] [Google Scholar]
- Calzetti, D., Armus, L., Bohlin, R. C., et al. 2000, ApJ, 533, 682 [NASA ADS] [CrossRef] [Google Scholar]
- Capak, P., Arendt, R., Arnouts, S., et al. 2016, TheEuclid/WFIRST Spitzer Legacy Survey, Spitzer Proposal ID #13058 [Google Scholar]
- Casey, C. M., Kartaltepe, J. S., Drakos, N. E., et al. 2023, ApJ, 954, 31 [NASA ADS] [CrossRef] [Google Scholar]
- Castellano, M., Dayal, P., Pentericci, L., et al. 2016, ApJ, 818, L3 [NASA ADS] [CrossRef] [Google Scholar]
- Chabrier, G. 2003, PASP, 115, 763 [Google Scholar]
- Chávez Ortiz, Ó. A., Finkelstein, S. L., Davis, D., et al. 2023, ApJ, 952, 110 [NASA ADS] [CrossRef] [Google Scholar]
- Clerc, N., Adami, C., Lieu, M., et al. 2014, MNRAS, 444, 2723 [NASA ADS] [CrossRef] [Google Scholar]
- Cole, S., Norberg, P., Baugh, C. M., et al. 2001, MNRAS, 326, 255 [NASA ADS] [CrossRef] [Google Scholar]
- Conroy, C., & Gunn, J. E. 2010, ApJ, 712, 833 [Google Scholar]
- Conroy, C., White, M., & Gunn, J. E. 2010, ApJ, 708, 58 [NASA ADS] [CrossRef] [Google Scholar]
- Davidzon, I., Ilbert, O., Laigle, C., et al. 2017, A&A, 605, A70 [NASA ADS] [CrossRef] [EDP Sciences] [Google Scholar]
- Davis, M., Guhathakurta, P., Konidaris, N. P., et al. 2007, ApJ, 660, L1 [NASA ADS] [CrossRef] [Google Scholar]
- Despali, G., Giocoli, C., Angulo, R. E., et al. 2016, MNRAS, 456, 2486 [NASA ADS] [CrossRef] [Google Scholar]
- Dickinson, M., Giavalisco, M., & GOODS Team 2003, in The Mass of Galaxies at Low and High Redshift, eds. R. Bender, & A. Renzini, 324 [Google Scholar]
- Donnan, C. T., McLeod, D. J., Dunlop, J. S., et al. 2023, MNRAS, 518, 6011 [Google Scholar]
- Dubois, Y., Pichon, C., Devriendt, J., et al. 2013, MNRAS, 428, 2885 [NASA ADS] [CrossRef] [Google Scholar]
- Dunlop, J. S., Abraham, R. G., Ashby, M. L. N., et al. 2021, PRIMER: Public Release IMaging for Extragalactic Research, JWST Proposal. Cycle 1, ID. 1837 [Google Scholar]
- Eisenstein, D. J., Willott, C., Alberts, S., et al. 2023, ApJS, submitted [arXiv:2306.02465] [Google Scholar]
- Euclid Collaboration (Moneti, A., et al.) 2022, A&A, 658, A126 [NASA ADS] [CrossRef] [EDP Sciences] [Google Scholar]
- Euclid Collaboration (Scaramella, R., et al.) 2022, A&A, 662, A112 [NASA ADS] [CrossRef] [EDP Sciences] [Google Scholar]
- Euclid Collaboration (Schirmer, M., et al.) 2022, A&A, 662, A92 [NASA ADS] [CrossRef] [EDP Sciences] [Google Scholar]
- Euclid Collaboration (Ilić, S., et al.) 2022, A&A, 657, A91 [CrossRef] [EDP Sciences] [Google Scholar]
- Euclid Collaboration (Cropper, M., et al.) 2025, A&A, in press https://doi.org/10.1051/0004-6361/202450996 [Google Scholar]
- Euclid Collaboration (Jahnke, K., et al.) 2025, A&A, in press https://doi.org/10.1051/0004-6361/202450786 [Google Scholar]
- Euclid Collaboration (Mellier, Y., et al.) 2025, A&A, in press https://doi.org/10.1051/0004-6361/202450810 [Google Scholar]
- Euclid Collaboration (Zalesky, L., et al.) 2025, A&A, 695, A229 [Google Scholar]
- Faber, S. M., Phillips, A. C., Kibrick, R. I., et al. 2003, in Instrument Design and Performance for Optical/Infrared Ground-based Telescopes, eds. M. Iye, & A. F. M. Moorwood, SPIE Conf. Ser., 4841, 1657 [Google Scholar]
- Fazio, G. G., Hora, J. L., Allen, L. E., et al. 2004, ApJS, 154, 10 [Google Scholar]
- Finkelstein, S. L. 2016, PASA, 33 [CrossRef] [Google Scholar]
- Finkelstein, S. L., & Bagley, M. B. 2022, ApJ, 938, 25 [NASA ADS] [CrossRef] [Google Scholar]
- Foley, R. J., Koekemoer, A. M., Spergel, D. N., et al. 2018, ArXiv e-prints [arXiv:1812.00514] [Google Scholar]
- Fu, H., Shankar, F., Ayromlou, M., et al. 2022, MNRAS, 516, 3206 [NASA ADS] [CrossRef] [Google Scholar]
- Gabor, J. M., & Davé, R. 2015, MNRAS, 447, 374 [NASA ADS] [CrossRef] [Google Scholar]
- Giacconi, R., Zirm, A., Wang, J., et al. 2002, ApJS, 139, 369 [Google Scholar]
- Gould, K. M. L., Brammer, G., Valentino, F., et al. 2023, AJ, 165, 248 [NASA ADS] [CrossRef] [Google Scholar]
- Green, G. 2018, The Journal of Open Source Software, 3, 695 [Google Scholar]
- Grogin, N. A., Kocevski, D. D., Faber, S. M., et al. 2011, ApJS, 197, 35 [NASA ADS] [CrossRef] [Google Scholar]
- Grylls, P. J., Shankar, F., Zanisi, L., & Bernardi, M. 2019, MNRAS, 483, 2506 [NASA ADS] [CrossRef] [Google Scholar]
- Gwyn, S. D. J. 2012, AJ, 143, 38 [Google Scholar]
- Harikane, Y., Ono, Y., Ouchi, M., et al. 2022, ApJS, 259, 20 [NASA ADS] [CrossRef] [Google Scholar]
- Hatfield, P. W., Bowler, R. A. A., Jarvis, M. J., & Hale, C. L. 2018, MNRAS, 477, 3760 [NASA ADS] [CrossRef] [Google Scholar]
- Heymans, C., Tröster, T., Asgari, M., et al. 2021, A&A, 646, A140 [NASA ADS] [CrossRef] [EDP Sciences] [Google Scholar]
- Hill, G. J., Kelz, A., Lee, H., et al. 2018, in Ground-based and Airborne Instrumentation for Astronomy VII, eds. C. J. Evans, L. Simard, & H. Takami, SPIE Conf. Ser., 10702, 107021K [Google Scholar]
- Hönig, S. F., Watson, D., Kishimoto, M., et al. 2017, MNRAS, 464, 1693 [CrossRef] [Google Scholar]
- Hu, E. M., Cowie, L. L., Songaila, A., et al. 2016, ApJ, 825, L7 [Google Scholar]
- Hutter, A., Dayal, P., Legrand, L., Gottlöber, S., & Yepes, G. 2021, MNRAS, 506, 215 [Google Scholar]
- Hutter, A., Trebitsch, M., Dayal, P., et al. 2023, MNRAS, 524, 6124 [NASA ADS] [CrossRef] [Google Scholar]
- Ilbert, O., Salvato, M., Le Floc’h, E., et al. 2010, ApJ, 709, 644 [Google Scholar]
- Ishikawa, S., Kashikawa, N., Tanaka, M., et al. 2020, ApJ, 904, 128 [NASA ADS] [CrossRef] [Google Scholar]
- Ivezić, Ž., Kahn, S. M., Tyson, J. A., et al. 2019, ApJ, 873, 111 [Google Scholar]
- Jarvis, M. J., Bonfield, D. G., Bruce, V. A., et al. 2013, MNRAS, 428, 1281 [Google Scholar]
- Kakiichi, K., Dijkstra, M., Ciardi, B., & Graziani, L. 2016, MNRAS, 463, 4019 [NASA ADS] [CrossRef] [Google Scholar]
- Koekemoer, A. M., Faber, S. M., Ferguson, H. C., et al. 2011, ApJS, 197, 36 [NASA ADS] [CrossRef] [Google Scholar]
- Larson, R. L., Finkelstein, S. L., Hutchison, T. A., et al. 2022, ApJ, 930, 104 [NASA ADS] [CrossRef] [Google Scholar]
- Laureijs, R., Amiaux, J., Arduini, S., et al. 2011, ArXiv e-prints [arXiv:1110.3193] [Google Scholar]
- Lawrence, A., Warren, S. J., Almaini, O., et al. 2007, MNRAS, 379, 1599 [Google Scholar]
- Le Fèvre, O., Guzzo, L., Meneux, B., et al. 2005a, A&A, 439, 877 [Google Scholar]
- Le Fèvre, O., Vettolani, G., Garilli, B., et al. 2005b, A&A, 439, 845 [Google Scholar]
- Le Fevre, O., Cassata, P., Cucciati, O., et al. 2013, A&A, 559, A14 [CrossRef] [EDP Sciences] [Google Scholar]
- Luo, B., Bauer, F. E., Brandt, W. N., et al. 2008, ApJS, 179, 19 [NASA ADS] [CrossRef] [Google Scholar]
- Madau, P., & Dickinson, M. 2014, ARA&A, 52, 415 [Google Scholar]
- Maltby, D. T., Almaini, O., Wild, V., et al. 2016, MNRAS, 459, L114 [NASA ADS] [CrossRef] [Google Scholar]
- Mason, C. A., & Gronke, M. 2020, MNRAS, 499, 1395 [Google Scholar]
- McCracken, H. J., Milvang-Jensen, B., Dunlop, J., et al. 2012, A&A, 544, A156 [NASA ADS] [CrossRef] [EDP Sciences] [Google Scholar]
- McLeod, D. J., McLure, R. J., Dunlop, J. S., et al. 2021, MNRAS, 503, 4413 [NASA ADS] [CrossRef] [Google Scholar]
- McLure, R. J., Pearce, H. J., Dunlop, J. S., et al. 2013, MNRAS, 428, 1088 [NASA ADS] [CrossRef] [Google Scholar]
- Miyazaki, S., Komiyama, Y., Kawanomoto, S., et al. 2018, PASJ, 70, S1 [NASA ADS] [Google Scholar]
- Mo, H. J., & White, S. D. M. 1996, MNRAS, 282, 347 [Google Scholar]
- Moneti, A., McCracken, H. J., Hudelot, W., et al. 2023, VizieR Online Data Catalog: II/373 [Google Scholar]
- Moster, B. P., Somerville, R. S., Maulbetsch, C., et al. 2010, ApJ, 710, 903 [Google Scholar]
- Naidu, R. P., Tacchella, S., Mason, C. A., et al. 2020, ApJ, 892, 109 [NASA ADS] [CrossRef] [Google Scholar]
- Navarro-Carrera, R., Rinaldi, P., Caputi, K. I., et al. 2024, ApJ, 961, 207 [CrossRef] [Google Scholar]
- Oesch, P. A., Bouwens, R. J., Illingworth, G. D., Labbé, I., & Stefanon, M. 2018, ApJ, 855, 105 [Google Scholar]
- Oi, N., Goto, T., Matsuhara, H., et al. 2021, MNRAS, 500, 5024 [Google Scholar]
- Papovich, C., Kawinwanichakij, L., Quadri, R. F., et al. 2018, ApJ, 854, 30 [NASA ADS] [CrossRef] [Google Scholar]
- Peng, Y.-J., Lilly, S. J., Kovač, K., et al. 2010, ApJ, 721, 193 [Google Scholar]
- Planck Collaboration XLVII 2016, A&A, 596, A109 [NASA ADS] [CrossRef] [EDP Sciences] [Google Scholar]
- Planck Collaboration VI 2020, A&A, 641, A6 [NASA ADS] [CrossRef] [EDP Sciences] [Google Scholar]
- Racca, G. D., Laureijs, R., Stagnaro, L., et al. 2016, in Space Telescopes and Instrumentation 2016: Optical, Infrared, and Millimeter Wave, eds. H. A. MacEwen, G. G. Fazio, & M. Lystrup, 9904, 99040O [NASA ADS] [Google Scholar]
- Rácz, G., Szapudi, I., Csabai, I., & Dobos, L. 2021, MNRAS, 503, 5638 [CrossRef] [Google Scholar]
- Repp, A., & Szapudi, I. 2022, MNRAS, 509, 586 [Google Scholar]
- Riess, A. G., Yuan, W., Macri, L. M., et al. 2022, ApJ, 934, L7 [NASA ADS] [CrossRef] [Google Scholar]
- Robertson, B. E., Ellis, R. S., Furlanetto, S. R., & Dunlop, J. S. 2015, ApJ, 802, L19 [Google Scholar]
- Sawicki, M., Arnouts, S., Huang, J., et al. 2019, MNRAS, 489, 5202 [NASA ADS] [Google Scholar]
- Scarlata, C., Capak, P., Finkelstein, S., et al. 2019, The Euclid Deep Field South, Spitzer Proposal ID #14235 [Google Scholar]
- Scoville, N. 2007, in From Z-Machines to ALMA: (Sub)Millimeter Spectroscopy of Galaxies, eds. A. J. Baker, J. Glenn, A. I. Harris, J. G. Mangum, & M. S. Yun, ASP Conf. Ser., 375, 166 [Google Scholar]
- Sekiguchi, K., Akiyama, M., Furusawa, H., et al. 2004, in Astrophysics and Space Science Library, ed. M. Plionis, 301, 169 [NASA ADS] [Google Scholar]
- Springel, V., White, S. D. M., Jenkins, A., et al. 2005, Nature, 435, 629 [Google Scholar]
- Stefanon, M., Bouwens, R. J., Labbé, I., et al. 2021, ApJ, 922, 29 [NASA ADS] [CrossRef] [Google Scholar]
- Steidel, C. C., Giavalisco, M., Pettini, M., Dickinson, M., & Adelberger, K. L. 1996, ApJ, 462, L17 [Google Scholar]
- Tanaka, M., Hasinger, G., Silverman, J. D., et al. 2017, ArXiv e-prints [arXiv:1706.00566] [Google Scholar]
- Taylor, A. J., Barger, A. J., Cowie, L. L., et al. 2023a, ApJS, 266, 24 [Google Scholar]
- Taylor, E., Almaini, O., Merrifield, M., et al. 2023b, MNRAS, 522, 2297 [NASA ADS] [CrossRef] [Google Scholar]
- Tegmark, M., & Peebles, P. J. E. 1998, ApJ, 500, L79 [Google Scholar]
- Toft, S., Zabl, J., Richard, J., et al. 2017, Nature, 546, 510 [NASA ADS] [CrossRef] [Google Scholar]
- Treu, T., Trenti, M., Stiavelli, M., Auger, M. W., & Bradley, L. D. 2012, ApJ, 747, 27 [NASA ADS] [CrossRef] [Google Scholar]
- Vogelsberger, M., Genel, S., Springel, V., et al. 2014, MNRAS, 444, 1518 [Google Scholar]
- Wang, W.-H., Foucaud, S., Hsieh, B.-C., et al. 2022, ApJS, 260, 54 [Google Scholar]
- Weaver, J. R., Kauffmann, O. B., Ilbert, O., et al. 2022, ApJS, 258, 11 [NASA ADS] [CrossRef] [Google Scholar]
- Weaver, J. R., Davidzon, I., Toft, S., et al. 2023, A&A, 677, A184 [NASA ADS] [CrossRef] [EDP Sciences] [Google Scholar]
- Werner, M. W., Roellig, T. L., Low, F. J., et al. 2004, ApJS, 154, 1 [NASA ADS] [CrossRef] [Google Scholar]
- Williams, R. J., Quadri, R. F., Franx, M., van Dokkum, P., & Labbé, I. 2009, ApJ, 691, 1879 [NASA ADS] [CrossRef] [Google Scholar]
- Wolk, M., Carron, J., & Szapudi, I. 2015, MNRAS, 451, 1682 [NASA ADS] [CrossRef] [Google Scholar]
- Xue, Y. Q., Luo, B., Brandt, W. N., et al. 2011, ApJS, 195, 10 [Google Scholar]
All Tables
Centre coordinates (J2000), area coverage, and foreground dust reddening E(B − V) of the EDFs and EAFs.
All Figures
|
Fig. 1. Illustration of the dark matter overdensity, |
| In the text | |
|
Fig. 2. Mollweide projection of the Galactic foreground reddening – E(B − V) – on the celestial sphere from the Planck Collaboration XLVII (2016) generated using the dustmaps Python package (Green 2018). The coordinates of each of the EAFs are indicated with black squares, and the EDFs are highlighted with red stars. The solid blue line shows the ecliptic. The dotted blue lines indicate the continuous viewing zone for the Euclid mission at |
| In the text | |
|
Fig. 3. Photometric depths and filters for the EDFs. Top panel: Throughput curves for the photometric bands in the DAWN survey. Bottom panel: photometric sensitivity limits for the EDFs at 5σ with HSC, MegaCam, IRAC, Euclid and Rubin (see Table 2 for details). The solid coloured lines show throughputs and depths for EDF-N and EDF-F data from MegaCam, HSC, and IRAC. The dotted lines show the same for EDF-S coverage from Rubin (expected) and IRAC. Euclid NISP depths are shown with solid lines for all three fields since they are identical. The grey scale lines show FSPS (Conroy et al. 2010; Conroy & Gunn 2010) model spectra for galaxies at a range of redshifts (see legend). The model spectra have been normalised to the characteristic stellar mass of galaxies (M*) at the respective redshift based on Weaver et al. (2023) and Stefanon et al. (2021) which have values of log M⋆ = 10.65, 10.24, 10.0, 9.5 for redshifts z = 4, 6, 8, 10, respectively. All models assume a Chabrier (2003) IMF, a delayed exponential star-formation history with τ = 2 Gyr, Solar metalicity, and Calzetti et al. (2000) dust with AV = 0.2. |
| In the text | |
|
Fig. 4. Footprints of the DAWN survey image data in the EDFs. We note that the Rubin/LSST footprint in EDF-S shows the expected pointing pattern for the EDF-S Deep Drilling Field and may change once the survey begins (Ivezić et al. 2019). |
| In the text | |
|
Fig. 5. Footprints of the DAWN survey image data in the EAFs. The coloured lines show the extent of the image data indicated in the legend. We note that the EAF footprints are approximations based on the Euclid survey plan. Updated footprints that reflect the actual Euclid coverage in the EAFs will be provided in subsequent DAWN data releases. |
| In the text | |
|
Fig. 6. Example of the image data quality from the DAWN MegaCam, HSC, and IRAC programs in EDF-N. The bottom panel shows a riz colour image (2′ × 1′), and the top row shows a zoom-in (20″ × 20″) of the highlighted region in each band of the DAWN data. |
| In the text | |
|
Fig. 7. Measurements of the UV luminosity function ϕ at z = 8–10 from the literature (Oesch et al. 2018; Bowler et al. 2020; Bouwens et al. 2021; Finkelstein & Bagley 2022; Adams et al. 2024; Donnan et al. 2023). The red and blue lines show extrapolations to the volume of the DAWN survey based on the best-fitting Schechter and double power-law (DPL) functions, with the shaded regions showing associated Poisson uncertainties for the DAWN survey volume. Upper limits based on survey volume are indicated with the horizontal lines. The DAWN volume in each panel assumes an area of 59 deg2, a redshift slice of ±0.5 from the redshift bin centre, and a Planck Collaboration VI (2020)ΛCDM cosmology. |
| In the text | |
|
Fig. 8. Large-scale spatial distribution of the neutral hydrogen fraction at z ≃ 7 (neutral = black, white and grey = ionised) of the MHDEC (i.e. fesc decreases with halo mass, Mh) simulation presented in Hutter et al. (2023). The neutral hydrogen fraction shown here is averaged over three cells along the line of sight, where each cell has a comoving depth of 312.5 h−1 kpc and the dimensionless Hubble constant h = 0.6777. The width and height of the box are given in comoving units and correspond to 1° at z = 7. Blue circles depict galaxies with UV luminosities of at least MUV ≥ −18 and red stars the brightest galaxies in the simulation box with MUV ≥ −21. |
| In the text | |
|
Fig. 9. Stellar mass function, Φ, measurements (hatched regions) from HST (S+21; Stefanon et al. 2021), the COSMOS field (W+22; Weaver et al. 2023), and JWST (N-C+23; Navarro-Carrera et al. 2024) in three redshift bins: z ∼ 6 (left), 7 (middle), and 8 (right). The dashed lines show extrapolations to higher masses for the DAWN survey volume (calculated in the same way as in Fig. 7) assuming the corresponding literature Schechter function fits, and the accompanying shaded regions show estimated uncertainties. Upper limits for empty bins for the respective survey are indicated with horizontal lines. We note that due to the shallower IRAC data in EDF-S (see Table 2), the z ∼ 8 bin assumes a smaller effective area of 39 deg2. The grey shaded regions indicate the theoretical upper limit of the SMF in each redshift bin based on the Despali et al. (2016) halo mass function when assuming a fixed baryon fraction of 0.018 as in Weaver et al. (2023). |
| In the text | |
|
Fig. 10. Redshift evolution of linear galaxy bias. The early prediction from Tegmark & Peebles (1998) is shown in solid grey, and more recent models separated by stellar mass from Moster et al. (2010) are shown as dashed grey curves. High-z measurements for dropout-selected samples from Beck et al. (2020) and Harikane et al. (2022) are shown in red and green, respectively. Low-z measurements for two stellar masses from Ishikawa et al. (2020) are shown in blue and purple. The DAWN survey will allow us to constrain bias as a function of redshift and stellar mass in the shaded region. |
| In the text | |
Current usage metrics show cumulative count of Article Views (full-text article views including HTML views, PDF and ePub downloads, according to the available data) and Abstracts Views on Vision4Press platform.
Data correspond to usage on the plateform after 2015. The current usage metrics is available 48-96 hours after online publication and is updated daily on week days.
Initial download of the metrics may take a while.