| Issue |
A&A
Volume 697, May 2025
Euclid on Sky
|
|
|---|---|---|
| Article Number | A16 | |
| Number of page(s) | 17 | |
| Section | Extragalactic astronomy | |
| DOI | https://doi.org/10.1051/0004-6361/202450794 | |
| Published online | 30 April 2025 | |
Euclid: Early Release Observations – NISP-only sources and the search for luminous z = 6–8 galaxies★
1
Department of Astronomy, University of Massachusetts,
Amherst,
MA
01003, USA
2
Physics and Astronomy Department, University of California,
900 University Ave.,
Riverside,
CA
92521, USA
3
Cosmic Dawn Center (DAWN),
Denmark
4
Niels Bohr Institute, University of Copenhagen,
Jagtvej 128,
2200
Copenhagen, Denmark
5
Institute for Astronomy, University of Hawaii,
2680 Woodlawn Drive,
Honolulu,
HI
96822, USA
6
Institut d’Astrophysique de Paris, UMR 7095, CNRS, and Sorbonne Université,
98 bis boulevard Arago,
75014
Paris,
France
7
Jodrell Bank Centre for Astrophysics, Department of Physics and Astronomy, University of Manchester,
Oxford Road,
Manchester
M13 9PL, UK
8
Jet Propulsion Laboratory, California Institute of Technology,
4800 Oak Grove Drive,
Pasadena,
CA,
91109,
USA
9
Department of Astronomy, School of Science, The University of Tokyo,
7-3-1 Hongo,
Bunkyo, Tokyo 113-0033,
Japan
10
Max-Planck-Institut für Astronomie,
Königstuhl 17,
69117
Heidelberg, Germany
11
INAF – Osservatorio di Astrofisica e Scienza dello Spazio di Bologna,
Via Piero Gobetti 93/3,
40129
Bologna, Italy
12
Department of Astronomy, University of Geneva,
ch. d’Ecogia 16,
1290
Versoix, Switzerland
13
School of Physical Sciences, The Open University,
Milton Keynes MK7 6AA, UK
14
Astrophysics Group, Blackett Laboratory, Imperial College London,
London
SW7 2AZ, UK
15
Department of Mathematics, Imperial College London,
London
SW7 2AZ, UK
16
School of Physics and Astronomy, University of Nottingham, University Park,
Nottingham
NG7 2RD, UK
17
Max Planck Institute for Extraterrestrial Physics,
Giessenbachstr. 1,
85748
Garching, Germany
18
Dipartimento di Fisica e Astronomia “G. Galilei”, Università di Padova,
Via Marzolo 8,
35131
Padova, Italy
19
INAF-Osservatorio Astronomico di Padova,
Via dell’Osservatorio 5,
35122
Padova, Italy
20
Instituto de Física de Cantabria, Edificio Juan Jordá, Avenida de los Castros,
39005
Santander,
Spain
21
Aix-Marseille Université, CNRS, CNES, LAM,
Marseille,
France
22
Institute for Astronomy, University of Edinburgh, Royal Observatory,
Blackford Hill,
Edinburgh
EH9 3HJ, UK
23
Institut d’Astrophysique de Paris,
98bis Boulevard Arago,
75014
Paris,
France
24
Université Paris-Saclay, CNRS, Institut d’astrophysique spatiale,
91405
Orsay,
France
25
Université de Strasbourg, CNRS, Observatoire astronomique de Strasbourg,
UMR 7550,
67000
Strasbourg, France
26
Kapteyn Astronomical Institute, University of Groningen,
PO Box 800,
9700
AV Groningen, The Netherlands
27
ESAC/ESA, Camino Bajo del Castillo,
s/n., Urb. Villafranca del Castillo,
28692
Villanueva de la Cañada, Madrid,
Spain
28
HE Space for European Space Agency (ESA), Camino bajo del Castillo,
s/n, Urbanizacion Villafranca del Castillo,
Villanueva de la Cañada,
28692
Madrid,
Spain
29
Université Paris-Saclay, Université Paris Cité, CEA, CNRS, AIM,
91191
Gif-sur-Yvette, France
30
European Space Agency/ESTEC,
Keplerlaan 1,
2201
AZ Noordwijk, The Netherlands
31
Department of Physics, Université de Montréal,
2900 Edouard Montpetit Blvd,
Montréal, Québec
H3T 1J4, Canada
32
School of Mathematics and Physics, University of Surrey,
Guildford, Surrey
GU2 7XH, UK
33
INAF-Osservatorio Astronomico di Brera,
Via Brera 28,
20122
Milano, Italy
34
Dipartimento di Fisica e Astronomia, Università di Bologna,
Via Gobetti 93/2,
40129
Bologna, Italy
35
INFN-Sezione di Bologna,
Viale Berti Pichat 6/2,
40127
Bologna, Italy
36
Universitäts-Sternwarte München, Fakultät für Physik, Ludwig-Maximilians-Universität München,
Scheinerstrasse 1,
81679
München, Germany
37
INAF-Osservatorio Astrofisico di Torino,
Via Osservatorio 20,
10025
Pino Torinese (TO), Italy
38
Dipartimento di Fisica, Università di Genova,
Via Dodecaneso 33,
16146, Genova,
Italy
39
INFN-Sezione di Genova,
Via Dodecaneso 33,
16146
Genova, Italy
40
Department of Physics “E. Pancini”, University Federico II,
Via Cinthia 6,
80126, Napoli,
Italy
41
INAF-Osservatorio Astronomico di Capodimonte,
Via Moiariello 16,
80131
Napoli, Italy
42
INFN section of Naples,
Via Cinthia 6,
80126
Napoli, Italy
43
Instituto de Astrofísica e Ciências do Espaço, Universidade do Porto, CAUP, Rua das Estrelas,
4150-762
Porto, Portugal
44
Faculdade de Ciências da Universidade do Porto, Rua do Campo de Alegre,
4150-007
Porto, Portugal
45
Dipartimento di Fisica, Università degli Studi di Torino,
Via P. Giuria 1,
10125
Torino, Italy
46
INFN-Sezione di Torino,
Via P. Giuria 1,
10125
Torino, Italy
47
INAF-IASF Milano,
Via Alfonso Corti 12,
20133
Milano, Italy
48
INAF-Osservatorio Astronomico di Roma,
Via Frascati 33,
00078
Monteporzio Catone, Italy
49
INFN-Sezione di Roma, Piazzale Aldo Moro 2, c/o Dipartimento di Fisica, Edificio G. Marconi,
00185
Roma,
Italy
50
Centro de Investigaciones Energéticas, Medioambientales y Tecnológicas (CIEMAT),
Avenida Complutense 40,
28040
Madrid, Spain
51
Port d’Informació Científica,
Campus UAB, C. Albareda s/n,
08193
Bellaterra (Barcelona), Spain
52
Institute for Theoretical Particle Physics and Cosmology (TTK), RWTH Aachen University,
52056
Aachen,
Germany
53
Institute of Space Sciences (ICE, CSIC),
Campus UAB, Carrer de Can Magrans, s/n,
08193
Barcelona,
Spain
54
Institut d’Estudis Espacials de Catalunya (IEEC), Edifici RDIT,
Campus UPC,
08860
Castelldefels, Barcelona,
Spain
55
Dipartimento di Fisica e Astronomia “Augusto Righi” – Alma Mater Studiorum Università di Bologna,
Viale Berti Pichat 6/2,
40127
Bologna, Italy
56
European Space Agency/ESRIN,
Largo Galileo Galilei 1,
00044 Frascati, Roma,
Italy
57
Université Claude Bernard Lyon 1, CNRS/IN2P3, IP2I Lyon, UMR 5822,
Villeurbanne,
F-69100, France
58
Institute of Physics, Laboratory of Astrophysics, Ecole Polytechnique Fédérale de Lausanne (EPFL), Observatoire de Sauverny,
1290
Versoix,
Switzerland
59
UCB Lyon 1, CNRS/IN2P3, IUF, IP2I Lyon,
4 rue Enrico Fermi,
69622
Villeurbanne,
France
60
Departamento de Física, Faculdade de Ciências, Universidade de Lisboa, Edifício C8, Campo Grande,
1749-016
Lisboa, Portugal
61
Instituto de Astrofísica e Ciências do Espaço, Faculdade de Ciências, Universidade de Lisboa, Campo Grande,
1749-016
Lisboa, Portugal
62
INAF-Istituto di Astrofisica e Planetologia Spaziali,
via del Fosso del Cavaliere, 100,
00100
Roma, Italy
63
School of Physics, HH Wills Physics Laboratory, University of Bristol,
Tyndall Avenue,
Bristol,
BS8 1TL,
UK
64
INAF-Osservatorio Astronomico di Trieste,
Via G. B. Tiepolo 11,
34143
Trieste, Italy
65
Aix-Marseille Université, CNRS/IN2P3, CPPM,
Marseille,
France
66
Istituto Nazionale di Fisica Nucleare, Sezione di Bologna,
Via Irnerio 46,
40126
Bologna, Italy
67
FRACTAL S.L.N.E., calle Tulipán 2,
Portal 13 1A,
28231,
Las Rozas de Madrid, Spain
68
Dipartimento di Fisica “Aldo Pontremoli”, Università degli Studi di Milano,
Via Celoria 16,
20133
Milano, Italy
69
Institute of Theoretical Astrophysics, University of Oslo,
P.O. Box 1029 Blindern,
0315
Oslo,
Norway
70
Leiden Observatory, Leiden University,
Einsteinweg 55,
2333
CC Leiden, The Netherlands
71
Department of Physics, Lancaster University,
Lancaster,
LA1 4YB,
UK
72
Felix Hormuth Engineering,
Goethestr. 17,
69181
Leimen, Germany
73
Technical University of Denmark,
Elektrovej 327,
2800
Kgs. Lyngby, Denmark
74
NASA Goddard Space Flight Center,
Greenbelt,
MD
20771, USA
75
Department of Physics and Helsinki Institute of Physics,
Gustaf Hällströmin katu 2,
00014
University of Helsinki, Finland
76
Mullard Space Science Laboratory, University College London, Holmbury St Mary,
Dorking, Surrey
RH5 6NT, UK
77
Université de Genève, Département de Physique Théorique and Centre for Astroparticle Physics,
24 quai Ernest-Ansermet,
CH-1211
Genève 4, Switzerland
78
Department of Physics,
PO Box 64,
00014
University of Helsinki, Finland
79
Helsinki Institute of Physics, Gustaf Hällströmin katu 2, University of Helsinki,
Helsinki,
Finland
80
Department of Physics and Astronomy, University College London,
Gower Street,
London
WC1E 6BT, UK
81
NOVA optical infrared instrumentation group at ASTRON,
Oude Hoogeveensedijk 4,
7991PD, Dwingeloo,
The Netherlands
82
INFN-Sezione di Milano,
Via Celoria 16,
20133
Milano, Italy
83
Universität Bonn, Argelander-Institut für Astronomie,
Auf dem Hügel 71,
53121
Bonn, Germany
84
Dipartimento di Fisica e Astronomia “Augusto Righi” – Alma Mater Studiorum Università di Bologna,
via Piero Gobetti 93/2,
40129
Bologna, Italy
85
Department of Physics, Centre for Extragalactic Astronomy, Durham University,
South Road,
DH1 3LE,
UK
86
Infrared Processing and Analysis Center, California Institute of Technology,
Pasadena,
CA
91125, USA
87
Université Côte d’Azur, Observatoire de la Côte d’Azur, CNRS, Laboratoire Lagrange, Bd de l’Observatoire,
CS 34229,
06304
Nice cedex 4, France
88
Université Paris Cité, CNRS, Astroparticule et Cosmologie,
75013
Paris,
France
89
University of Applied Sciences and Arts of Northwestern Switzerland, School of Engineering,
5210
Windisch,
Switzerland
90
Institut de Física d’Altes Energies (IFAE), The Barcelona Institute of Science and Technology,
Campus UAB,
08193
Bellaterra (Barcelona), Spain
91
Department of Physics and Astronomy, University of Aarhus,
Ny Munkegade 120,
8000
Aarhus C, Denmark
92
Waterloo Centre for Astrophysics, University of Waterloo, Waterloo,
Ontario
N2L 3G1, Canada
93
Department of Physics and Astronomy, University of Waterloo, Waterloo,
Ontario
N2L 3G1, Canada
94
Perimeter Institute for Theoretical Physics, Waterloo,
Ontario
N2L 2Y5, Canada
95
Space Science Data Center, Italian Space Agency, via del Politecnico snc,
00133
Roma,
Italy
96
Centre National d’Etudes Spatiales – Centre spatial de Toulouse,
18 avenue Edouard Belin,
31401
Toulouse Cedex 9, France
97
Institute of Space Science, Str. Atomistilor, nr. 409 Măgurele, Ilfov,
077125,
Romania
98
INFN-Padova,
Via Marzolo 8,
35131
Padova, Italy
99
Departamento de Física, FCFM, Universidad de Chile,
Blanco Encalada 2008,
Santiago,
Chile
100
Universität Innsbruck, Institut für Astro- und Teilchenphysik,
Technikerstr. 25/8,
6020
Innsbruck, Austria
101
Satlantis, University Science Park,
Sede Bld 48940,
Leioa-Bilbao, Spain
102
Instituto de Astrofísica e Ciências do Espaço, Faculdade de Ciências, Universidade de Lisboa, Tapada da Ajuda,
1349-018
Lisboa, Portugal
103
Universidad Politécnica de Cartagena, Departamento de Electrónica y Tecnología de Computadoras,
Plaza del Hospital 1,
30202
Cartagena, Spain
104
Institut de Recherche en Astrophysique et Planétologie (IRAP), Université de Toulouse, CNRS, UPS, CNES,
14 Av. Edouard Belin,
31400
Toulouse,
France
105
INFN-Bologna,
Via Irnerio 46,
40126
Bologna, Italy
106
Dipartimento di Fisica, Università degli studi di Genova, and INFN- Sezione di Genova,
via Dodecaneso 33,
16146
Genova, Italy
107
INAF, Istituto di Radioastronomia,
Via Piero Gobetti 101,
40129
Bologna, Italy
108
Institut für Theoretische Physik, University of Heidelberg,
Philosophenweg 16,
69120
Heidelberg, Germany
109
Université St Joseph; Faculty of Sciences,
Beirut,
Lebanon
110
Junia, EPA department,
41 Bd Vauban,
59800
Lille,
France
111
IFPU, Institute for Fundamental Physics of the Universe,
via Beirut 2,
34151
Trieste, Italy
112
SISSA, International School for Advanced Studies,
Via Bonomea 265,
34136
Trieste TS, Italy
113
INFN, Sezione di Trieste,
Via Valerio 2,
34127
Trieste TS, Italy
114
ICSC – Centro Nazionale di Ricerca in High Performance Computing, Big Data e Quantum Computing,
Via Magnanelli 2,
Bologna,
Italy
115
Aurora Technology for European Space Agency (ESA), Camino bajo del Castillo,
s/n, Urbanizacion Villafranca del Castillo, Villanueva de la Cañada,
28692
Madrid,
Spain
116
Department of Physics and Astronomy, University of British Columbia,
Vancouver
BC
V6T 1Z1,
Canada
★★ Corresponding author; This email address is being protected from spambots. You need JavaScript enabled to view it.
Received:
20
May
2024
Accepted:
17
June
2024
Abstract
This paper presents a search for high redshift galaxies from the Euclid Early Release Observations program ‘Magnifying Lens.’ The 1.5 deg2 area covered by the twin Abell lensing cluster fields is comparable in size to the few other deep near-infrared surveys such as COSMOS, and so provides an opportunity to significantly increase known samples of rare UV-bright galaxies at z ≈ 6–8 (MUV ≲ −22). Beyond their still uncertain role in reionisation, these UV-bright galaxies are ideal laboratories from which to study galaxy formation and constrain the bright-end of the UV luminosity function. Of the 501 994 sources detected from a combined YE, JE, and HE NISP detection image, 168 do not have any appreciable VIS/IE flux. These objects span a range in spectral colours, separated into two classes: 139 extremely red sources; and 29 Lyman-break galaxy candidates. Best-fit redshifts and spectral templates suggest the former is composed of both z ≳ 5 dusty star-forming galaxies and z ≈ 1–3 quiescent systems. The latter is composed of more homogeneous Lyman-break galaxies at z ≈ 6–8. In both cases, contamination by L- and T-type dwarfs cannot be ruled out with Euclid images alone. Additional contamination from instrumental persistence is investigated using a novel time series analysis. This work lays the foundation for future searches within the Euclid Deep Fields, where thousands more z ≳ 6 Lyman-break systems and extremely red sources will be identified.
Key words: catalogs / galaxies: evolution / galaxies: high-redshift
This paper is published on behalf of the Euclid Consortium
© The Authors 2025
 Open Access article, published by EDP Sciences, under the terms of the Creative Commons Attribution License (https://creativecommons.org/licenses/by/4.0), which permits unrestricted use, distribution, and reproduction in any medium, provided the original work is properly cited.
This article is published in open access under the Subscribe to Open model. This email address is being protected from spambots. You need JavaScript enabled to view it. to support open access publication.
1 Introduction
The reionisation of neutral hydrogen within the intergalactic medium (IGM) marks a major transition in cosmic history. Ionising Lyman continuum photons emitted from the first generations of massive stars is thought to have contributed significantly to the reionisation budget (Dayal & Ferrara 2018; Finkelstein et al. 2019; Atek et al. 2024). Observations from Planck find z = 7.67 ± 0.73 as the mid-point of the reionisation era, concluding sometime around z ≈ 6 with a transparent IGM (Planck Collaboration XIII 2016). Within the standard paradigm of hierarchical structure formation, the first structures collapse within the most overdense regions of the primordial web of dark matter (White & Frenk 1991; Behroozi et al. 2019), from which the first stars form. As such, the topology of reionisation should be patchy, varying significantly over degree scales (Trac et al. 2015; Neyer et al. 2023; Lu et al. 2024). Galaxies born out of these overdensities are expected to be rapidly star-forming and therefore UV luminous, but correspondingly rare (Kauffmann et al. 2022; Naidu et al. 2022b). Elsewhere, collections of less UV luminous systems formed in comparably greater numbers (Bouwens et al. 2015, 2023; Finkelstein et al. 2015; Qin et al. 2019; Kauffmann et al. 2022; Leung et al. 2023; Adams et al. 2024; Donnan et al. 2024). Recent advancements enabled by the James Webb Space Telescope (JWST) suggest that while the total ionising flux of UV luminous galaxies is higher, the escape fraction of ionising photons and therefore relative ionising contribution may be subdominant (Roberts-Borsani et al. 2023; Endsley et al. 2023; Atek et al. 2024). Furthermore, the discovery of surprisingly massive active black holes at z ≈ 6–10 has re-ignited the possibility of a quasar contribution to reionisation (Bañados et al. 2018; Jiang et al. 2022; Furtak et al. 2023; Juodžbalis et al. 2023; Kokorev et al. 2023; Dayal et al. 2024; Greene et al. 2024).
Owing to their apparent magnitudes J ≈ 24–26 AB and observational accessibility from near-infrared (NIR) surveys, UV luminous Lyman-break galaxies (LBGs, MUV ≲. −21 AB) from the reionisation era (z > 6) have been detected from the few degree-scale NIR surveys wide enough to find them, for example SXDF and COSMOS (Bowler et al. 2014; Kauffmann et al. 2022; Donnan et al. 2023; Varadaraj et al. 2023). Pre-JWST studies already hinted at a potential excess of UV-luminous LBGs at z = 8–10 compared to typically assumed Schechter functional forms, and a seemingly slow evolution in the bright- end of the galaxy UV luminosity function at these redshifts (Bowler et al. 2020). This slow evolution in the number density of UV-luminous LBGs is being confirmed by the most recent observations of JWST at z > 10 (e.g. Harikane et al. 2023; Chemerynska et al. 2023; Adams et al. 2024). However, their scarce number density on the sky makes it challenging to assemble large samples to accurately determine the shape of bright end of the UV luminosity function, which holds crucial information on the early assembly of galaxies. Neither the Hubble Space Telescope (HST) nor JWST are capable of efficiently surveying degree-scale areas, requiring continued investment in large (albeit lower resolution) NIR surveys from space and the ground.
These UV luminous, rapidly star forming galaxies are expected to be some of the fastest growing systems of their epoch. Although speculative in nature, they are some of the most suitable candidates for being the progenitors of massive galaxies at later epochs, possibly also of the first generation to have ceased star-formation (Carnall et al. 2023; Glazebrook et al. 2023). If so, then these rare systems are vital laboratories for examining galaxy evolution at its most extreme. Constraining their mass build up and future evolution requires star formation rates, stellar masses, star-formation histories, and estimates of their gas reservoirs. Detailed spectroscopic follow-up is only now beginning to reveal the extraordinary variation in their physical properties (Endsley et al. 2022; Bowler et al. 2024; Algera et al. 2024; Schouws et al. 2023). Given this diversity, the limited samples currently available from the few degree-scale deep NIR surveys are insufficient to characterise them as a population. Progress as to their nature and contribution to reionisation requires even larger NIR surveys.
Another major contribution from NIR surveys is the discovery of extremely red sources (e.g. Wang et al. 2016; Franco et al. 2018; Wang et al. 2019; Zavala et al. 2021). Presumably reddened by dust obscuration, far-infrared studies have accomplished much by identifying the UV light reprocessed by obscuring dust clouds. JWST too, in its first images, revealed a surprising abundance of extremely red, dust-obscured disc galaxies (Nelson et al. 2023), which may have significant contributions to the stellar mass and star-formation budgets at z > 3 (Gottumukkala et al. 2024; Wang et al. 2024; Williams et al. 2023). However, quiescent galaxies with their characteristically old stellar populations are a known but important interloper population (Barrufet et al. 2024). Both pose significant obstacles to identifying genuine high-redshift galaxies (Naidu et al. 2022a; Zavala et al. 2023).
The European Space Agency (ESA) Euclid mission was launched in July 2023. A medium-class probe, it was designed to survey the Universe to uncover details as to the nature and evolution of dark matter and dark energy − two elusive components of the ΛCDM cosmological model (Laureijs et al. 2011; Euclid Collaboration: Mellier et al. 2025). Its two instruments are the visible instrument (VIS, Euclid Collaboration: Cropper et al. 2025) with its characteristic ultra-broad IE passband ideally suited for obtaining high-resolution optical imaging necessary for weak lensing studies, and the Near-Infrared Spectrometer and Photometer (NISP, Euclid Collaboration: Jahnke et al. 2025), providing a complement of lower-resolution NIR data in the YE, JE, and HE passbands (Euclid Collaboration: Schirmer et al. 2022) to secure photometric redshifts in addition to slitless grism spectroscopy. This unique combination of instruments is key to achieving Euclid’s objectives, and goes hand-in-hand with the multi-tiered survey strategy ranging from the Euclid Wide Survey (EWS, Euclid Collaboration: Scaramella et al. 2022) over 14 000 deg2 to a 53 deg2 Euclid Deep Survey (EDS) of three primary fields: the Euclid Deep Field North (EDF-North); the Euclid Deep Field South (EDF-South); and the Euclid Deep Field Fornax (EDF-Fornax). Additional complements from well- studied auxiliary fields, such as COSMOS and a self-calibration field within EDF-North, along with grism observations, are purposely designed to improve key measurements.
Six Early Release Observations (ERO) projects were chosen to highlight the capability of Euclid to study a variety of astrophysical phenomena (Cuillandre et al. 2025; Euclid Early Release Observations 2024). Among them, ‘Magnifying Lens’ (PI: H. Atek) takes aim at two massive galaxy clusters, Abell 2390 and Abell 2764, with VIS/IE, NISP/YE, JE, HE, as well as NISP grism observations (Atek et al. 2025). While the magnifying power of their deep gravitational potentials helps to resolve galaxies immediately behind the cluster, the large 0.75 deg2 area of each field enables an order-of-magnitude increase in the number of detectable z ≳ 6 UV bright galaxies compared to small area blank fields from HST and JWST (e.g. CANDELS, Duncan et al. 2014; Bouwens et al. 2015; Finkelstein et al. 2015). This rich sample of high-redshift systems can then be used to constrain the UV luminosity functions of galaxies and quasars, the physics of which can be studied from detailed spectroscopic follow up. These same observations can also be used to constrain dark matter through weak lensing analyses, as well as the virial masses and assembly history of the cluster galaxies themselves.
This work aims to showcase the ability of Euclid to identify rare NISP-only objects (i.e. not detected in VIS/IE), such as luminous high-redshift galaxies and extremely red sources, and is organised as follows. Section 2 describes the observations, data reduction, and photometric catalogue of Abell 2390 and Abell 2764. Section 3 presents the methodology adopted to identify NISP-only objects. Section 4 presents the photometrically- selected sample, its properties, sources of potential contamination, and physical interpretation. Section 5 discusses the challenges encountered and a prospectus for identifying such systems from the EDS and auxiliary fields. These results are computed adopting a standard ΛCDM cosmology with H0 = 70 km s−1 Mpc−1, Ωm = 0.3 and ΩΛ = 0.7 throughout. All magnitudes are expressed in the AB system (Oke 1974), for which a flux fν in µJy (10−29 erg cm−2s−1 Hz−1) corresponds to an AB magnitude of 23.9−2.5 log10(fν/µJy).
2 Data and photometric catalogue
2.1 Observations
The ERO Magnifying Lens project consists of intermediatedepth observations of two known galaxy clusters, Abell 2390 and Abell 2764. While both are rich systems with many lensed background sources, Abell 2390 (z = 0.228, Sohn et al. 2020) is better studied than Abell 2764 (z = 0.07, Katgert et al. 1996). See Atek et al. (2025) for details of the field selection.
For each field, Euclid obtained three reference observing sequences (ROS, see Fig. 8 of Euclid Collaboration: Scaramella et al. 2022) of 70.2 min which include VIS/IE and NISP/YE, JE, HE imaging, adopting a 3′×3′ dither between each ROS to fill-in coverage between the 36 chips. Individual IE, YE, JE , and HE exposures were stacked to produce four deep mosaics using SWarp (Bertin et al. 2002) at native 0″.1 pix−1 and 0″. 3 pix−1 scales, respectively. A 64 pixel mesh and 3× smoothing factor was adopted to model and subtract the background light, which for VIS is more challenging given the bluer Galactic cirrus foreground. Furthermore, intracluster light spans only a small fraction of the total field and as such it is not subtracted. Although other images produced through other approaches were considered, this work adopts the ‘Compact-sources’ images because they are optimised for photometry of faint, compact objects. See Cuillandre et al. (2025) for a complete description of the reduction procedure.
Each mosaic spans 0.75 deg2, making the IE = 27.1 AB (5σ point source) VIS images some of the deepest at such high- resolution covering degree-scales, comparable only to the largest HST mosaic taken (ACS/F814W over 1.7 deg2 in COSMOS, Koekemoer et al. 2011). Similarly, the YE, JE, and HE ≈24.5 AB (5σ point source) images are some of the deepest NIR imaging covering degree-scales, comparable only to VIDEO (Jarvis et al. 2013) and the UltraVISTA survey of COSMOS (McCracken et al. 2012). Although designed for identifying new strongly lensed galaxies, their large contiguous areas beyond the cluster centres make them well-suited for identifying high-redshift, restframe UV bright objects that are too rare to be found consistently by smaller NIR surveys. Images are available for download1.
2.2 Photometric catalogue
Sources were detected in each field using Pythonic Source Extractor (SEP, Bertin & Arnouts 1996; Barbary 2016) from a CHI_MEAN coadd of all three NISP YE, JE, and HE mosaics constructed using SWarp (Bertin et al. 2002, see also Appendix B of Drlica-Wagner et al. 2018). To achieve maximal completeness, SEP was configured to detect sources whose pixels are significant above 1.5 σ across at least three contiguous pixels after smoothing with a 0″.45 (1.5 pixel) full-width-half-maximum Gaussian kernel (see Euclid Collaboration: Zalesky et al. 2025 for relevant discussion). Aggressive deblending is crucial to separating the relatively low-resolution NISP-only sources from line-of- sight neighbours. As such, SEP is configured to deblend with 2 × 10⁵ thresholds, requiring a contrast of 10−5, tuned by visual inspection. Cleaning was not applied as it is liable to remove real sources of interest. A total of 501 994 sources were recovered (98% have S/N > 3 in either YE, JE, or HE) with approximately equal numbers in each 0.5 deg2 field: 252 675 in Abell 2390; and 249 319 in Abell 2764.
Photometry was measured at source positions in circular apertures with diameters of 0″.1, 0″.2, 0″.3, 0″.6, 1″.0, 1″.2, 1″.5, and 2″.0. Uncertainties were measured similarly on the weight maps; their effective per-pixel error distributions were verified to be consistent with the per-pixel noise estimated directly from the science mosaics. Given the 0″.3 pix−1 scale of NISP, aperture diameters below 0″.6 are generally only suitable for VIS photometry.
Considering the difference in resolution and spatial sampling between VIS and NISP, it would seem advantageous to convolve all of the images to the broadest PSF, which is HE. However, this work exploits the unique potential of using VIS solely as a ‘dropout’ band where the colour terms between IE and YE, JE, and HE are largely inconsequential relative to the much more important signal-to-noise ratio (S/N) estimate from VIS/IE which would be severely degraded if the image were downsampled and smoothed. Instead, the VIS/IE S/N can be optimally determined from the original high-resolution images using a suitably chosen aperture that is large enough to be robust to noise but not corrupted by neighbouring sources. This fact, together with the relatively similar PSFs between all three NISP bands and the expected compactness of high-redshift Lyman-break galaxies (<1″ in radius, e.g. Bowler et al. 2017) means that we can expect to produce high-fidelity NISP colours by simply assuming that any light outside the aperture of choice is explained by the PSF.
All aperture flux estimates and their uncertainties are corrected to total flux by dividing by the fractional energy outside each aperture. This extended light distribution is measured from observed PSFs constructed by optimally stacking recentred cutouts of point sources identified from the science mosaics following Weaver et al. (2024). Relevant multiplicative correction factors for VIS are 16×, 3×, and 2× for 0″.1, 0″.2, and 0″.3 diameters, respectively; and 1.2×, 1.3×, and for NISP are 1.4× for 1″. 2 diameter apertures in YE, JE, and HE, respectively.
To facilitate community engagement with these ERO data, a combined photometric catalogue of all 501 994 sources is released with this work, jointly with the overview paper of Atek et al. (2025). The catalogue includes unique source identification numbers and field-specific identifiers, sky coordinates, elementary shape estimates, aperture and total fluxes, flux errors, and their aperture-to-total corrections, in addition to Source Extractor-like flags. Photometry is provided already corrected for Galactic extinction mapped by Schlafly & Finkbeiner (2011), adopting the extinction curves of Fitzpatrick & Massa (2007). There is a large number of artefacts near the mosaic edges where only a single dither contributes, as well as along the diffraction spikes of bright stars; these sources are identified in a hand-built region mask that excludes 15% of the total catalogue (use_phot = 0) near bright stars, diffraction spikes, and approximately 1′ around the mosaic edge. For the complete details, consult the README document provided with the catalogues2.
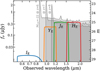 |
Fig. 1 Summary of Euclid’s ability to identify bright MUV < −22 LBGs detectable only in NISP (or VIS/IE dropout) from the ERO data of Abell 2764 and Abell 2390. Model spectra of an LBG at z = 7, 8, and 9 are generated with python-FSPS. Euclid IE, YE, JE, and HE transmission curves are normalised such that their peak coincides with the selection function adopted in this work. |
3 Candidate identification
Rather than only identifying galaxies at z ≈ 6–8, this work aims to identify all systems that are found only in the NISP YE, JE, and HE bands, lacking any detectable VIS IE signal. As such, a selection function is adopted requiring a S/N < 1.5 for VIS/IE (≈28.5 total) in each of 0″.1, 0″.2, and 0″.3 diameter apertures. While this unusually strict criterion can reject some real z ≈ 6–7 sources with non-negligible ionising UV continuum flux blueward of Lyα, it is necessary in order to maximise reliability (future ancillary optical data will help to relax this). Furthermore, sources are required to have JE and HE < 25 (S/N ≳ 5) and YE < 25.5 (S/N ≳ 3), all total magnitudes, relaxing the latter condition to allow for z ≈ 8 solutions where the Lyman-break is only marginally observed, but limits the search to z ≲ 8.5. However, the criteria demand that even the fainest candidates have an extraordinarily strong break with IE − YE > 2 greater than most Lyman-break selection criteria used in HST and JWST surveys (e.g. Bouwens et al. 2015; Finkelstein et al. 2015; Jiang et al. 2022; Atek et al. 2024; Adams et al. 2024), making these candidates unusually secure. Figure 1 illustrates these criteria relative to an MUV = −22 LBG at z = 7, 8, and 9 built from Python-FSPS (Conroy et al. 2009; Conroy & Gunn 2010; Johnson et al. 2023); this is a simple toy model assuming a maximally opaque foreground IGM, high Lyα escape, and no damping wing. The height of each transmission curve is set to the effective depth of this selection function.
For NISP, larger 1″.2 diameter apertures are chosen because they will enclose marginally resolved features expected of z ≈ 6–9 LBGs (e.g. Bowler et al. 2017). All colours are computed using the total fluxes because they produce less biased colours compared to aperture fluxes alone. To safeguard against artefacts near edges and diffraction spikes, sources in the masked regions are discounted. Furthermore, extremely extended sources unlikely to be high redshift are rejected by requiring that HE fluxes in 2″.0 apertures contain less than 20% more light than is contained in 1″.5 diameter apertures. Of the total 262 sources satisfying these criteria, a visual inspection identified 66 likely artefacts and 27 VIS detections arising from occasional unmasked anomalies in the mosaics such as diffraction spikes, cosmic rays, and low exposure areas.
Figures 2 and 3 illustrate the colours and compactness of the 168 remaining candidates. Interestingly, despite overall similar detections in each field, 109 sources are found in Abell 2390 and only 59 in Abell 2764, a ratio of about two to one. Reasons for this are likely related to brown dwarfs from the Galaxy, since the two fields have very different Galactic latitudes (see Sect. 5).
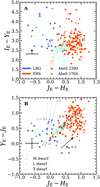 |
Fig. 2 Selection and properties of 168 NISP-only sources in Abell 2390 and Abell 2764. Sources are divided into Lyman-break galaxy (LBG) candidates and extremely red sources (ERSs). Panel A: IE − YE versus JE − HE colour-colour diagram highlighting the significance of the VIS non-detection (1.5σ lower limits) and general colours of the sources. Panel B: YE − JE versus JE − HE colour-colour diagram separating the two samples. Also shown is a reddening vector as well as tracks of z = 6–9 LBGs with different mean stellar ages (grey) and of z = 1–3 maximally old quiescent galaxies (maroon). Colours of observed M-, L-, and T-type dwarf stars are measured from the SpeX Prism Library (Burgasser et al. 2004). Typical colour uncertainties are shown in the upper two panels, where all IE − YE colours are lower limits. |
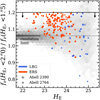 |
Fig. 3 HE brightness versus compactness estimated from a flux ratio in 2″.0 to 1″.5 apertures. Selected sources are required to be relatively compact with an aperture ratio below 1.2. The HE compactness of genuine point sources identified in IE from the parent catalogue is shown by the grey 2D histogram. Sources below a ratio of 1.0 are visually confirmed to have significantly negative pixels nearby. |
4 Results
The 168 sources selected in this work represent the most robust NISP-only objects chosen from Abell 2390 and Abell 2764. It is neither a complete sample nor a pure one, but is intended to showcase the potential of Euclid and its ability to select promising high-redshift galaxies, among other interesting NISP-only sources.
4.1 Properties of robust NISP-only sources
The candidates span a remarkable range in colour from extremely red to relatively flat colours. Figure 2 provides an overview of the properties of the sample. To better contrast this diversity, we elect to refer to the redder subsample of 129 VIS-undetected objects as ‘extremely red sources’ (ERSs), defined as having robustly red JE − HE and YE − JE colours, whereby a flat fν spectrum cannot be supported within the 1σ flux uncertainties of either colour. As evidenced by the reddening vector, these objects are consistent with high dust obscuration, although quiescent solutions are also possible (see Sect. 5). The remaining 29 objects with flat fν colours in both JE − HE and YE − JE are then consistent with z ≈ 6–9 LBGs, as demonstrated by the grid of redshifts and mean stellar ages (10, 50, and 100 Myr) derived from simple single stellar population models built with Python-FSPS including nebular emission line contributions. It is worth noting that although selected by consideration of their flux uncertainties, the two samples are clearly distinguished by their expected colours alone. Given that precise calibration of Euclid is ongoing (although zero-point uncertainties are likely already below 0.1), this work purposely avoids defining a strict colour-colour selection for either category. Summary information of the LBG and ERS candidates are listed in Table A.1 and Table B.1, respectively.
Morphologically, the majority of ERSs are at least marginally resolved or even disc-like whereas the LBGs occupy a range in compactness estimated from HE flux ratios between 1″.5 and 2″.0 diameter apertures, as shown in Fig. 2c. While the faintest LBGs appear more compact than point sources which have a typical flux ratio ≈ 1.0–1.1, they are likely unresolved objects whose flux ratio estimate is driven by noise. Visual inspection confirms this picture. Furthermore, only a few sources are close enough to the cluster core where magnification could be appreciable, which is particularly important for estimates of rest-frame UV magnitudes for the LBG candidates. Cutouts of all 168 sources, including false-colour images, are presented in Appendices A and B.
4.2 Physical interpretations
To learn more about the possible physical interpretation of these objects, best-fit spectral templates and photometric redshift likelihood distributions, ℒ(z), were estimated by fitting the photometry using eazy-py (Brammer et al. 2008). To avoid contamination from neighbours, total IE fluxes based on 0″.3 diameter apertures were coupled with total YE, JE, and HE fluxes based on 1″.2 diameter apertures. At the time of writing, the most comprehensive template set provided with eazy-py is sfhz_blue_agn, which improves on previous template sets by including a physical prior on allowed star-formation histories to exclude quiescent templates for high-redshift solutions, adding an extreme emission line template suitable for z > 6 UV-bright galaxies, and an active galactic nuclei torus template derived from Killi et al. (2024). All priors were turned off, and iterative zero point corrections were not applied.
Having applied eazy-py, the differences between the two samples are clarified. While most of the ERSs have bimodal ℒ(z) distributions, where a z ≈ 1–3 quiescent solution is degenerate with a z ≳ 5 dusty solution, all but two LBG candidates have uniquely best-fit photometric redshift solutions at z > 6 and best-fit templates consistent with their classification (the two exceptions are redder in JE − HE and have some low-z probability). Figures 4 and 5 show the best-fit template(s), ℒ(z), and cutouts for two typical examples of ERSs and LBGs, respectively. Also shown are the frame-by-frame lightcurves extracted from each exposure (see Sect. 5 for details).
It is difficult to determine the nature of the ERSs conclusively, and it is probably a mixed sample. Contamination from brown dwarfs is likely for unresolved ERSs, given that L-type dwarfs exhibit similar IE and YE, JE, and HE colours (Fig. 2). If extragalactic in nature, they could be maximally old quiescent systems at z ≈ 1–3 (van Dokkum et al. 2008; Damjanov et al. 2009), or extraordinarily dust-obscured star-forming galaxies at z ≳ 3 with high stellar masses (e.g. Manning et al. 2022; McKinney et al. 2023; Weaver et al. 2023a). Figure 4 highlights this uncertainty. In principle, deep, high-resolution far-infrared data could distinguish these possibilities, though this first-look study is solely focused on Euclid and leaves further investigation of these sources for future work. This being said, a cursory inspection of ancillary Spitzer/IRAC imaging of the centre of Abell 23903 detects every one of the six ERS targets they contain, confirming their extremely red nature.
The remaining LBG candidates, taken at face value, are extraordinarily bright objects for such an early epoch. Their restframe UV absolute magnitudes MUV from eazy-py range from −21.9 to −23.6, comparable to similarly selected samples from UltraVISTA and VIDEO (Bowler et al. 2017; Kauffmann et al. 2022; Varadaraj et al. 2023). If genuine, these rapidly forming systems may be the progenitors of the most massive systems to evolve at later epochs of cosmic history. In addition, they should be valuable tracers of the overdensities in the cosmic web (White & Frenk 1991). Note that while the Abell clusters provide a magnification boost, most LBGs are found far from the cluster core and have magnification factors on the order of unity. Properly delensing the photometry and MUV estimates requires a new lensing model that is not yet in hand.
Although an explicit calculation of the UV luminosity function is beyond the scope of this first-look study, the number densities of the 13 LBGs of −23 < MUV ≤ −22 at 6.5 < z ≤ 7.5 are comparable to literature estimates of the z ~ 7 UV luminosity function of LBGs (~ 10 over 1.5 deg2, e.g. Bowler et al. 2014; Finkelstein et al. 2015) or of quasars (Schindler et al. 2023; Matsuoka et al. 2023). This is encouraging given the uncertainties associated with photometry, redshifts, possible source magnification, and potential interlopers.
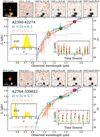 |
Fig. 4 Two extremely red sources showing their photometry, best-fit templates and bimodal ℒ(z) from eazy-py, cutouts, and light curves. The false colour image is composed from YE, JE, and HE and the cutouts are scaled linearly such that they saturate at ±3σ. Upper limits for IE are shown by the leftmost grey bar with an arrow, while selection limits for NISP bands are shown as grey bars. |
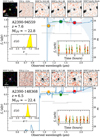 |
Fig. 5 Two bright Lyman-break galaxy candidates: their photometry, best-fit templates and uniquely high-z ℒ(z) from eazy-py, cutouts, and lightcurves. The false colour image is composed of YE, JE, and HE and the cutouts are scaled linearly such that they saturate at ±3σ. Upper limits for IE are shown by the leftmost grey bar with an arrow, while selection limits for NISP bands are shown by the grey bars. |
5 Discussion
Given that the EROs are only a first look at the Euclid mission, the primary goal of this work is simply to present a sample of NISP-only sources, describe the challenges encountered, and discuss possible solutions to overcome them. As such, this work refrains from generalising this sample to population statistics (e.g. the UV luminosity function), leaving such investigation to near-future Euclid studies where the 53 deg2 of Euclid Deep Survey and Auxillary Fields can be leveraged.
5.1 The expected appearance of high-z sources
Although VIS, with its finely sampled PSF, operates at the diffraction-limited resolution afforded by Euclid outside the Earth’s atmosphere, the broader PSF of NISP is still undersampled at a native 0″.3 pix−1 resolution, although ‘drizzling’ can improve this. This effect is highly relevant for assessing morphologies of high-redshift galaxy candidates, since traditional techniques developed from HST for example, typically use compactness to separate real point-sources (e.g. stars) from marginally resolved compact galaxies. This technique cannot be applied to sources only found in NISP, where the superior resolution of VIS cannot be leveraged. Figure 6 demonstrates this effect by injecting an MUV = −22 source into an empty region of the HE image of Abell 2390 (with the same result in Abell 2764) with three light distributions: a point source; a 1.5 kpc disc; and a tight clump of three point sources with a similar overall effective size of bright multi-component z ≈ 7 LBGs found by Bowler et al. (2017). The observed morphology in NISP at 0″.3 pix−1 scale in the ERO data is virtually the same for all three cases, and by z ≈ 9 is indistinguishable given the low S/N. As such, no attempt was made to separate candidates from stars based on their observed morphologies, although this may be possible in the future by combining the frames on a higher-resolution grid (e.g. with drizzling).
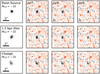 |
Fig. 6 Models of a MUV ≈ −22 AB galaxy at z = 7, 8, and 9 assuming three different morphologies: a point source; a 1.5 kpc disc; and a three-point-source clump of similar effective size simulated with The Tractor (Lang et al. 2016) and injected into a small empty region of the JE mosaic at native 0″.3 pix−1 scale. |
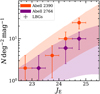 |
Fig. 7 The number density of selected LBG candidates in Abell 2390 (orange diamonds) and Abell 2764 (purple diamons) compared to a range of T-type dwarf stars (700–1300 K) number densities at the Galactic latitudes of each field. Dwarf sky densities are highly uncertain and are estimated assuming a Solar position of 27 pc above the Galactic plane, an exponential radial scale height of 2250 pc with a vertical scale length of 300 pc (Ryan et al. 2022). See Wood et al. (in prep.) for details. |
5.2 The probability of brown dwarf contaminants
It is well known that searches for genuine high-redshift LBGs are complicated by late-type MLT dwarf stars because they have similar NIR colours and little optical flux (Bowler et al. 2012, 2014; Varadaraj et al. 2023; Harikane et al. 2022). To illustrate this overlap, IE, YE, JE, and HE based colours were measured from observed spectra of M-, L-, and T-type dwarfs compiled in the SpeX Prism Spectral Library of Burgasser et al. (2004) and are shown alongside the sample in Fig. 2 by orange, cyan, and green points, respectively. While the YE, JE, HE colour-colour space shows that this sample is degenerate with M-, L-, and T- type dwarfs, the requirement of S/N < 1.5 in IE and YE ≳ 25.5 demands that candidates have an extraordinarily strong break with IE – YE > 2. Furthermore, such a strong optical-NIR break is only expected from L- and T-type dwarfs, implying that the depth of IE relative to that of YE effectively excludes M-types by virtue of the ROS design. Furthermore, the factor of 2 discrepancy between the two fields is consistent with the expected (but highly uncertain) sky density of T-type dwarfs as illustrated in Fig. 7, suggesting that from a statistical standpoint that there may be a non-negligible population of T-type dwarf interlopers (see Wood et al., in prep.). In absence of suitably deep ancillary data, a definitive characterisation of these ERO sources requires follow-up spectroscopy and will have to wait for future work.
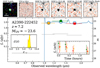 |
Fig. 8 Example of a suspected persistence signal appearing as a particularly UV-bright object. Time-series analysis of its frame-by-frame photometry reveals a potentially decaying signal suggestive of persistence. |
5.3 Identifying cases of persistence
The Euclid mission follows a consistent survey pattern wherein a single visit consists of four dithered pointings with simultaneous observing by VIS and NISP enabled by splitting the primary beam with a dichroic filter (see Euclid Collaboration: Scaramella et al. 2022 for details). While VIS integrates for an ultra-deep image (IE ≈ 26 per ROS), NISP begins with a 574-s integration of one of the two grism filters followed in order by equal 112-s integrations of JE, HE, and then YE (YE, JE, HE ≈ 25.4 per ROS). The order is important, since the NIR detectors of NISP are susceptible to charge persistence. This is where some charge from a previous exposure is trapped within the lattice defects of the NISP pixels. This manifests as a faint imprint of the previous exposures (grism or photometry) taken as much as 6-hours earlier.
The persistence signal within the EROs was modelled and subtracted from each ERO exposure. The persistence model was based on the flux of unsaturated pixels within all exposures taken up to 1 hour before the ERO exposure; see Sect. 4.3.1 of Cuillandre et al. (2025) for details. However, strong persistence (>70 ADU) was not modelled because it would leave visible residuals. Therefore, we checked whether this left-over persistence impacted our detection of ERSs and LBGs.
Most of the brightest identifiable spectral persistence was successfully identified, modelled, and subtracted following the procedure developed specifically for the handling of the EROs. Furthermore, since the morphology of the persistence introduced by a stimulus from grism observations follows that of the original spectral trace of the object, the compactness criteria outlined in Sect. 3 effectively rejects the largest of remaining artefacts. However, there are some possible situations in which persistence may remain in the exposures and impact the detection of ERSs and LBGs. One such situation is persistence from cosmic rays in the same ROS sequence (which originally saturated the detector). Another persistence source is saturated compact sources from observations of a previous ROS. Since the persistence signal, P, is expected to decay approximately like PJE ≈ fν/200, PHE ≈ PJE/2, and PYE ≈ PJE/3 for a typical exposure, the spectral colours JE < HE < YE expected of persistence can mimic a z ≳ 6 galaxy with appreciable Lyα emission or an extremely steep UV slope.
To facilitate the identification of such artefacts, light curves are constructed for each source by measuring their photometry in each pointing from all 12 exposures. Cosmic ray rejection and persistence cleaning are applied self-consistently to the mosaics and per-detector backgrounds are subtracted as 3σ-clipped medians. Lacking calibrated weight maps, on-the-fly photometric uncertainties are estimated by the standard deviation of the fluxes from 10 000 empty apertures placed around each image.
An example of suspected persistence is shown in Fig. 8, which otherwise has an UV magnitude consistent with a quasar or extremely luminous LBG. If indeed persistence, the stimulus occurred before or at the start of the observations of Abell 2390, unlike the spectro-to-photo persistence case mentioned above. However, while lightcurves are useful to rule out persistence in the case of bright sources, faint objects that are undetected in individual exposures (YE, JE, HE ≈ 24) will remain unidentifiable from a time series analysis. Given the expected exponential form of the UV luminosity function, the most common class of LBGs will be sufficiently faint to avoid detection in individual frames. While there were more obvious cases of persistence in earlier reductions that necessitated this lightcurve analysis, the removal of persistence in the ERO data improved significantly and the number of suspected cases diminished. In the final reductions we found no more extreme case than the candidate showed in Fig. 8, and so without absolute certainly declined to remove other candidates. Thankfully, the existence of complementary data from multiple optical and infrared facilities will greatly improve the prospects for identifying NISP-only artefacts (see the section below for details).
5.4 Outlook for Euclid Deep Fields
Upon their completion, the Euclid Deep Fields (EDFs) will survey 53 deg2 across three fields; EDF-North, EDF-South, and EDF-Fornax, at 2 magnitudes deeper than the EWS (Euclid Collaboration: Scaramella et al. 2022), with these two Abell ERO fields of intermediate depth. The 53-fold increase in area and greater depth translates to more than 10000 LBGs at z > 7 and up to 1000 at z > 8.5 (see Bowler et al. 2017), providing the first statistically meaningful samples of rare, UV-luminous galaxies in the reionisation era. Such samples will finally enable constraints to be placed on the evolution of the bright-end of the UV luminosity function, among other investigations. The lessons learned from this work can be applied to the EDFs, since the visit pattern, pointings, and filter order are the same. The only difference is the greater number of visits (i.e. depth), along with more dither positions and position angles which, will improve persistence identification. Additional image processing including drizzling is expected to maximise the science yielded by these fields. The methodology laid out in this work is only the start, and will be refined as more data are taken over the survey lifetime.
Two fields in particular, EDF-North and EDF-Fornax, enjoy significant ancillary observations in the UV, optical, and infrared with contributions from both the Hawaii Two-0 Survey and Spitzer Legacy Survey (Euclid Collaboration: Moneti et al. 2022), forming, in conjunction with Euclid, a part of the Cosmic Dawn Survey (DAWN, Euclid Collaboration: McPartland et al. 2025). The availability of deep optical data from CFHT Megacam/U and Subaru HSC/grizy will improve the robustness of the candidates found, reveal more about their physical properties, and extend drop-out searches to lower redshifts. Observed over 6000 hours, the Spitzer Legacy Survey provides deep 3.6- and 4.5-µm IRAC imaging necessary to constrain the young stellar populations of z ≳ 3 galaxies, when HE becomes a rest-UV indicator. Furthermore, detection of NISP-only sources by IRAC rules out artefacts such as persistence and gives a lever-arm to better identify contaminating brown dwarfs, thereby greatly improving the purity of future LBG and ERS samples (Euclid Collaboration: van Mierlo et al. 2022).
Euclid Collaboration: Zalesky et al. (2025) has established pre-Euclid optically-selected DAWN photometric redshift catalogues in EDF-North and EDF-Fornax. While apertures used in the present work are highly effective, obtaining robust photometry of IRAC sources at their characteristically low resolution benefits significantly from fitting galaxy light profiles, for example with The Farmer (Weaver et al. 2023b). With the addition of IE, YE, JE, and HE data, DAWN will provide NIR-selected catalogues of some 20 million sources across EDF-North and EDF-Fornax with robust photometric redshifts and galaxy stellar masses out to z ≈ 10. Additional complementary data from ongoing spectroscopic campaigns from Keck/DEIMOS and Keck/MOSFIRE, together with the invaluable NISP grism observations, will provide excellent calibration of photometric redshifts and derived physical properties. The unprecedented statistical power achieved by combining Euclid, CFHT, Subaru, and Spitzer will establish EDF-North and EDF-Fornax as the leading extragalactic fields visible from the northern hemisphere for the next decade. Rich volume-complete samples of LBGs at z = 6− 10 will provide definitive constraints on the number density and evolution of UV-luminous galaxies necessary to firmly challenge and ultimately refine theories of galaxy formation.
6 Summary
This paper presents one of the first science results from Euclid, leveraging the deep degree-scale NIR imaging with NISP to identify rare, UV-bright LBGs and extremely red sources that are not seen in smaller blank fields. Our larger aim to obtain large samples to provide the statistical power from which their abundance, redshifts, and physical properties can be definitively studied.
Over half a million sources are detected from the twin 0.75 deg2 YE, JE, and HE images, and their IE, YE, JE, and HE photometry is extracted from apertures corrected to total flux. Photometric redshifts and best-fit galaxy templates are estimated from eazy-py. The result is a highly bimodal sample spanning a range of spectral colours, with the following two classes of object:
29 sources have flat fν colours indicative of z ≈ 6–8 Lyman- break galaxies. Without magnification estimates, their MUV spans −21.9 to −23.6, making this one of the largest samples of UV-luminous high-redshift galaxy candidates found thus far. Contamination by quasars and T-type dwarfs is likely and still needs to be determined;
139 sources have extremely red colours indicative of either z ≳ 5 dusty star-forming galaxies or z ≈ 1–3 quiescent galaxies. Their redshift distributions are multi-modal, suggesting a mixture. A minority are point-like, which may be contamination by L-type dwarfs.
By selection, these objects are relatively compact, as anticipated for high-redshift LBGs. However, the morphological complexity of real LBGs seen with HST is less distinguishable here due to the 0″.3 pix−1 scale of NISP. As a result, artefacts, such as instrumental persistence, cannot be identified from their morphologies. Instead, this work explores the novel use of time series analysis to identify characteristics unique to persistence from the lightcurves of suspected sources. This will be applicable to future Euclid observations.
These comparably large samples of NISP-only sources will be dwarfed by those found imminently from the Euclid Deep Fields. EDF-North and EDF-Fornax, in particular, have deep optical Subaru/HSC and Spitzer/IRAC coverage, which not only provides a longer lever-arm to identify brown dwarfs, but also a means to immediately identify artefacts arising only in NISP. Upon its completion, the Subaru- Euclid - Spitzer Cosmic Dawn Survey will identify thousands of similarly UV-luminous galaxies at z > 6. These and other future searches will build on lessons learned from this work – the first foray into the distant Universe with Euclid.
Data availability
Tables A.1 and B.1 are available at the CDS via anonymous ftp to cdsarc.cds.unistra.fr (130.79.128.5) or via https://cdsarc.cds.unistra.fr/viz-bin/cat/J/A+A/697/A16.
Acknowledgements
The Cosmic Dawn Center (DAWN) is funded by the Danish National Research Foundation (DNRF140). HA is supported by the French Centre National d’Etudes Spatial (CNES). This work has made use of the CANDIDE Cluster at the Institut d'Astrophysique de Paris (IAP), made possible by grants from the PNCG and the region of Île de France through the program DIM-ACAV+, and the Cosmic Dawn Center and maintained by S. Rouberol. CS acknowledges the support of the NSERC Postdoctoral Fellowship and the CITA National Fellowship programs. This research has benefited from the SpeX Prism Spectral Libraries, maintained by Burgasser et al. (2004). This work made use of Astropy (http://www.astropy.org): a community-developed core Python package and an ecosystem of tools and resources for astronomy (Astropy Collaboration 2013, 2018, 2022) and Matplotlib (Hunter 2007). This work has made use of the Early Release Observations (ERO) data from the Euclid mission of the European Space Agency (ESA), 2024, https://doi.org/10.57780/esa-qmocze3. The Euclid Consortium acknowledges the European Space Agency and a number of agencies and institutes that have supported the development of Euclid, in particular the Agenzia Spaziale Italiana, the Austrian Forschungsförderungsgesellschaft, funded through BMK, the Belgian Science Policy, the Canadian Euclid Consortium, the Deutsches Zentrum für Luft- und Raumfahrt, the DTU Space and the Niels Bohr Institute in Denmark, the French Centre National d’Etudes Spatiales, the Fundação para a Ciência e a Tecnologia, the Hungarian Academy of Sciences, the Ministerio de Ciencia, Innovación y Universidades, the National Aeronautics and Space Administration, the National Astronomical Observatory of Japan, the Netherlandse Onderzoekschool Voor Astronomie, the Norwegian Space Agency, the Research Council of Finland, the Romanian Space Agency, the State Secretariat for Education, Research, and Innovation (SERI) at the Swiss Space Office (SSO), and the United Kingdom Space Agency. A complete and detailed list is available on the Euclid web site (http://www.euclid-ec.org).
Appendix A Lyman-break galaxy candidates
This appendix contains Table A.1 describing the coordinates, photometry, photometric redshift, and rest-frame UV magnitudes for the 29 LBG candidates, as well as cutouts in Fig. B.1. Table A.1 is only available in electronic form at the CDS via anonymous ftp to cdsarc.cds.unistra.fr (130.79.128.5) or via https://cdsarc.cds.unistra.fr/viz-bin/cat/J/A+A/697/A16.
Appendix B Extremely red sources
This appendix contains Table B.1 describing the coordinates, photometry, and photometric redshift solution(s) for the 139 ERSs, as well as cutouts in Figs. B.2, B.3, B.4 and B.5. Table B.1 is only available in electronic form at the CDS via anonymous ftp to cdsarc.cds.unistra.fr (130.79.128.5) or via https://cdsarc.cds.unistra.fr/viz-bin/cat/J/A+A/697/A16.
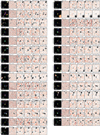 |
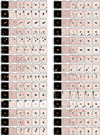
Fig. B.1 Cutouts of z ≈ 6–8 Lyman-break candidates. Leftmost false-colour RBG images are constructed from NISP/YE, Je, He. Others show VIS/IE, NISP/YE, JE, He, and the NISP detection stack, scaled to ±3σ to emphasise the significance of the detections. Cutouts are 5″along a side. |
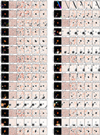 |
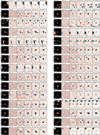
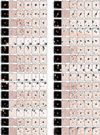
Fig. B.2 Cutouts of extremely red sources. Leftmost false-colour RBG images are constructed from NISP/YE, JE, HE. Others show VIS/IE, NISP/YE, JE, HE, and the NISP detection stack, scaled to ±3σ to emphasise the significance of the detections. Cutouts are 5″along a side. |
References
- Adams, N. J., Conselice, C. J., Austin, D., et al. 2024, ApJ, 965, 169 [NASA ADS] [CrossRef] [Google Scholar]
- Algera, H. S. B., Inami, H., Sommovigo, L., et al. 2024, MNRAS, 527, 6867 [Google Scholar]
- Astropy Collaboration (Robitaille, T. P., et al.) 2013, A&A, 558, A33 [NASA ADS] [CrossRef] [EDP Sciences] [Google Scholar]
- Astropy Collaboration (Price-Whelan, A. M., et al.) 2018, AJ, 156, 123 [Google Scholar]
- Astropy Collaboration (Price-Whelan, A. M., et al.) 2022, ApJ, 935, 167 [NASA ADS] [CrossRef] [Google Scholar]
- Atek, H., Labbé, I., Furtak, L. J., et al. 2024, Nature, 626, 975 [NASA ADS] [CrossRef] [Google Scholar]
- Atek, H., Gavazzi, R., Weaver, J. R., et al. 2025, A&A, 697, A15 (Euclid on Sky SI) [NASA ADS] [CrossRef] [EDP Sciences] [Google Scholar]
- Bañados, E., Venemans, B. P., Mazzucchelli, C., et al. 2018, Nature, 553, 473 [Google Scholar]
- Barbary, K. 2016, J. Open Source Softw., 1, 58 [Google Scholar]
- Barrufet, L., Oesch, P., Marques-Chaves, R., et al. 2024, arXiv e-prints [arXiv:2404.08052] [Google Scholar]
- Behroozi, P., Wechsler, R. H., Hearin, A. P., & Conroy, C. 2019, MNRAS, 488, 3143 [NASA ADS] [CrossRef] [Google Scholar]
- Bertin, E., & Arnouts, S. 1996, A&AS, 117, 393 [NASA ADS] [CrossRef] [EDP Sciences] [Google Scholar]
- Bertin, E., Mellier, Y., Radovich, M., et al. 2002, in Astronomical Society of the Pacific Conference Series, 281, Astronomical Data Analysis Software and Systems XI, eds. D. A. Bohlender, D. Durand, & T. H. Handley, 228 [NASA ADS] [Google Scholar]
- Bouwens, R. J., Illingworth, G. D., Oesch, P. A., et al. 2015, ApJ, 811, 140 [NASA ADS] [CrossRef] [Google Scholar]
- Bouwens, R., Illingworth, G., Oesch, P., et al. 2023, MNRAS, 523, 1009 [NASA ADS] [CrossRef] [Google Scholar]
- Bowler, R. A. A., Dunlop, J. S., McLure, R. J., et al. 2012, MNRAS, 426, 2772 [NASA ADS] [CrossRef] [Google Scholar]
- Bowler, R. A. A., Dunlop, J. S., McLure, R. J., et al. 2014, MNRAS, 440, 2810 [NASA ADS] [CrossRef] [Google Scholar]
- Bowler, R. A. A., Dunlop, J. S., McLure, R. J., & McLeod, D. J. 2017, MNRAS, 466, 3612 [NASA ADS] [CrossRef] [Google Scholar]
- Bowler, R. A. A., Jarvis, M. J., Dunlop, J. S., et al. 2020, MNRAS, 493, 2059 [Google Scholar]
- Bowler, R. A. A., Inami, H., Sommovigo, L., et al. 2024, MNRAS, 527, 5808 [Google Scholar]
- Brammer, G. B., van Dokkum, P. G., & Coppi, P. 2008, ApJ, 686, 1503 [Google Scholar]
- Burgasser, A. J., McElwain, M. W., Kirkpatrick, J. D., et al. 2004, AJ, 127, 2856 [Google Scholar]
- Carnall, A. C., McLure, R. J., Dunlop, J. S., et al. 2023, Nature, 619, 716 [NASA ADS] [CrossRef] [Google Scholar]
- Chemerynska, I., Atek, H., Furtak, L. J., et al. 2023, arXiv e-prints [arXiv:2312.05030] [Google Scholar]
- Conroy, C., & Gunn, J. E. 2010, ApJ, 712, 833 [Google Scholar]
- Conroy, C., Gunn, J. E., & White, M. 2009, ApJ, 699, 486 [Google Scholar]
- Cuillandre, J.-C., Bertin, E., Bolzonella, M., et al. 2025, A&A, 697, A6 (Euclid on Sky SI) [Google Scholar]
- Damjanov, I., McCarthy, P. J., Abraham, R. G., et al. 2009, ApJ, 695, 101 [Google Scholar]
- Dayal, P., & Ferrara, A. 2018, Phys. Rep., 780, 1 [Google Scholar]
- Dayal, P., Volonteri, M., Greene, J. E., et al. 2024, A&A, submitted [arXiv:2401.11242] [Google Scholar]
- Donnan, C. T., McLeod, D. J., Dunlop, J. S., et al. 2023, MNRAS, 518, 6011 [Google Scholar]
- Donnan, C. T., McLure, R. J., Dunlop, J. S., et al. 2024, arXiv e-prints [arXiv:2403.03171] [Google Scholar]
- Drlica-Wagner, A., Sevilla-Noarbe, I., Rykoff, E. S., et al. 2018, ApJS, 235, 33 [Google Scholar]
- Duncan, K., Conselice, C. J., Mortlock, A., et al. 2014, MNRAS, 444, 2960 [Google Scholar]
- Endsley, R., Stark, D. P., Bouwens, R. J., et al. 2022, MNRAS, 517, 5642 [NASA ADS] [CrossRef] [Google Scholar]
- Endsley, R., Stark, D. P., Whitler, L., et al. 2023, MNRAS, 524, 2312 [NASA ADS] [CrossRef] [Google Scholar]
- Euclid Collaboration (Moneti, A., et al.) 2022, A&A, 658, A126 [NASA ADS] [CrossRef] [EDP Sciences] [Google Scholar]
- Euclid Collaboration (Scaramella, R., et al.) 2022, A&A, 662, A112 [NASA ADS] [CrossRef] [EDP Sciences] [Google Scholar]
- Euclid Collaboration (Schirmer, M., et al.) 2022, A&A, 662, A92 [NASA ADS] [CrossRef] [EDP Sciences] [Google Scholar]
- Euclid Collaboration (van Mierlo, S. E., et al.) 2022, A&A, 666, A200 [NASA ADS] [CrossRef] [EDP Sciences] [Google Scholar]
- Euclid Collaboration (McPartland, C. J. R., et al.) 2025, A&A, 695, A259 [Google Scholar]
- Euclid Collaboration (Zalesky, L., et al.) 2025, A&A, 695, A229 [Google Scholar]
- Euclid Collaboration (Cropper, M. S., et al.) 2025, A&A, 697, A2 (Euclid on Sky SI) [Google Scholar]
- Euclid Collaboration (Jahnke, K., et al.) 2025, A&A, 697, A3 (Euclid on Sky SI) [Google Scholar]
- Euclid Collaboration (Mellier, Y., et al.) 2025, A&A, 697, A1 (Euclid on Sky SI) [Google Scholar]
- Euclid Early Release Observations 2024, https://doi.org/10.57780/esa-qmocze3 [Google Scholar]
- Finkelstein, S. L., Ryan, Russell E., J., Papovich, C., et al. 2015, ApJ, 810, 71 [NASA ADS] [CrossRef] [Google Scholar]
- Finkelstein, S. L., D’Aloisio, A., Paardekooper, J.-P., et al. 2019, ApJ, 879, 36 [Google Scholar]
- Fitzpatrick, E. L., & Massa, D. 2007, ApJ, 663, 320 [Google Scholar]
- Franco, M., Elbaz, D., Béthermin, M., et al. 2018, A&A, 620, A152 [NASA ADS] [CrossRef] [EDP Sciences] [Google Scholar]
- Furtak, L. J., Labbé, I., Zitrin, A., et al. 2023, arXiv e-prints [arXiv:2308.05735] [Google Scholar]
- Glazebrook, K., Nanayakkara, T., Schreiber, C., et al. 2023, arXiv e-prints [arXiv:2308.05606] [Google Scholar]
- Gottumukkala, R., Barrufet, L., Oesch, P. A., et al. 2024, MNRAS, 530, 966 [NASA ADS] [CrossRef] [Google Scholar]
- Greene, J. E., Labbe, I., Goulding, A. D., et al. 2024, ApJ, 964, 39 [CrossRef] [Google Scholar]
- Harikane, Y., Ono, Y., Ouchi, M., et al. 2022, ApJS, 259, 20 [NASA ADS] [CrossRef] [Google Scholar]
- Harikane, Y., Ouchi, M., Oguri, M., et al. 2023, ApJS, 265, 5 [NASA ADS] [CrossRef] [Google Scholar]
- Hunter, J. D. 2007, Comput. Sci. Eng., 9, 90 [NASA ADS] [CrossRef] [Google Scholar]
- Jarvis, M. J., Bonfield, D. G., Bruce, V. A., et al. 2013, MNRAS, 428, 1281 [Google Scholar]
- Jiang, L., Ning, Y., Fan, X., & et al. 2022, Nat. Astron., 6, 850 [NASA ADS] [CrossRef] [Google Scholar]
- Johnson, B., Foreman-Mackey, D., Sick, J., et al. 2023, https://doi.org/10.5281/zenodo.10026684 [Google Scholar]
- Juodžbalis, I., Conselice, C. J., Singh, M., et al. 2023, MNRAS, 525, 1353 [CrossRef] [Google Scholar]
- Katgert, P., Mazure, A., Perea, J., et al. 1996, A&A, 310, 8 [NASA ADS] [Google Scholar]
- Kauffmann, O. B., Ilbert, O., Weaver, J. R., et al. 2022, A&A, 667, A65 [NASA ADS] [CrossRef] [EDP Sciences] [Google Scholar]
- Killi, M., Watson, D., Brammer, G., et al. 2024, A&A, 691, A52 [NASA ADS] [CrossRef] [EDP Sciences] [Google Scholar]
- Koekemoer, A. M., Faber, S. M., Ferguson, H. C., et al. 2011, ApJS, 197, 36 [NASA ADS] [CrossRef] [Google Scholar]
- Kokorev, V., Fujimoto, S., Labbe, I., et al. 2023, ApJ, 957, L7 [NASA ADS] [CrossRef] [Google Scholar]
- Lang, D., Hogg, D. W., & Mykytyn, D. 2016, Astrophysics Source Code Library [record ascl:1604.008] [Google Scholar]
- Laureijs, R., Amiaux, J., Arduini, S., et al. 2011, arXiv e-prints [arXiv:1110.3193] [Google Scholar]
- Leung, G. C. K., Bagley, M. B., Finkelstein, S. L., et al. 2023, ApJ, 954, L46 [NASA ADS] [CrossRef] [Google Scholar]
- Lu, T.-Y., Mason, C. A., Hutter, A., et al. 2024, MNRAS, 528, 4872 [CrossRef] [Google Scholar]
- Manning, S. M., Casey, C. M., Zavala, J. A., et al. 2022, ApJ, 925, 23 [CrossRef] [Google Scholar]
- Matsuoka, Y., Onoue, M., Iwasawa, K., et al. 2023, ApJ, 949, L42 [NASA ADS] [CrossRef] [Google Scholar]
- McCracken, H. J., Milvang-Jensen, B., Dunlop, J., et al. 2012, A&A, 544, A156 [NASA ADS] [CrossRef] [EDP Sciences] [Google Scholar]
- McKinney, J., Manning, S. M., Cooper, O. R., et al. 2023, ApJ, 956, 72 [Google Scholar]
- Naidu, R. P., Oesch, P. A., Setton, D. J., et al. 2022a, arXiv e-prints [arXiv:2208.02794] [Google Scholar]
- Naidu, R. P., Oesch, P. A., van Dokkum, P., et al. 2022b, ApJ, 940, L14 [NASA ADS] [CrossRef] [Google Scholar]
- Nelson, E. J., Suess, K. A., Bezanson, R., et al. 2023, ApJ, 948, L18 [NASA ADS] [CrossRef] [Google Scholar]
- Neyer, M., Smith, A., Kannan, R., et al. 2023, arXiv e-prints [arXiv:2310.03783] [Google Scholar]
- Oke, J. B. 1974, ApJS, 27, 21 [Google Scholar]
- Planck Collaboration XIII. 2016, A&A, 594, A13 [NASA ADS] [CrossRef] [EDP Sciences] [Google Scholar]
- Qin, Y., Duffy, A. R., Mutch, S. J., et al. 2019, MNRAS, 487, 1946 [Google Scholar]
- Roberts-Borsani, G., Treu, T., Chen, W., et al. 2023, Nature, 618, 480 [NASA ADS] [CrossRef] [Google Scholar]
- Ryan, R. E., Thorman, P., Aganze, C., et al. 2022, ApJ, 932, 96 [NASA ADS] [CrossRef] [Google Scholar]
- Schindler, J.-T., Bañados, E., Connor, T., et al. 2023, ApJ, 943, 67 [NASA ADS] [CrossRef] [Google Scholar]
- Schlafly, E. F., & Finkbeiner, D. P. 2011, ApJ, 737, 103 [Google Scholar]
- Schouws, S., Bouwens, R., Smit, R., et al. 2023, ApJ, 954, 103 [NASA ADS] [CrossRef] [Google Scholar]
- Sohn, J., Fabricant, D. G., Geller, M. J., Hwang, H. S., & Diaferio, A. 2020, ApJ, 902, 17 [Google Scholar]
- Trac, H., Cen, R., & Mansfield, P. 2015, ApJ, 813, 54 [Google Scholar]
- van Dokkum, P. G., Franx, M., Kriek, M., et al. 2008, ApJ, 677, L5 [Google Scholar]
- Varadaraj, R. G., Bowler, R. A. A., Jarvis, M. J., Adams, N. J., & Häußler, B. 2023, MNRAS, 524, 4586 [Google Scholar]
- Wang, T., Elbaz, D., Schreiber, C., et al. 2016, ApJ, 816, 84 [Google Scholar]
- Wang, T., Schreiber, C., Elbaz, D., et al. 2019, Nature, 572, 211 [Google Scholar]
- Wang, T., Sun, H., Zhou, L., et al. 2024, arXiv e-prints [arXiv:2403.02399] [Google Scholar]
- Weaver, J. R., Davidzon, I., Toft, S., et al. 2023a, A&A, 677, A184 [NASA ADS] [CrossRef] [EDP Sciences] [Google Scholar]
- Weaver, J. R., Zalesky, L., Kokorev, V., et al. 2023b, ApJS, 269, 20 [NASA ADS] [CrossRef] [Google Scholar]
- Weaver, J. R., Cutler, S. E., Pan, R., et al. 2024, ApJS, 270, 7 [NASA ADS] [CrossRef] [Google Scholar]
- White, S. D. M., & Frenk, C. S. 1991, ApJ, 379, 52 [Google Scholar]
- Williams, C. C., Alberts, S., Ji, Z., et al. 2023, arXiv e-prints [arXiv:2311.07483] [Google Scholar]
- Zavala, J. A., Casey, C. M., Manning, S. M., et al. 2021, ApJ, 909, 165 [CrossRef] [Google Scholar]
- Zavala, J. A., Buat, V., Casey, C. M., et al. 2023, ApJ, 943, L9 [NASA ADS] [CrossRef] [Google Scholar]
Confirming these sources is difficult because HST coverage of Abell 2390 is limited to the very core where no LBG or ERO source is found. Further, no ancillary HST or Spitzer data exist for Abell 2764.
All Figures
|
Fig. 1 Summary of Euclid’s ability to identify bright MUV < −22 LBGs detectable only in NISP (or VIS/IE dropout) from the ERO data of Abell 2764 and Abell 2390. Model spectra of an LBG at z = 7, 8, and 9 are generated with python-FSPS. Euclid IE, YE, JE, and HE transmission curves are normalised such that their peak coincides with the selection function adopted in this work. |
| In the text | |
|
Fig. 2 Selection and properties of 168 NISP-only sources in Abell 2390 and Abell 2764. Sources are divided into Lyman-break galaxy (LBG) candidates and extremely red sources (ERSs). Panel A: IE − YE versus JE − HE colour-colour diagram highlighting the significance of the VIS non-detection (1.5σ lower limits) and general colours of the sources. Panel B: YE − JE versus JE − HE colour-colour diagram separating the two samples. Also shown is a reddening vector as well as tracks of z = 6–9 LBGs with different mean stellar ages (grey) and of z = 1–3 maximally old quiescent galaxies (maroon). Colours of observed M-, L-, and T-type dwarf stars are measured from the SpeX Prism Library (Burgasser et al. 2004). Typical colour uncertainties are shown in the upper two panels, where all IE − YE colours are lower limits. |
| In the text | |
|
Fig. 3 HE brightness versus compactness estimated from a flux ratio in 2″.0 to 1″.5 apertures. Selected sources are required to be relatively compact with an aperture ratio below 1.2. The HE compactness of genuine point sources identified in IE from the parent catalogue is shown by the grey 2D histogram. Sources below a ratio of 1.0 are visually confirmed to have significantly negative pixels nearby. |
| In the text | |
|
Fig. 4 Two extremely red sources showing their photometry, best-fit templates and bimodal ℒ(z) from eazy-py, cutouts, and light curves. The false colour image is composed from YE, JE, and HE and the cutouts are scaled linearly such that they saturate at ±3σ. Upper limits for IE are shown by the leftmost grey bar with an arrow, while selection limits for NISP bands are shown as grey bars. |
| In the text | |
|
Fig. 5 Two bright Lyman-break galaxy candidates: their photometry, best-fit templates and uniquely high-z ℒ(z) from eazy-py, cutouts, and lightcurves. The false colour image is composed of YE, JE, and HE and the cutouts are scaled linearly such that they saturate at ±3σ. Upper limits for IE are shown by the leftmost grey bar with an arrow, while selection limits for NISP bands are shown by the grey bars. |
| In the text | |
|
Fig. 6 Models of a MUV ≈ −22 AB galaxy at z = 7, 8, and 9 assuming three different morphologies: a point source; a 1.5 kpc disc; and a three-point-source clump of similar effective size simulated with The Tractor (Lang et al. 2016) and injected into a small empty region of the JE mosaic at native 0″.3 pix−1 scale. |
| In the text | |
|
Fig. 7 The number density of selected LBG candidates in Abell 2390 (orange diamonds) and Abell 2764 (purple diamons) compared to a range of T-type dwarf stars (700–1300 K) number densities at the Galactic latitudes of each field. Dwarf sky densities are highly uncertain and are estimated assuming a Solar position of 27 pc above the Galactic plane, an exponential radial scale height of 2250 pc with a vertical scale length of 300 pc (Ryan et al. 2022). See Wood et al. (in prep.) for details. |
| In the text | |
|
Fig. 8 Example of a suspected persistence signal appearing as a particularly UV-bright object. Time-series analysis of its frame-by-frame photometry reveals a potentially decaying signal suggestive of persistence. |
| In the text | |
|
Fig. B.1 Cutouts of z ≈ 6–8 Lyman-break candidates. Leftmost false-colour RBG images are constructed from NISP/YE, Je, He. Others show VIS/IE, NISP/YE, JE, He, and the NISP detection stack, scaled to ±3σ to emphasise the significance of the detections. Cutouts are 5″along a side. |
| In the text | |
|
Fig. B.2 Cutouts of extremely red sources. Leftmost false-colour RBG images are constructed from NISP/YE, JE, HE. Others show VIS/IE, NISP/YE, JE, HE, and the NISP detection stack, scaled to ±3σ to emphasise the significance of the detections. Cutouts are 5″along a side. |
| In the text | |
Current usage metrics show cumulative count of Article Views (full-text article views including HTML views, PDF and ePub downloads, according to the available data) and Abstracts Views on Vision4Press platform.
Data correspond to usage on the plateform after 2015. The current usage metrics is available 48-96 hours after online publication and is updated daily on week days.
Initial download of the metrics may take a while.