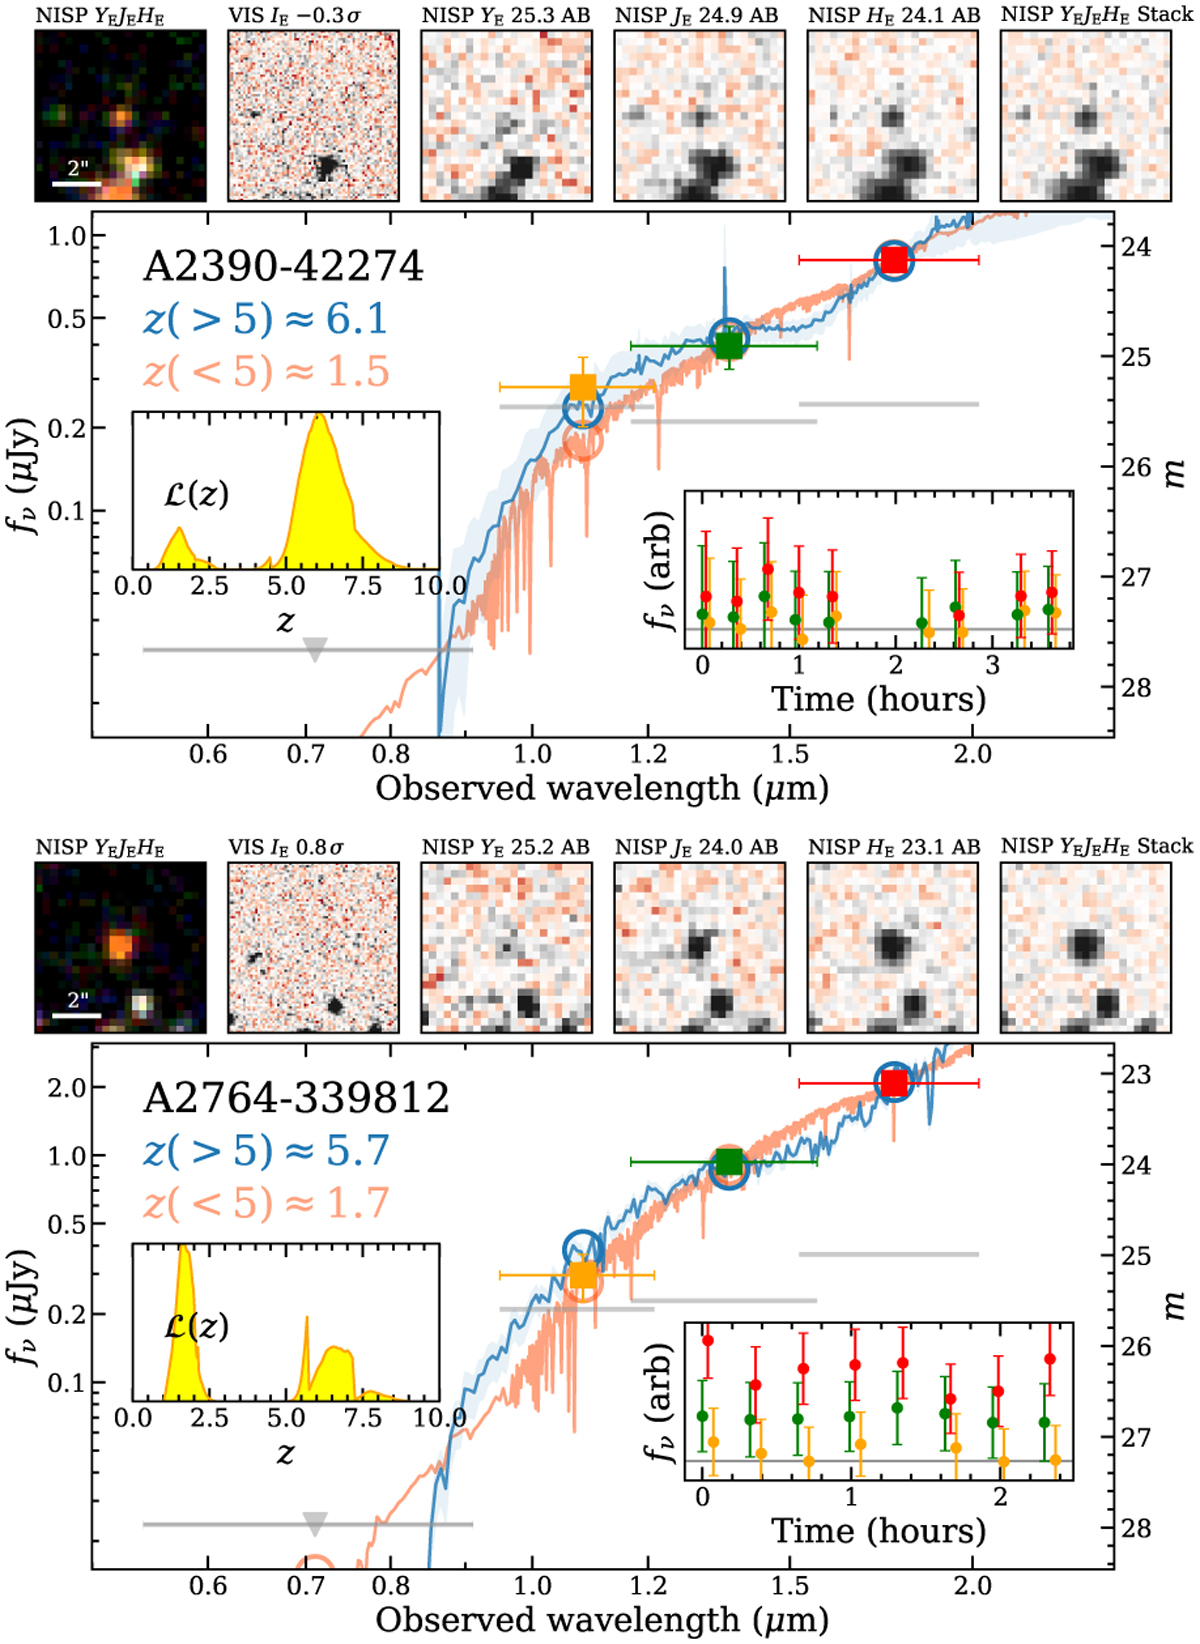
Fig. 4
Download original image
Two extremely red sources showing their photometry, best-fit templates and bimodal ℒ(z) from eazy-py, cutouts, and light curves. The false colour image is composed from YE, JE, and HE and the cutouts are scaled linearly such that they saturate at ±3σ. Upper limits for IE are shown by the leftmost grey bar with an arrow, while selection limits for NISP bands are shown as grey bars.
Current usage metrics show cumulative count of Article Views (full-text article views including HTML views, PDF and ePub downloads, according to the available data) and Abstracts Views on Vision4Press platform.
Data correspond to usage on the plateform after 2015. The current usage metrics is available 48-96 hours after online publication and is updated daily on week days.
Initial download of the metrics may take a while.