| Issue |
A&A
Volume 695, March 2025
|
|
|---|---|---|
| Article Number | A229 | |
| Number of page(s) | 27 | |
| Section | Catalogs and data | |
| DOI | https://doi.org/10.1051/0004-6361/202451857 | |
| Published online | 21 March 2025 | |
Euclid preparation
LXI. Cosmic Dawn Survey: ‘Pre-launch’ multiwavelength catalogues for Euclid Deep Field North and Euclid Deep Field Fornax
1
Institute for Astronomy, University of Hawaii,
2680 Woodlawn Drive,
Honolulu,
HI
96822, USA
2
Cosmic Dawn Center (DAWN),
Rådmandsgade 64,
2200
København N, Denmark
3
Niels Bohr Institute, University of Copenhagen,
Jagtvej 128,
2200
Copenhagen, Denmark
4
Physics and Astronomy Department, University of California,
900 University Ave.,
Riverside,
CA
92521, USA
5
Department of Astronomy, University of Massachusetts,
Amherst,
MA
01003, USA
6
Lawrence Berkeley National Laboratory,
One Cyclotron Road,
Berkeley,
CA
94720, USA
7
Carnegie Observatories,
Pasadena,
CA
91101, USA
8
The University of Texas at Austin,
Austin,
TX,
78712,
USA
9
NRC Herzberg,
5071 West Saanich Rd,
Victoria,
BC
V9E 2E7, Canada
10
Department of Astronomy & Physics and Institute for Computational Astrophysics, Saint Mary’s University,
923 Robie Street,
Halifax,
Nova Scotia,
B3H 3C3,
Canada
11
Institut d’Astrophysique de Paris, UMR 7095, CNRS, and Sorbonne Université,
98 bis boulevard Arago,
75014
Paris,
France
12
Jet Propulsion Laboratory, California Institute of Technology,
4800 Oak Grove Drive,
Pasadena,
CA,
91109,
USA
13
Instituto de Astrofísica de Canarias (IAC); Departamento de Astrofísica, Universidad de La Laguna (ULL),
38200
La Laguna,
Tenerife,
Spain
14
ESAC/ESA, Camino Bajo del Castillo, s/n., Urb. Villafranca del Castillo,
28692
Villanueva de la Cañada,
Madrid,
Spain
15
INAF-Osservatorio Astronomico di Brera,
Via Brera 28,
20122
Milano, Italy
16
INAF-Osservatorio di Astrofisica e Scienza dello Spazio di Bologna,
Via Piero Gobetti 93/3,
40129
Bologna, Italy
17
IFPU, Institute for Fundamental Physics of the Universe,
via Beirut 2,
34151
Trieste, Italy
18
INAF-Osservatorio Astronomico di Trieste,
Via G. B. Tiepolo 11,
34143
Trieste, Italy
19
INFN, Sezione di Trieste,
Via Valerio 2,
34127
Trieste TS, Italy
20
SISSA, International School for Advanced Studies,
Via Bonomea 265,
34136
Trieste TS, Italy
21
Dipartimento di Fisica e Astronomia, Università di Bologna,
Via Gobetti 93/2,
40129
Bologna, Italy
22
INFN-Sezione di Bologna,
Viale Berti Pichat 6/2,
40127
Bologna, Italy
23
Max Planck Institute for Extraterrestrial Physics,
Giessenbachstr. 1,
85748
Garching, Germany
24
Universitäts-Sternwarte München, Fakultät für Physik, Ludwig-Maximilians-Universität München,
Scheinerstrasse 1,
81679
München, Germany
25
INAF-Osservatorio Astrofisico di Torino,
Via Osservatorio 20,
10025
Pino Torinese (TO), Italy
26
Dipartimento di Fisica, Università di Genova,
Via Dodecaneso 33,
16146
Genova, Italy
27
INFN-Sezione di Genova,
Via Dodecaneso 33,
16146
Genova, Italy
28
Department of Physics “E. Pancini”, University Federico II,
Via Cinthia 6,
80126
Napoli, Italy
29
INAF-Osservatorio Astronomico di Capodimonte,
Via Moiariello 16,
80131
Napoli, Italy
30
INFN section of Naples,
Via Cinthia 6,
80126
Napoli, Italy
31
Instituto de Astrofísica e Ciências do Espaço, Universidade do Porto, CAUP, Rua das Estrelas,
PT4150-762
Porto, Portugal
32
Dipartimento di Fisica, Università degli Studi di Torino,
Via P. Giuria 1,
10125
Torino, Italy
33
INFN-Sezione di Torino,
Via P. Giuria 1,
10125
Torino, Italy
34
INAF-IASF Milano,
Via Alfonso Corti 12,
20133
Milano, Italy
35
Centro de Investigaciones Energéticas, Medioambientales y Tecnológicas (CIEMAT),
Avenida Complutense 40,
28040
Madrid, Spain
36
Port d’Informació Científica, Campus UAB,
C. Albareda s/n,
08193
Bellaterra (Barcelona), Spain
37
Institute for Theoretical Particle Physics and Cosmology (TTK), RWTH Aachen University,
52056 Aachen,
Germany
38
Institute of Space Sciences (ICE, CSIC), Campus UAB,
Carrer de Can Magrans, s/n,
08193
Barcelona,
Spain
39
Institut d’Estudis Espacials de Catalunya (IEEC), Edifici RDIT, Campus UPC,
08860
Castelldefels, Barcelona,
Spain
40
INAF-Osservatorio Astronomico di Roma,
Via Frascati 33,
00078
Monteporzio Catone, Italy
41
Dipartimento di Fisica e Astronomia “Augusto Righi” - Alma Mater Studiorum Università di Bologna,
Viale Berti Pichat 6/2,
40127
Bologna, Italy
42
Instituto de Astrofísica de Canarias,
Calle Vía Láctea s/n,
38204,
San Cristóbal de La Laguna, Tenerife,
Spain
43
Institute for Astronomy, University of Edinburgh, Royal Observatory, Blackford Hill,
Edinburgh
EH9 3HJ, UK
44
Jodrell Bank Centre for Astrophysics, Department of Physics and Astronomy, University of Manchester,
Oxford Road,
Manchester
M13 9PL, UK
45
European Space Agency/ESRIN,
Largo Galileo Galilei 1,
00044
Frascati, Roma,
Italy
46
Université Claude Bernard Lyon 1, CNRS/IN2P3, IP2I Lyon, UMR 5822,
Villeurbanne,
69100
France
47
Institute of Physics, Laboratory of Astrophysics, Ecole Polytechnique Fédérale de Lausanne (EPFL), Observatoire de Sauverny,
1290
Versoix,
Switzerland
48
UCB Lyon 1, CNRS/IN2P3, IUF, IP2I Lyon,
4 rue Enrico Fermi,
69622
Villeurbanne,
France
49
Departamento de Física, Faculdade de Ciências, Universidade de Lisboa,
Edifício C8, Campo Grande,
PT1749-016
Lisboa, Portugal
50
Instituto de Astrofísica e Ciências do Espaço, Faculdade de Ciências, Universidade de Lisboa,
Campo Grande,
1749-016
Lisboa, Portugal
51
Department of Astronomy, University of Geneva,
ch. d’Ecogia 16,
1290
Versoix, Switzerland
52
INAF-Istituto di Astrofisica e Planetologia Spaziali,
via del Fosso del Cavaliere, 100,
00100
Roma, Italy
53
Department of Physics, Oxford University,
Keble Road,
Oxford
OX1 3RH, UK
54
INFN-Padova,
Via Marzolo 8,
35131
Padova, Italy
55
Université Paris-Saclay, Université Paris Cité, CEA, CNRS, AIM,
91191
Gif-sur-Yvette, France
56
School of Physics, HH Wills Physics Laboratory, University of Bristol,
Tyndall Avenue,
Bristol,
BS8 1TL,
UK
57
Aix-Marseille Université, CNRS/IN2P3, CPPM,
Marseille,
France
58
Istituto Nazionale di Fisica Nucleare, Sezione di Bologna,
Via Irnerio 46,
40126
Bologna, Italy
59
FRACTAL S.L.N.E.,
calle Tulipán 2, Portal 13 1A,
28231,
Las Rozas de Madrid, Spain
60
INAF-Osservatorio Astronomico di Padova,
Via dell’Osservatorio 5,
35122
Padova, Italy
61
Institute of Theoretical Astrophysics, University of Oslo,
PO Box 1029 Blindern,
0315
Oslo,
Norway
62
Leiden Observatory, Leiden University,
Einsteinweg 55,
2333
CC Leiden, The Netherlands
63
Department of Physics, Lancaster University,
Lancaster,
LA1 4YB,
UK
64
Felix Hormuth Engineering,
Goethestr. 17,
69181
Leimen, Germany
65
Technical University of Denmark,
Elektrovej 327,
2800 Kgs.
Lyngby, Denmark
66
Max-Planck-Institut für Astronomie,
Königstuhl 17,
69117
Heidelberg, Germany
67
Department of Physics and Astronomy, University College London,
Gower Street,
London
WC1E 6BT, UK
68
Department of Physics and Helsinki Institute of Physics,
Gustaf Hällströmin katu 2, 00014 University of Helsinki,
Finland
69
Université de Genève, Département de Physique Théorique and Centre for Astroparticle Physics,
24 quai Ernest-Ansermet,
1211
Genève 4, Switzerland
70
Department of Physics,
P.O. Box 64, 00014 University of Helsinki,
Finland
71
Helsinki Institute of Physics,
Gustaf Hällströmin katu 2, University of Helsinki,
Helsinki,
Finland
72
European Space Agency/ESTEC,
Keplerlaan 1,
2201
AZ Noordwijk, The Netherlands
73
NOVA optical infrared instrumentation group at ASTRON,
Oude Hoogeveensedijk 4,
7991PD
Dwingeloo,
The Netherlands
74
Centre de Calcul de 1’IN2P3/CNRS,
21 avenue Pierre de Coubertin
69627
Villeurbanne Cedex, France
75
Dipartimento di Fisica “Aldo Pontremoli”, Università degli Studi di Milano,
Via Celoria 16,
20133
Milano, Italy
76
INFN-Sezione di Milano,
Via Celoria 16,
20133
Milano, Italy
77
Universität Bonn, Argelander-Institut für Astronomie,
Auf dem Hügel 71,
53121
Bonn, Germany
78
INFN-Sezione di Roma, Piazzale Aldo Moro,
2 - c/o Dipartimento di Fisica, Edificio G. Marconi,
00185
Roma,
Italy
79
Aix-Marseille Université, CNRS, CNES, LAM,
Marseille,
France
80
Dipartimento di Fisica e Astronomia “Augusto Righi” - Alma Mater Studiorum Università di Bologna,
via Piero Gobetti 93/2,
40129
Bologna, Italy
81
Department of Physics, Institute for Computational Cosmology, Durham University,
South Road,
DH1 3LE,
UK
82
Université Côte d’Azur, Observatoire de la Côte d’Azur, CNRS, Laboratoire Lagrange,
Bd de l’Observatoire, CS 34229,
06304
Nice Cedex 4, France
83
Université Paris Cité, CNRS,
Astroparticule et Cosmologie,
75013
Paris,
France
84
Institut d’Astrophysique de Paris,
98bis Boulevard Arago,
75014
Paris,
France
85
Institut de Física d’Altes Energies (IFAE), The Barcelona Institute of Science and Technology,
Campus UAB,
08193
Bellaterra (Barcelona), Spain
86
School of Mathematics, Statistics and Physics, Newcastle University, Herschel Building,
Newcastle-upon-Tyne,
NE1 7RU,
UK
87
Department of Physics and Astronomy, University of Aarhus,
Ny Munkegade 120,
8000
Aarhus C, Denmark
88
Waterloo Centre for Astrophysics, University of Waterloo,
Waterloo,
Ontario
N2L 3G1, Canada
89
Department of Physics and Astronomy, University of Waterloo,
Waterloo,
Ontario
N2L 3G1, Canada
90
Perimeter Institute for Theoretical Physics,
Waterloo,
Ontario
N2L 2Y5, Canada
91
Space Science Data Center, Italian Space Agency,
via del Politecnico snc,
00133
Roma,
Italy
92
Centre National d’Etudes Spatiales – Centre spatial de Toulouse,
18 avenue Edouard Belin,
31401
Toulouse Cedex 9, France
93
Institute of Space Science,
Str. Atomistilor, nr. 409 Măgurele,
Ilfov,
077125,
Romania
94
Departamento de Astrofísica, Universidad de La Laguna,
38206,
La Laguna,
Tenerife, Spain
95
Dipartimento di Fisica e Astronomia “G. Galilei”, Università di Padova,
Via Marzolo 8,
35131
Padova, Italy
96
Institut für Theoretische Physik, University of Heidelberg,
Philosophenweg 16,
69120
Heidelberg, Germany
97
Institut de Recherche en Astrophysique et Planétologie (IRAP), Université de Toulouse, CNRS, UPS, CNES,
14 Av. Edouard Belin,
31400
Toulouse,
France
98
Université St Joseph; Faculty of Sciences,
Beirut,
Lebanon
99
Departamento de Física, FCFM, Universidad de Chile,
Blanco Encalada 2008,
Santiago,
Chile
100
Universität Innsbruck, Institut für Astro- und Teilchenphysik,
Technikerstr. 25/8,
6020
Innsbruck, Austria
101
Satlantis, University Science Park,
Sede Bld
48940,
Leioa-Bilbao, Spain
102
Infrared Processing and Analysis Center, California Institute of Technology,
Pasadena,
CA
91125, USA
103
Instituto de Astrofísica e Ciências do Espaço, Faculdade de Ciências, Universidade de Lisboa,
Tapada da Ajuda,
1349-018
Lisboa, Portugal
104
Universidad Politécnica de Cartagena, Departamento de Electrónica y Tecnología de Computadoras,
Plaza del Hospital 1,
30202
Cartagena, Spain
105
Kapteyn Astronomical Institute, University of Groningen,
PO Box 800,
9700
AV Groningen, The Netherlands
106
INFN-Bologna,
Via Irnerio 46,
40126
Bologna, Italy
107
INAF, Istituto di Radioastronomia,
Via Piero Gobetti 101,
40129
Bologna, Italy
108
Department of Mathematics and Physics E. De Giorgi, University of Salento,
Via per Arnesano, CP-I93,
73100
Lecce, Italy
109
INAF-Sezione di Lecce, c/o Dipartimento Matematica e Fisica, Via per Arnesano,
73100 Lecce,
Italy
110
INFN, Sezione di Lecce, Via per Arnesano,
CP-193,
73100
Lecce, Italy
111
Junia, EPA department,
41 Bd Vauban,
59800
Lille,
France
112
ICSC - Centro Nazionale di Ricerca in High Performance Computing, Big Data e Quantum Computing,
Via Magnanelli 2,
Bologna,
Italy
113
Instituto de Física Teórica UAM-CSIC,
Campus de Cantoblanco,
28049
Madrid,
Spain
114
CERCA/ISO, Department of Physics, Case Western Reserve University,
10900 Euclid Avenue,
Cleveland,
OH
44106, USA
115
Laboratoire Univers et Théorie, Observatoire de Paris, Université PSL, Université Paris Cité, CNRS,
92190
Meudon,
France
116
Dipartimento di Fisica e Scienze della Terra, Università degli Studi di Ferrara,
Via Giuseppe Saragat 1,
44122
Ferrara, Italy
117
Istituto Nazionale di Fisica Nucleare, Sezione di Ferrara,
Via Giuseppe Saragat 1,
44122
Ferrara, Italy
118
Université de Strasbourg, CNRS, Observatoire astronomique de Strasbourg,
UMR 7550,
67000
Strasbourg, France
119
Kavli Institute for the Physics and Mathematics of the Universe (WPI), University of Tokyo, Kashiwa,
Chiba
277-8583,
Japan
120
Dipartimento di Fisica - Sezione di Astronomia, Università di Trieste,
Via Tiepolo 11,
34131
Trieste, Italy
121
Minnesota Institute for Astrophysics, University of Minnesota,
116 Church St SE,
Minneapolis,
MN
55455, USA
122
Department of Physics & Astronomy, University of California Irvine,
Irvine
CA
92697, USA
123
Departamento Física Aplicada, Universidad Politécnica de Cartagena,
Campus Muralla del Mar,
30202
Cartagena, Murcia,
Spain
124
Université Paris-Saclay, CNRS, Institut d’astrophysique spatiale,
91405
Orsay,
France
125
Institute of Cosmology and Gravitation, University of Portsmouth,
Portsmouth
PO1 3FX, UK
126
Department of Computer Science, Aalto University,
PO Box 15400,
Espoo
00076,
Finland
127
Ruhr University Bochum, Faculty of Physics and Astronomy, Astronomical Institute (AIRUB), German Centre for Cosmological Lensing (GCCL),
44780
Bochum,
Germany
128
DARK, Niels Bohr Institute, University of Copenhagen,
Jagtvej 155,
2200
Copenhagen, Denmark
129
Université PSL, Observatoire de Paris, Sorbonne Université, CNRS, LERMA,
75014
Paris,
France
130
Université Paris-Cité,
5 Rue Thomas Mann,
75013
Paris,
France
131
Univ. Grenoble Alpes, CNRS, Grenoble INP, LPSC-IN2P3,
53, Avenue des Martyrs,
38000
Grenoble,
France
132
Department of Physics and Astronomy,
Vesilinnantie 5, 20014 University of Turku,
20014
Turku,
Finland
133
Serco for European Space Agency (ESA), Camino bajo del Castillo, s/n, Urbanizacion Villafranca del Castillo, Villanueva de la Cañada,
28692
Madrid,
Spain
134
ARC Centre of Excellence for Dark Matter Particle Physics,
Melbourne,
Australia
135
Centre for Astrophysics & Supercomputing, Swinburne University of Technology, Hawthorn,
Victoria
3122, Australia
136
School of Physics and Astronomy, Queen Mary University of London,
Mile End Road,
London
E1 4NS, UK
137
Department of Physics and Astronomy, University of the Western Cape, Bellville,
Cape
Town 7535, South Africa
138
ICTP South American Institute for Fundamental Research, Instituto de Física Teórica, Universidade Estadual Paulista,
São Paulo,
Brazil
139
Oskar Klein Centre for Cosmoparticle Physics, Department of Physics, Stockholm University,
Stockholm
106 91, Sweden
140
Astrophysics Group, Blackett Laboratory, Imperial College London,
London
SW7 2AZ, UK
141
INAF-Osservatorio Astrofisico di Arcetri,
Largo E. Fermi 5,
50125
Firenze, Italy
142
Dipartimento di Fisica, Sapienza Università di Roma,
Piazzale Aldo Moro 2,
00185
Roma, Italy
143
Centro de Astrofísica da Universidade do Porto, Rua das Estrelas,
4150-762
Porto, Portugal
144
Institute of Astronomy, University of Cambridge,
Madingley Road,
Cambridge
CB3 0HA, UK
145
Department of Astrophysics, University of Zurich,
Winterthurerstrasse 190,
8057
Zurich, Switzerland
146
Dipartimento di Fisica, Università degli studi di Genova, and INFN-Sezione di Genova,
via Dodecaneso 33,
16146
Genova, Italy
147
Theoretical astrophysics, Department of Physics and Astronomy, Uppsala University,
Box 515,
751 20
Uppsala, Sweden
148
Institute Lorentz, Leiden University,
Niels Bohrweg 2,
2333
CA Leiden, The Netherlands
149
Department of Physics, Royal Holloway, University of London,
TW20 0EX,
UK
150
Mullard Space Science Laboratory, University College London, Holmbury St Mary, Dorking,
Surrey
RH5 6NT, UK
151
Department of Physics and Astronomy, University of California,
Davis,
CA
95616, USA
152
Department of Astrophysical Sciences, Peyton Hall, Princeton University,
Princeton,
NJ
08544, USA
153
Center for Cosmology and Particle Physics, Department of Physics, New York University,
New York,
NY
10003, USA
154
Center for Computational Astrophysics, Flatiron Institute,
162 5th Avenue,
10010,
New York,
NY, USA
★ Corresponding author; This email address is being protected from spambots. You need JavaScript enabled to view it.
Received:
10
August
2024
Accepted:
1
December
2024
Abstract
The Cosmic Dawn Survey (DAWN survey) provides multiwavelength (UV/optical to mid-IR) data across the combined 59 deg2 of the Euclid Deep and Auxiliary fields (EDFs and EAFs). In this work, the first public data release from the DAWN survey is presented. The catalogues made available herein consist of a subset of the full DAWN survey that includes two EDFs: EDF North (EDF-N) and EDF Fornax (EDF-F). Each field has been covered by the ongoing Hawaii Twenty Square Degree Survey (H20), which includes imaging from the CFHT MegaCam in the u filter and from the Subaru Hyper Suprime-Cam (HSC) in the griz filters. Each field has been further covered by Spitzer/IRAC 3.6–4.5µm imaging spanning 10 deg2 and reaching ~25 mag AB (5σ). All present H20 imaging and all publicly available imaging from the aforementioned facilities were combined with the deep Spitzer/IRAC data to create source catalogues spanning a total area of 16.87 deg2 in EDF-N and 2.85 deg2 in EDF-F for this first release. These catalogues are referred to as the ‘pre-launch’ (PL), as Euclid data is not yet public for these fields and therefore it is not included. Photometry was measured from these multiwavelength data using The Farmer, a novel and well validated model-based photometry code. Photometric redshifts and stellar masses were computed using two independent codes for modelling spectral energy distributions: EAZY and LePhare. Photometric redshifts show good agreement with spectroscopic redshifts (σNMAD ~ 0.5, η < 8% at i < 25). Number counts, photometric redshifts and stellar masses were further validated in comparison to the COSMOS2020 catalogue. The DAWN survey PL catalogues are designed to be of immediate use in these two EDFs and will be continuously updated and made available as both new ground-based data and spaced-based data from Euclid are acquired and made public. Future data releases will provide catalogues of all EDFs and EAFs and include Euclid data.
Key words: editorials, notices / miscellaneous / catalogs / surveys / galaxies: general
© The Authors 2025
 Open Access article, published by EDP Sciences, under the terms of the Creative Commons Attribution License (https://creativecommons.org/licenses/by/4.0), which permits unrestricted use, distribution, and reproduction in any medium, provided the original work is properly cited.
This article is published in open access under the Subscribe to Open model. This email address is being protected from spambots. You need JavaScript enabled to view it. to support open access publication.
1 Introduction
The Euclid mission (Laureijs et al. 2011; Euclid Collaboration: Mellier et al. 2025) has the potential to revolutionise cosmology through its survey of 14 000 deg2 of the extragalactic sky. Imaging in optical and near-infrared wavelengths will be obtained by Euclid for billions of galaxies, in addition to spectroscopy for roughly 50 million galaxies (Euclid Collaboration: Scaramella et al. 2022). The primary science objectives of Euclid are to constrain the properties of dark matter and dark energy through weak lensing and galaxy-clustering measurements. The Euclid Wide Survey (EWS) will reach an expected (5σ) limiting magnitude of 24.3 mag (AB) for point sources in the near-infrared imaging. At these depths, Euclid will primarily probe the low-redshift (z < 2) Universe.
Over the expected six years of the Euclid mission, roughly 20% of Euclid observation time will also be devoted to targeting six Euclid Auxiliary fields (EAFs) and three Euclid Deep Fields (EDFs). The EAFs and EDFs serve the mission in different ways. The EAFs comprise six extensively studied fields of scale 0.5–2 deg2, including CDFS, COSMOS-Wide, SXDS, VVDS, AEGIS, and GOODS-N (see Euclid Collaboration: Scaramella et al. 2022 and Euclid Collaboration: McPartland et al. 2025 for details). The auxiliary fields support photometric redshift and colour-gradient calibration and host extensive spectroscopic samples of galaxies. The EDFs comprise three fields easily accessible year round, given Euclid’s orbit, and include Euclid Deep Field North (EDF-N; 20 deg2), Euclid Deep Field Fornax (EDF-F; 10 deg2), and Euclid Deep Field South (EDF-S; 23 deg2). The deep fields assist in characterising the galaxy population of the wide survey, calibrating the noise-bias for weak lensing analyses, and quantifying completeness and purity (in EDF-N and EDF-S, specifically) for the EWS spectroscopic observations. The resulting Euclid data in the EAFs and EDFs will be between four and eight times deeper than the EWS data. Accordingly, the deep Euclid data in the EAFs and EDFs enable tremendous legacy science at high redshift while simultaneously supporting the EWS.
The primary Euclid science objectives, including weak lensing and galaxy clustering analyses, as well as legacy science endeavours, require supplemental ground-based data to establish quality photometric redshifts and calibrate colour gradients affecting chromatic (i.e. wavelength-dependent) point-spread functions (Laureijs et al. 2011; Euclid Collaboration: Scaramella et al. 2022). Furthermore, the intrinsic properties of galaxies, such as stellar mass and star-formation rate, cannot be fully studied with the Euclid data alone. Emission of star-forming galaxies at low redshift are dominant in wavelengths shorter than those covered by Euclid. In addition, with increasing distance, significant spectral features, especially in rest-frame optical light, are shifted towards wavelengths longer than those covered by Euclid. Ultimately, complementary depth-matched imaging and self-consistent photometry in the UV/optical and mid-infrared are important additions to the Euclid data in order to constrain the full detailed shapes of galaxy spectral energy distributions (SEDs). In the Euclid Deep and Auxiliary Fields, these data are provided by the Cosmic Dawn Survey (DAWN survey; Euclid Collaboration: McPartland et al. 2025). The DAWN survey is a 59 deg2 multiwavelength survey of the EAFs and EDFs. The DAWN survey catalogues are complementary to the official Euclid survey catalogues and are primarily distinguished from the official Euclid survey catalogues by wavelength coverage. The DAWN survey catalogues include deep Spitzer/IRAC imaging and photometry measured self-consistently via a modelbased method described in greater detail below. Accordingly, the DAWN catalogues are optimised for galaxy evolution science beyond redshifts z > 4, where the Spitzer/IRAC photometry probes rest-frame optical emission. In this paper, the first public release of catalogues from the DAWN survey is presented, consisting entirely of pre-launch (PL) data. Future DAWN data releases (including EDF-S and the EAFs) will follow each of the Euclid data releases. The reader is referred to Euclid Collaboration: McPartland et al. (2025) for a description of the fields, observations, and science goals of the DAWN survey.
The PL catalogues from the DAWN survey provide multi-wavelength photometry and galaxy properties across two EDFs, EDF-N and EDF-F. The DAWN survey PL catalogues do not yet include Euclid data for these fields, as they are still being acquired. However, future data releases will provide catalogues that include Euclid photometry for all Euclid Deep Fields, including Euclid Deep Field South, and the EAFs. As described by Euclid Collaboration: McPartland et al. (2025), the DAWN survey incorporates UV/optical imaging from multiple ground-based surveys and mid-infrared imaging from the Spitzer to complement and support the EDFs and EAFs. Across EDF-N and EDF-F, UV and optical coverage is provided by the Hawaii Twenty Square Degree Survey (H20). H20 utilises the MegaCam instrument on the Canada-France-Hawaii Telescope (CFHT) and the Subaru telescope’s Hyper Suprime-Cam (HSC). Mid-infrared coverage over EDF-N and EDF-F is provided by the DAWN survey Spitzer/IRAC data (Euclid Collaboration: Moneti et al. 2022), where the primary contribution is from the Spitzer Legacy Survey (SLS; Capak et al. 2016). Both the H20 and the SLS surveys were designed to obtain imaging of comparable depth to the near-infrared observations that will be conducted by Euclid in the EDFs. Notably, the SLS data represent the single largest allocation of Spitzer time ever awarded. While the H20 survey targets the full twenty square degrees of EDF-N with UV/optical coverage, the Spitzer mid-infrared imaging only covers the central ten square degrees. In EDF-F, both the H20 and SLS surveys target the full ten square degrees of the field. The combination of wavelength coverage, spanning the UV through mid-infrared; area, targeting more than twenty square degrees; and depth, reaching 5σ depths of ~27 AB mag in optical bands and 25 AB mag at 3.6–4.5 µm, is unique across extragalactic fields.
Since 2019, the H20 survey has been obtaining Subaru HSC imaging in the griz filters and CFHT MegaCam u-band imaging across EDF-N and EDF-F. In order to produce the most complete co-added images to be paired with the deep Spitzer/IRAC data, all archival imaging in EDF-N and EDF-F from the same listed facilities were included and processed alongside the data taken by H20. The DAWN survey PL catalogue of EDF-N spans a total of 16.87 deg2, with 9.37 deg2 reaching final survey depths (see Sect. 2.4). The DAWN survey PL catalogue of EDF-F contains 2.85 deg2 of the deepest presently available data, with 1.77 deg2 reaching final survey depths in all but one band. Additional imaging is currently being acquired to expand EDF-N to final survey depths across 20 deg2 and to complete EDF-F to its final survey depths across 10 deg2. Although the ground-based data acquisition is ongoing, the DAWN survey PL catalogues are presented now in order to support both pre-launch and early science objectives in Euclid Deep Fields.
With only limited near-infrared imaging from Euclid currently acquired over EDF-N and EDF-F, the present DAWN survey catalogues were selected using optical imaging, though future catalogues will be selected from the near-infrared Euclid data. The creation of the DAWN survey catalogues benefitted from the experience and insight garnered via the recent reprocessing and photometric extraction of all publicly available data in the COSMOS field (Scoville et al. 2007), which culminated in the release of the COSMOS2020 catalogue (Weaver et al. 2022). Already, the COSMOS2020 catalogue has proved a valuable resource for extragalactic science (Ito et al. 2022; Shuntov et al. 2022; Davidzon et al. 2022; Kauffmann et al. 2022; Gould et al. 2023; Taamoli et al. 2024). Accordingly, many of the choices made in building the DAWN survey catalogues were motivated by the strategies developed during the construction of the COSMOS2020 catalogue. The similarity in depth, utilised facilities, and wavelength coverage mark COSMOS2020 as a forerunner to H20 and the DAWN survey, although these surveys span a volume that is larger by more than an order of magnitude. The total volume of the DAWN survey out to z ~ 7 will be ~3 Gpc3, and roughly one half of this volume is contained by EDF-N and EDF-F alone. Thus, the unique data in EDF-N and EDF-F, and the DAWN survey generally, enable high-redshift studies where Poisson uncertainties and cosmic variance are not the dominant sources of error. By contrast, even in the 2 deg2 COSMOS field, cosmic variance and Poisson uncertainties dominate the error budget for the abundance of massive (M⋆ > 1010.5M⊙) galaxies (Weaver et al. 2023a). In addition, the unique data of the H20 and the DAWN survey enable exploration of diverse environments and significant cosmic volumes at high redshift (z > 3). These volumes contain several tens to hundreds of massive dark matter halos (Mhalo > 1012 M⊙) as well as voids such that the variation of galaxy properties in cosmically distinct environments can be directly measured. In comparison, fewer than ten such massive halos are expected in a survey such as COSMOS (Despali et al. 2016) at these redshifts.
The Farmer (Weaver et al. 2023b) was used to measure multiwavelength photometry from the DAWN survey images. The Farmer is an open-source package built around The Tractor (Lang et al. 2016) that derives photometry by fitting galaxy surface brightness profiles. While The Tractor provides a library of models and optimisation routines, The Farmer handles organisational tasks including appropriate model selection for source parameterisation, highly parallelised multiprocessing, and catalogue creation. Together, they yield self-consistent total flux and flux uncertainties across wide ranges of wavelengths and spatial resolutions. In total, 5 286 829 objects were detected over the 16.87 deg2 area of the PL EDF-N catalogue, where 3 513 211 of the detected objects are in the 9.37 deg2 full-depth region. In EDF-F, 1 062 645 objects were detected over the PL 2.85 deg2 area, where 727 678 are detected over the 1.77 deg2 full-depth region. In the presentation of the COSMOS2020 catalogue, Weaver et al. (2022) demonstrated the utility of obtaining measurements of photo-z, stellar mass, and star-formation rate from multiple independent codes. The same approach was adopted in this work, and photo-zs and physical properties of galaxies were measured with both EAZY (Brammer et al. 2008) and LePhare (Arnouts et al. 2002; Ilbert et al. 2006).
This paper is structured as follows. In Sect. 2 the imaging data and their reduction are presented. An overview is provided of the methods for source detection and photometry in Sect. 3. Section 4 describes the photo-z measurements using the measured photometry, while Sect. 5 presents the physical properties of the galaxies. The paper and first data release are summarised in Sect. 6.
This work adopts a standard ΛCDM cosmology with H0 = 70 km s−1 Mpc−1, Ωm = 0.3 and ΩΛ = 0.7. All magnitudes are expressed in the AB system (Oke 1974), for which a flux fν in µJy (10−29 erg cm−2 s−1Hz−1) corresponds to ABν = 23.9−2.5 log10(fν/µJy). SED fitting codes assume a Chabrier (Chabrier 2003) initial mass function.
2 Observations and data reduction
The creation of the Cosmic Dawn Survey PL catalogue began with the collection of multiwavelength data spanning the UV/optical to mid-infrared obtained across EDF-N and EDF-F. UV/optical imaging was provided by the H20 survey, specifically acquired from the CFHT MegaCam in the u filter and the Subaru HSC griz filters. These data were paired with the deep Spitzer/IRAC covering EDF-N and EDF-F from the DAWN survey (Euclid Collaboration: Moneti et al. 2022). Data from all facilities were sampled from their native pixel scales to the pixel scale of HSC (0.168″/pixel). The coverage according to each facility, along with bounding regions indicating the area spanned by each catalogue, is presented in maps of the two fields in Fig. 1. Below, the acquisition of data from the various observatories and their reduction is described.
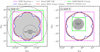 |
Fig. 1 Layouts and facility coverage for the two fields included in the DAWN survey PL catalogues, EDF-N (left) and EDF-F (right). Also highlighted are areas of particular importance to Euclid, namely, the Euclid self-calibration field in EDF-N, and the Chandra Deep Field South (CDF-S) Euclid Auxiliary Field (EAF) in EDF-F. The regions spanned by the PL catalogues are illustrated by the green squares. The areas of the PL catalogues reaching approximately final integration times by all facilities (or covered to full depth; see Sect. 2.4 and Table 1) are shown in grey. A future release from the DAWN survey will include catalogues with coverage from all facilities at full-depth spanning the entirety of EDF-N and EDF-F areas are targeted by Euclid. |
2.1 Ultraviolet data
The H20 survey has carried out an extensive campaign to obtain deep ultraviolet (UV) imaging in the u band using CFHT and the MegaCam instrument (Boulade et al. 2003) across EDF-N and EDF-F. MegaCam has a square field of view with an area of 1 deg2. In both EDF-N and EDF-F, only imaging obtained with the instrument’s new u filter, which replaced the old (u*) filter in 2015 and has a more uniform transmission, was considered. Hereafter, the ‘new’ u filter is simply referred to as the u filter or the u band. The old u* was not used in this work. Each field was observed in a square grid of 4 × 4 pointings (16 total), where each pointing overlaps by 180″ with its neighbours. A five point ‘large dithering pattern’, as defined by CFHT, was used for the majority of our exposures. The large dithering pattern covers an ellipse with a major axis of 180″ and minor axis of 30″. Further, exposure times of 324 s were primarily used for individual frames. In some cases, the dither pattern, number of dithers, and integration times were adjusted slightly in order to fully make use of the queue time awarded each semester.
To create the u-band mosaics, all available data in the Mega-Cam u filter were gathered across EDF-N and EDF-F. Within the EDF-N field, approximately equal contribution was made by both the H20 survey and the Deep Euclid U-band Survey (DEUS; designed after the success of Sawicki et al. 2019), while other archival imaging makes a smaller contribution. In EDF-F, only H20 imaging was utilised, as H20 provides the only data in the u filter within the field. Extreme outlier images with bad seeing, tracking, or transparency were initially removed. Detrending began with the raw data from CFHT. For every observing run, new flat fields were built, where Gaia DR3 (Gaia Collaboration 2016b, 2023) was used as an astrometric reference. Proper motions of stars were accounted for at the epoch each image was taken before calibration, and each input image was calibrated separately. This calibration is accurate to approximately ~20 mas.
Regarding photometric calibration, first a photometric ‘superflat’ was applied to each input image to correct for the illumination of the focal plane. The superflat was built for each MegaCam run, using all the images that overlap with the Sloan Digital Sky Survey (SDSS; Kollmeier et al. 2017). This process typically achieves a photometric flatness on the order of 0.005 mag. For the absolute calibration of image zero-points, Gaia DR3 was used. The Gaia spectra were multiplied by the appropriate filter passbands to create synthetic photometry, which was used to calibrate each image. A significant challenge was that the Gaia spectra are only available for relatively bright stars, some of which are saturated. To mitigate the random noise and increase the sample of usable stars, all the catalogues from each image were merged to produce a deeper secondary photometric catalogue for calibration. This process makes individual image photometric calibration accurate to 0.01–0.02 mag internally.
Pixel masks for the u-band images were created with WeightWatcher (Marmo & Bertin 2010). This code identifies bad columns, bad pixels, and cosmic rays; good pixels were set to 1 while bad pixels were set to 0. Final image stacking was performed with SWarp (Bertin et al. 2002; Bertin 2010) using the clipped mean ‘combine type’, which provides a balance of outlier rejection when combined with the masking from the previous step, and only minimally reduces the signal-to-noise ratio (S/N). During this step, the u-band images were also resampled to the scale and tangent point of the HSC data (Sect. 2.2). Due to the contribution from several observing programs with different observation patterns, the resulting u-band data in EDF-N is roughly 0.3 mag deeper than EDF-F and shows greater spatial consistency. Both fields are among the deepest u-band data available over such large areas.
 |
Fig. 2 Astrometric comparison between Gaia DR3 matched to the DAWN survey PL catalogues for objects with HSC g magnitudes between 16 and 21 (left: EDF-N, right: EDF-F). The spacing between the dashed lines represent the dimensions of HSC pixels, while the green and red shaded regions represent the 1 and 3σ covariance ellipses, respectively. For clarity, only 2.5 and 10% of the matched sources are shown for EDF-N and EDF-F, respectively, where fewer sources are shown for EDF-N due to the higher stellar density (lower Galactic latitude) and greater catalogue extent. |
2.2 Optical data
The central component of the H20 survey is deep optical imaging covering EDF-N and EDF-F. This is supplied by HSC (Miyazaki et al. 2018) on the Subaru telescope. Subaru HSC has a circular field of view with an area of 1.8 deg2. EDF-N and EDF-F are circular fields spanning 20 and 10 deg2, respectively. To cover the central 10 deg2 of each field, a flower petal observation pattern was designed with a single central pointing surrounded by a circle of six pointings with radius of 1.1°. For the outer 10 deg2 annulus of EDF-N, additional pointings have been planned. Imaging with HSC was acquired in the griz broad bands with exposure times for individual frames of 200, 210, 260, and 300 s, respectively. Throughout the H20 observations, a standard five-point dither pattern with a throw of 120″ was employed.
Just as was done for the CFHT u band, data reduction began by first gathering all existing public HSC imaging data over EDF-N and EDF-F from the Subaru archive (SMOKA; Baba et al. 2002)1. Programs with public data in EDF-N include HEROES (Taylor et al. 2023) and AKARI (Oi et al. 2021). In addition to the griz bands, archival narrow-band imaging in the NB0816 and NB0921 filters was gathered in both fields, and in EDF-N archival HSC y imaging was also gathered. All HSC data were reduced using the public data reduction pipeline hscPipe version 8.4 (Bosch et al. 2018). The default reduction routines of hscPipe were applied with the following modifications. First, the older jointcal algorithm was used for astrometric calibration instead of the new FGCM algorithm (Aihara et al. 2022), as the latter is more memory intensive and becomes too time-consuming for deep data with many individual frames. Second, sigma clipping was applied for coadd images, which significantly reduces scattered light, satellite trails, and cosmic rays, among other spurious objects in the images. Finally, the internal parameters of hscPipe area were adjusted to enable extraction of PSF models much larger than the default size, as the default models were too small for the model-based photometry method that was used (see Sect. 3).
Another significant feature of Subaru HSC data reduction is photometric and astrometric calibration. These calibrations are applied by hscPipe through matching objects to the Pan-STARRS1 3π survey (Chambers et al. 2016) and deriving the appropriate colour and absolute photometric brightness corrections. For the astrometric calibration, Pan-STARRS uses Gaia DR1 (Gaia Collaboration 2016a; Lindegren et al. 2016), so the HSC imaging inherits this reference system for its astrometry. The quality of this calibration was validated by re-matching the detected objects to Gaia DR3 (Gaia Collaboration 2023) as demonstrated in Fig. 2. In EDF-N, a standard deviation of <3 mas between the final measured coordinates and the Gaia DR3 coordinates is observed, with slightly greater variation in Dec. For EDF-F, a standard deviation of ~4 mas with approximately equal variation in both RA and Dec is observed, and an additional offset <2 mas in RA. The smaller area considered for the present EDF-F data results in smaller sample size and thus a larger measured statistical variation in astrometry in comparison to EDF-N, because the scatter is dominated by random errors. The tangent point and pixel scale of the final stacked HSC images form the reference world-coordinate system (WCS) against which all imaging from other facilities were sampled to match.
2.3 Mid-infrared data
The mid-infrared data in the DAWN survey PL catalogues came from the Spitzer Legacy Survey (Capak et al. 2016; Euclid Collaboration: Moneti et al. 2022). These data distinguish the EDF-N and EDF-F fields from other deep and wide extragalactic survey fields by providing the deepest Spitzer imaging available over such large areas. The acquisition and reduction of these data are fully described in Euclid Collaboration: Moneti et al. (2022). The images produced by that effort are sampled to a scale of 0.6″/pixel and co-added using linear interpolation of the individual frames. The Spitzer/IRAC data were resampled in this work to the scale and tangent point of the HSC data using SWARP, just as for the CFHT u band.
H20 target integration times for each instrument and band combination.
2.4 Area coverage
The DAWN survey PL catalogues are provided to be of immediate use to science in EDF-N and EDF-F, though some areas of each field are not yet covered to their final target exposure times in every instrument and bandpass combination at the time of writing. The H20 survey with CFHT MegaCam and Subaru HSC is ongoing. Here, the status of data acquisition, at the time of writing, is established. Recall that the total area of the Euclid EDF-N is 20 deg2, while the total area of EDF-F is 10 deg2, as defined by Euclid Collaboration: Scaramella et al. (2022). Completed coverage, or ‘full-depth’, is defined as having acquired a total integration time equal to the target integration time and is considered per-pointing. A table of the target integration time of each facility is provided in Table 1, and a table summarising the regions of the DAWN survey PL catalogues is provided in Table 2.
The target integration time with CFHT MegaCam in the u filter was 2.5 hours and was calculated to achieve a 5σ point-source limiting magnitude of at least 26.4 mag assuming 1 arcsecond seeing. In practice, the integration time needed to reach the target value differs between EDF-N and EDF-F. The former hosts extensive archival imaging (predominantly provided by DEUS; see Sect. 2.1) whereas there is no previous CFHT MegaCam imaging in the u filter over EDF-F prior to H20. The CFHT MegaCam u-band imaging is complete over ten square degrees in both EDF-N and EDF-F, reaching approximately 14 deg2 in both fields according to the tiling strategy described in Sect. 2.1. The outer ten square degree annulus of EDF-N is expected to be completed with CFHT MegaCam u in 2025, while no further CFHT MegaCam data are required in EDF-F.
The target integration times for the Subaru HSC griz bands across EDF-N and EDF-F were 1.1, 2.5, 4.1, and 4.8 hours, respectively. These were calculated to achieve 5σ limiting point-source magnitudes of 27.5, 27.5, 27, and 26.5, respectively, assuming 0.7 arcsecond seeing. EDF-N hosts significantly more complete coverage with Subaru HSC compared to EDF-F, given EDF-N is observable year-round from Hawaii whereas EDF-F is only observable in the second half of the calendar year. At the time of writing, EDF-N is completed across 9.37 deg2 to target integration times in all griz filters. Notably, the full-depth region of EDF-N essentially spans the entirety of the area covered by Spitzer/IRAC. For EDF-F, an area of 1.77 deg2, centred on Chandra Deep Field South (CDFS), is completed to the target integration time in all filters except HSC z (lacking ~20% of the required time). Both fields have shallower coverage in all filters across the areas outside the respective full-depth regions.
As noted in Sect. 2.2, all publicly available Subaru HSC imaging over EDF-N and EDF-F was reduced for this work, including archival HSC y imaging in EDF-N and HSC NB0816 and NB0921 imaging over both EDF-N and EDF-F. As these data were not targeted as part of the H20 Survey, they have no ‘target’ integration time. The SLS has long been completed, and since then Spitzer has been decommissioned. The reader is referred to the detailed description of the Spitzer/IRAC integration times over EDF-N and EDF-F provided by Euclid Collaboration: Moneti et al. (2022).
The DAWN survey PL catalogues presented here were created using all imaging processed as of January 2024, while additional data are currently being acquired and processed. The DAWN survey PL EDF-N catalogue spans 16.87 deg2 total, extending beyond the area covered by Spitzer and slightly beyond the area currently covered by CFHT MegaCam, while the DAWN survey PL EDF-F catalogue spans 2.85 deg2 total. A future data release will include complete Subaru HSC and CFHT MegaCam imaging over the entire 20 deg2 area of EDF-N and 10 deg2 area of EDF-F with complete uniform coverage. The 9.37 deg2 region in EDF-N and the 1.77 deg2 region in EDF-F reaching full-depth in each ugriz filter are indicated in Fig. 1. The respective areas are summarised in Table 2.
Areas defining the extents of the DAWN survey PL catalogue regions.
2.5 Image depths
The limiting magnitude(s) of a survey is an essential characteristic for understanding the properties of galaxies detected therein and for comparing one survey to another. The amount of variation of noise in the sky background dictates the limiting magnitude by effectively establishing a minimum object flux that can be reliably measured. Many surveys (e.g. Laigle et al. 2016; Weaver et al. 2022) use the dispersion in flux measurements computed from many independent fixed-size apertures, placed away from astronomical sources, to describe the level of variation in the sky-background and thus the limiting magnitude. The dispersion is related to the ‘depth’ of an image, where depth in this context relates to the limiting magnitude at detection or photometry. However, it is necessary to carefully consider the impact of undetected sources and the spatial sampling rate. Failing to address these challenges can bias the estimated limiting magnitudes up to ~0.3 mag (see Appendix B).
The depth and limiting magnitudes of the data used herein were measured from the dispersion of empty aperture fluxes according to the following method. First, apertures with 2″ diameters were randomly placed in regions away from detected objects using the segmentation maps output by SEP (see Sect. 3.1). Each image was sampled at a rate of one aperture per five square-arcseconds. Then, the flux was measured in each aperture and sigma-clipping was performed on the distribution of measured fluxes at the five-sigma level to limit the impact from undetected astronomical sources. To further mitigate the contribution of undetected astronomical objects, the next step was to model the distribution using a Gaussian function. A Gaussian function was iteratively fit to the data to extract the true profile of the empty aperture flux dispersion distribution. From the best-fit model, the standard deviation of the distribution was then measured. The final quoted depths are given by the standard deviation of the final Gaussian fit, multiplied by five (i.e. 5σ limiting magnitudes). Figure 3 depicts the variation in the 2″ limiting magnitudes measured across the field. The limiting magnitudes are summarised in Table 3. Further consideration regarding limiting magnitudes and the method described above are provided in Appendix B.
 |
Fig. 3 Depths and limiting magnitudes measured by the dispersion of empty aperture fluxes for each bandpass (see Sect. 2.5 and Appendix B for details). The top two rows correspond to EDF-N, and the bottom two rows correspond to EDF-F. The ‘full-depth’ regions of EDF-N and EDF-F illustrated in Fig. 1 are apparent by the areas of greater depth in the HSC griz (see Sect. 2.4, Tables 1 and 2). The quoted value along the top of each panel is the median 5σ depth measured over the full-depth region of each field. Only the areas covered by the DAWN survey PL catalogues are shown, corresponding to the green rectangular regions in Fig. 1. Future data acquired from CFHT MegaCam and Subaru HSC will expand the areas of both fields and lead to more uniform coverage. The depths are summarised in Table 3. |
2.6 Masking
Bright foreground stars negatively affect photometry by obscuring galaxies directly and indirectly through internal reflection and scattered light within the telescope, saturation, and ‘ghosts’. Furthermore, reduction pipelines often struggle to accurately model the sky background in their vicinity, leading to significant fluctuation in the quality of background subtraction. Therefore, it is typically preferred to mask large regions surrounding bright stars in the images entirely. Bright star masks were created using the Gaia DR3 catalogue (Gaia Collaboration 2023), masking all identified stars brighter than 17 mag in the Gaia G band, where the size of the masked region is proportional to the star’s brightness. The masks were applied at all wavelengths. At present, these were the only masks used to reduce the impact of spurious objects, though future releases may include additional masks for other known sources of artefacts. The total areas affected by bright stars and excluded in the DAWN survey PL catalogues is given in Table 2.
Point source depths and depths measured with 2″ diameter apertures (both 5σ).
2.7 Spectroscopic data
A number of programs with different instruments have targeted galaxies in EDF-N and EDF-F for spectroscopy. In EDF-N, the AKARI team primarily observed infrared-selected galaxies and AGN (Goto et al. 2017). In addition, the Early Data Release of the Dark Energy Spectroscopic Instrument (DESI; DESI Collaboration 2024) includes observations of EDF-N. In EDF-F, thousands of galaxies in the GOODS-S region have been targeted (Garilli et al. 2021; Kodra et al. 2023). The Texas Euclid Survey for Lyman-Alpha (TESLA) is conducting spectroscopic analysis of the EDF-N NEP field using the Visible Integral-field Replicable Unit Spectrograph (VIRUS) on the Hobby-Eberly Telescope (Chávez Ortiz et al. 2023). VIRUS is designed to be sensitive to Lyα emission from galaxies at 1.9 < z < 3.5 above a flux limit of 5×10⁻¹⁷ erg s−1 cm−2 (5σ). In addition, H20 has been carrying out spectroscopic follow-up of objects selected from the PL catalogues using the Deep Extragalactic Imaging Multi-Object Spectrograph (DEIMOS; Faber et al. 2003) on the 10 m Keck II telescope. The H20 efforts have been primarily to confirm galaxy protoclusters at z > 4 by targeting over-dense regions associated with Lyman-break galaxies. A paper describing the target selection for H20 spectroscopy is forthcoming (Chartab et al., in prep.). The use of spectroscopy in this work is limited to the validation of photo-zs (Sect. 4.3). As the H20 spectroscopic data are still being gathered and processed, only the external spectroscopic datasets are employed in this work.
For the purposes of validating photo-zs, a spec-z sample from DESI (DESI Collaboration 2024) was used that includes a total of 36 500 sources in EDF-N. In EDF-F, the GOODS-S CANDELS spec-z sample (Kodra et al. 2023), including 2697 objects, as well as the public VANDELS spec-z sample (Garilli et al. 2021), including 2085 sources, was used. The validation of EDF-F is described in Sect. 4.3, while the validation of EDF-N is described in Appendix C.
3 Source detection and photometry
Flux measurements and uncertainties in the DAWN survey PL catalogues were measured from the H20 and Spitzer multiwavelength imaging using The Farmer. In brief, The Farmer is a pythonic wrapper, driver, and user-interface for the model-optimisation code The Tractor (Lang et al. 2016). The Tractor provides a library of models to describe astrophysical light profiles and methods for fitting these models but requires customised code to employ them in any efficient way. The Farmer was first introduced in Weaver et al. (2022), where the model-based photometry method was used to create one of the two publicly available COSMOS2020 catalogues (the other being made with ‘classic’ aperture photometry). Therein, the authors demonstrated the reliability of The Farmer in producing accurate photometry through a detailed comparison with well understood aperture photometry of the ‘classic’ catalogue. The Farmer flux measurements for COSMOS2020 were further validated through SED modelling and yielded excellent photo-zs, especially for faint sources. Lastly, the capabilities of The Farmer were investigated and benchmarks were quantified in Weaver et al. (2023b) using simulations of deep multiwavelength imaging. The authors validated various outputs of The Farmer, including photometry, resulting number counts, galaxy shapes, and statistical metrics related to goodness-of-fit. The reader is referred to these works for a detailed explanation of the inner workings of The Farmer. The remainder of this section includes a summary of the relevant steps to measuring photometry using The Farmer and a discussion of features unique to H20.
Similar to the ‘patches’ used by hsc_pipe (Bosch et al. 2018), The Farmer breaks apart large survey mosaics into smaller images referred to as ‘bricks’. Bricks are used because they are more easily handled in computer memory than full mosaics and can be processed in parallel. In general, it is advantageous to define the dimensions of bricks such that the ratios of the mosaic axes lengths to the brick axes lengths are integers, enabling straightforward comparisons and treatment across bricks. For this reason, the bricks in the EDF-N field were 4000 pixels on each side (11.2 arcmin), representing a 22×22 grid of the EDF-N mosaic. Similarly, EDF-F bricks were 3620 pixels on a side (10.1 arcmin), representing a 10×10 grid of the EDF-F mosaic, which, as previously stated, only includes the deepest region as of this publication. Slight differences in brick size do not impact any significant features of the photometry and were only used in accordance with the mosaic size (that is, to achieve an integer multiple of bricks).
3.1 Source detection
Source detection began with designing the image from which sources were to be detected. A multiwavelength composite image was built as the detection image, where each pixel value corresponds to a probability of belonging to sky-noise, following the now widespread approach first introduced by Szalay et al. (1999). In short, the pixel values of the multiwavelength composite image approximately follow a modified χ2 distribution with degrees of freedom equal to the number of input images. The probability of belonging to sky noise may then be directly inferred from the pixel value. Being primarily interested in the high-redshift universe, images from the deepest and reddest bandpasses in DAWN survey PL catalogues were combined. These include the HSC r + i + z bandpasses. It is noted that the assignment of a particular wavelength range spanned by the detection image directly influences the selection of galaxies (see Sect. 5.2). Future catalogues of the DAWN survey will select galaxies from similarly deep near-infrared imaging from Euclid.
The images were combined using SWARP with the CHI-MEAN co-addition setting. This setting creates a multiwavelength composite where the pixel values follow a χ-distribution. This distribution is re-centred on the mean value depending on the number of inputs (see Appendix B in Drlica-Wagner et al. 2018 for a comparison of the different combination settings in SWARP, including a version of the original method used by Szalay et al. 1999). This technique has been used by the CFHT Legacy Survey (Cuillandre et al. 2012), the COSMOS survey (Ilbert et al. 2013; Laigle et al. 2016; Weaver et al. 2022), the Dark Energy Survey (Drlica-Wagner et al. 2018), DECam images in the SHELA survey (Stevans et al. 2018), and recent work combining datasets from different HST campaigns (Bouwens et al. 2021).
To carry out object detection and segmentation, The Farmer utilises the python library of Source Extraction and Photometry (SEP; Barbary 2016), a python interface wrapping many of the core functionalities of the widely used Source Extractor (Bertin & Arnouts 1996). The source detection parameter settings used here are identical to those used in the COSMOS2020 catalogue (Weaver et al. 2022). Sources located within the bright star masks (Sect. 2.6) were removed after detection. All other detected sources were catalogued, and their properties measured by SEP (e.g. position, shape) were stored for the modelling stage as initial conditions (Sect. 3.3).
In total, 5 286 829 objects were detected over the 16.87 deg2 area of the PL EDF-N catalogue, where 3 513 211 of the detected objects are in the 9.37 deg2 full-depth region. In EDF-F, 1 062 645 objects were detected over the PL 2.85 deg2 area, where 727 678 are in the 1.77 deg2 full-depth region.
3.2 PSF handling
Most methods of photometry, including both aperture photometry and model-based photometry, require accurate characterisation of the point spread functions (PSFs) for the image. Aperture-based methods require PSF homogenisation – an intentional degradation of high-resolution information – to obtain consistent measurements of total fluxes and colours across images of varying resolution. One of the benefits of some model-based photometry methods, including those used by The Tractor, is that PSF homogenisation is not necessary. The Tractor uses parametric representations of sources that are independent of the image PSF. However, before constructing models of the detected sources with The Farmer, representations of the PSF in each of the imaging sets must be obtained. Then, when a model is fit to a source observed in a given bandpass, the PSF corresponding to that image may be simply convolved with the model, preserving the full information of each image. Thus, instead of homogenising the PSF of all of the multiwavelength imaging to a common reference, each band may be treated independently according to its PSF model.
Beginning with the bluest band (CFHT MegaCam u), PSFex (Bertin 2013) was used to create models of the PSF. Bright, but not saturated, point-like objects were identified via their position in the magnitude-effective radius diagram. One spatially constant PSF model was created per mosaic brick in each field, providing a sampling of approximately 30 PSF models per deg2 in EDF-N and 35 PSF models per deg2 in EDF-F. As noted in Weaver et al. (2022), The Farmer works best when supplied with large PSF renderings, which can account for the light-profile of objects that may include significant flux in the wings of some sources. Therefore, PSF models with 201 pixels in diameter (33.77″) were created.
For the Subaru HSC bands, a grid of PSF models was constructed to describe and account for the variation of the PSF across the survey area. This was required because the sigmaclipping step in the image stacking (Sect. 2.2) deforms the uniformity of the PSF across each field. Furthermore, creating large images (several degrees on a side) with the same tangent point can also affect the PSF. The initial grid spacing was 29″, which matches the sampling scale for Spitzer IRAC (see below). The PSF models were built using routines within hscpipe. PSF models with radii of 103 pixels were extracted, manually overriding the default settings of hscpipe , which otherwise produces PSF models with radii of 43 pixels. PSF models with axis ratios less than 0.9 and those with first or second moments that could not be accurately measured were flagged. Variation in the properties of the extracted PSFs is shown in Fig. 4.
A grid of PSF models across the survey area for Spitzer/IRAC images was built in a similar manner as for HSC. For this operation, the software PRFmap (A. Faisst, private communication) was used. Across each Spitzer/IRAC mosaic (in this case, [3.6 µm] and [4.5 µm]), the code was used to consider each of the individual frames that went into creating the final co-added image and builds a specific Point Response Function (PRF) model for each frame. Each PRF model is unique because the response function is not rotationally symmetric. Finally, the individual PRF models were stacked at each grid point. These PRF models were constructed on the same pixel scale as the IRAC images produced by Euclid Collaboration: Moneti et al. (2022), 0.6″, before being resampled to the HSC pixel scale, 0.168″.
3.3 Model determination
Once the PSFs models were constructed for each set of imaging, parametric models were determined for the detected sources’ light profiles. The default configuration of The Farmer was used, which includes consideration of five different parametric models to describe a given source. The parametric models include options for both point-like and extended objects and are fully described in Weaver et al. (2022) and Weaver et al. (2024). The Subaru HSC r, i, and z images were used individually as the joint constraints for models, which were the same bands used to create the composite detection image. This ensured that the PSF can be properly handled in each image, that information utilised at the detection stage is carried through the photometry stage, and that all detected sources have model constraints coming from at least one band. Using the combined detection image is not advised for photometric modelling, as the properties of the PSF for the detection image are not easily characterised. Future releases from the DAWN survey will include both source detection and model-based photometry using Euclid near-infrared imaging.
Model parameters, such as position and flux, were initialised with values determined from the detection stage. Sources with approximately overlapping light profiles (described as ‘modelling groups’ in Weaver et al. 2023b) were fit simultaneously with one another to account for their overlapping light profiles. The model that best describes each source’s light profile was selected according to a decision tree which proceeds from simple to more complex models in an approach described and validated in Weaver et al. (2022) and Weaver et al. (2023b). The final model was optimised according to the constraints imposed by the Subaru HSC r, i, and z images, which include flux, position, and shape. However, this initial model included only one value for flux and accordingly must be re-fitted to each individual band in the forced photometry stage (Sect. 3.4).
A small subset of detected objects (<0.5%) in each field were not able to be fit by a model, likely due to contamination from a bright neighbouring source. The positions of the objects were recorded in the catalogues and their cumulative area for each field is reported in Table 2.
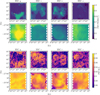 |
Fig. 4 Variation of the HSC griz PSF FWHM (top) and ellipticity (B/A, bottom). EDF-N is shown in the top row of each pair, while EDF-F is shown in the bottom. Only the areas covered by the DAWN survey PL catalogues are shown, corresponding to the green square regions in Fig. 1 and consistent with Fig. 3. |
3.4 Forced photometry
Total model fluxes were measured by re-fitting the final optimised models obtained during the model determination stage (Sect. 3.3) at the locations of each detected source in each of the H20 and Spitzer/IRAC images. This operation is commonly referred to as ‘forced’ photometry. Here, morphological parameters of the models were held fixed while the flux was re-optimised in each band. Positions were anchored to the HSC r + i + z model values but were left to vary within a strict Gaussian prior with a standard deviation of 0.3 pixels (this corresponds to a constant angular scale across all images, as all images were resampled to the same pixel scale). This flexibility can overcome slight offsets in astrometry and prevent erroneous positions for faint objects.
Total object fluxes were measured in the CFHT MegaCam u band, the Subaru HSC griz bands, and in the Spitzer IRAC [3.6 µm] and [4.5 µm] bands. Where available, photometry was also measured from archival Subaru HSC y (restricted to EDF-N), NB0816, and NB0921 imaging. These flux measurements, in addition to flux uncertainties, were recorded in the catalogues. To reiterate the description provided in Weaver et al. (2022), The Tractor computes flux uncertainties by summing the weight map pixels in quadrature, where each pixel is further weighted by the unit-normalised model profile (for point-sources, this is simply the PSF). This method prioritises the per-pixel uncertainty directly under the peak of the model profile and gives less weight to the per-pixel uncertainty near the edges of the model.
Band-specific relationships of the measured flux and flux uncertainty are presented in Fig. 5 after converting the flux and flux error measurements to magnitude and magnitude error, respectively. The curves representing this relationship for each facility and bandpass follow the expected distributions. That is, they are smoothly and monotonically increasing for fainter objects and measured flux uncertainties representing a 5σ measurement are near to the values measured via the dispersion of empty aperture fluxes in Sect. 2.5. The exception to this is Spitzer/IRAC, where the uncertainties measured by The Farmer appear to be underestimated. A similar feature was noticed in Weaver et al. (2022), wherein the authors attributed this underestimation to the difficulty of accounting for the contribution of pixel co-variance towards total photometric uncertainty, even for model-based methods such as The Tractor. As the Spitzer/IRAC images have been significantly oversampled from their native pixel scale, from 1.2″/pixel to 0.168″/pixel, the amount of covariance in the resampled image plan is expected to be significant.
When using The Farmer, faint objects are predominantly modelled as point sources (Weaver et al. 2023b). For the CFHT and HSC filters, the curves depicted in Fig. 5 may thus be used to infer the limiting magnitudes for point source photometry of the images, given the model of the PSF and the image weights. The point source depth at 5σ corresponds to the intersection of a given curve and the 5σ uncertainty (dotted line). These values are presented in Table 3. The limiting magnitude of point sources is fainter than for an aperture of fixed size when the FWHM of the PSF is more narrow than the aperture. An image with a PSF of similar scale to the fixed aperture should have a similar point source depth compared to the aperture depth. Accordingly, instrument and filter combinations with broad PSFs in Fig. 5 have similar point source depths compared to their corresponding aperture depths. Again, the exception is Spitzer/IRAC, where the image properties preclude a proper comparison.
The Farmer provides further information, in addition to fluxes and uncertainties, related to the model-fitting. Weaver et al. (2023b) provides a detailed explanation of the different possible outputs from The Farmer, but in short, the code also provides χ2 goodness of fit metrics as well as three metrics measured from the moments of the residuals weighted by the per-pixel variance, including the median, standard deviation, and D’Agostino’s K2 test.
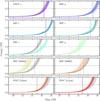 |
Fig. 5 Magnitude versus magnitude error for each unique facility and filter combination, with EDF-N shown in colour and EDF-F shown in grey. Each solid line represents the median magnitude uncertainty as a function of magnitude for a given band. The shaded regions are bounded by the 84th and 16th percentiles of the magnitude error distributions, enclosing 68% of the objects. The 5σ limiting magnitudes measured with 2″ diameter apertures reported in Table 3 are shown by vertical lines. A horizontal dotted line indicates a 5σ model-based photometric uncertainty. |
3.5 Galaxy number counts
The full-depth area of the EDF-N catalogue is 9.37 deg2, and after accounting for masked regions (see Sect. 2.6) and failed models, the effective area is 8.42 deg2. The full-depth area of the EDF-F catalogue is 1.77 deg2, and after accounting for masked regions and failed models, the effective area is 1.71 deg2. The number counts of each field are shown in Fig. 6. The two fields show excellent consistency, with EDF-F reaching slightly fainter sources due to greater HSC r and i band depths (see Table 3 and Fig. 3). Disagreement on the bright end may be explained by the significantly greater stellar density in EDF-N due to its low galactic latitude, perhaps indicating an incomplete removal of all stars. The galaxy number counts are tabulated in Table 4.
As an initial step towards validating the H20 photometry, the galaxy number counts in EDF-N and EDF-F were also compared with those of COSMOS2020 reported by Weaver et al. (2022). Recall that COSMOS2020 shares many of the same methodologies employed here, most notably, the method of photometry, in addition to the wavelength coverage. For this presentation, the Subaru HSC i band was selected as it covers the central wavelengths of the detection image, although it is the bluest band included in the COSMOS2020 detection image. Stars were identified and removed via SED fitting, following the procedures described in Sects. 4.1 and 4.2. Galaxies at magnitudes HSC i < 25 show good agreement with the well established HSC i counts of COSMOS2020. Slight variations within this magnitude limit may be explained by differences in the methods used in each work to separate stars from galaxies. For example, COSMOS2020 uses morphology from the Hubble Space Telescope in addition to SED fitting to remove likely stars and also uses more bands in the SED fitting. At magnitudes HSC i > 25, the disagreement is dominated by the difference in depths for the two surveys. The disagreement on the faint end is further exacerbated by the combination of near-infrared wavelengths in the COSMOS2020 detection image, which enables detection of optically faint galaxies.
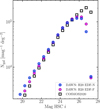 |
Fig. 6 Subaru HSC i number counts of galaxies detected in the DAWN survey PL HSC r + i + z detection image. As a comparison, the HSC i number counts from the COSMOS2020 The Farmer catalogue (Weaver et al. 2022) are also shown, which were obtained using many of the same methods used in the present work. Bin spaces are 0.5 mag in each case. A small offset in the measured number counts before the turnover is caused by differences in the methods for separating stars from galaxies. |
4 Photometric redshifts
Several works (Weaver et al. 2022; Kodra et al. 2023; Pacifici et al. 2023) have demonstrated the utility of having multiple photo-z estimates from different codes for every source. Their approach was followed, and photo-zs were computed for the DAWN survey PL catalogues using LePhare (Arnouts et al. 2002; Ilbert et al. 2006) and EAZY (Brammer et al. 2008). HSC narrow bands were not included during SED fitting with either code because spurious photometric measurements in their limited wavelength ranges can drive systematic biases, for example, requiring an emission line at a given wavelength.
4.1 LePhare
LePhare was used to compute photo-zs closely following the procedure outlined in Ilbert et al. (2013), Laigle et al. (2016), and Weaver et al. (2022). One objective of the procedure used in the aforementioned works was to create a SED fitting configuration and SED template library that would be well suited to describe a diverse range of galaxies across cosmic time. Having been well validated in several works, their methods and template libraries were adopted here with little modification. The reader is referred to Weaver et al. (2022) for the most recent description of the LePhare configuration. A description of key differences with respect to our setup follows.
Ilbert et al. (2006) introduced a method to use a subsample of galaxies with spectroscopic redshift measurements (spec-zs) to improve photo-z measurements. To do so, offsets between the observed and predicted photometry from the template set are derived after fixing the redshift at the spec-z value. This procedure is repeated over the template set and spec-z sample until the offsets converge. This method was used here, employing the respective spectroscopic samples for EDF-N and EDF-F described in Sect. 2.7.
Photometric uncertainties were modified prior to SED fitting in order to account for discrepancies between the theoretical templates and observed photometry, a step also taken by Ilbert et al. (2013), Laigle et al. (2016), and Weaver et al. (2022). Offsets of 0.02 mag were added to the MegaCam and HSC broadband errors, and 0.05 mag were added to the IRAC [3.6 µm] and [4.5 µm] errors. All additions were done in quadrature. The range of redshifts explored was limited to 0 < z < 8 with steps of 0.01, departing from the range of Weaver et al. (2022) wherein the authors allowed solutions out to z = 10. Given the set of detection bands considered in this work, the reddest being the HSC z band, it is virtually guaranteed that galaxies beyond z = 8 are not detected, and even galaxies beyond z ~ 7 should be extremely difficult to detect. Considerations regarding the set of galaxy templates, range of E(B − V), dust attenuation curves, and treatment of emission lines were otherwise identical to those used by Weaver et al. (2022). Both the ‘best fit’ or maximum-likelihood redshift was recorded, as well as the redshift corresponding to the median of the probability distribution function of redshift, P(z), as measured by LePhare. The photo-z uncertainty 1σ lower and upper bounds are given by the 16th and 84th percentiles of the P(z), respectively.
As in Weaver et al. (2022), templates that describe active galactic nuclei (AGN) and stellar sources were considered in addition to the galaxy templates; the reader is referred to this work for a full description of various template sets employed. The goodness of fit of these alternative templates (and photo-z in the case of AGN) were recorded to aid in classifying each source as either star, galaxy, or AGN. As a demonstration and validation of their utility, stars were separated from galaxies by simply requiring the reduced χ2 of the stellar template fit to be less than that of the best galaxy template fit. It was further required for the source to have S/N > 3 in the IRAC [3.6 µm] band, as the infrared flux measurement is essential for accurately distinguishing stars from galaxies. The result of the star-galaxy separation is shown in Fig. 7. Only stars with HSC i magnitudes <21.5 are labelled as such, following Weaver et al. (2022). The majority of sources identified as stars fall on the expected sequence.
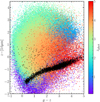 |
Fig. 7 Colour-colour diagram for stars and galaxies identified via SED fitting. Only sources with S/N > 3 in the listed bands are included. Galaxies are coloured according to their photo-z measured by LePhare, and sources with zphot > 5 are all shown in red. Stars are shown as black points following a well defined sequence in colour-colour space. A comparison validating the approximate locations of galaxies in colour-colour space as a function of redshift, as well as the size and extent of the stellar sequence, can be made with Fig. 12 of Weaver et al. (2022). |
4.2 EAZY
The most recent version of EAZY written in python (eazy-py; Gould et al. 2023) was also used to measure photo-zs and physical parameters of galaxies. As with LePhare, SED fitting with EAZY was carried out following the strategy laid out by Weaver et al. (2022) for the same motivations outlined above. EAZY and LePhare share many similarities in their approach to SED fitting. However, the most significant difference between the two codes is that LePhare is typically used to fit a large library of many individual templates, while EAZY is typically used to fit a small library of individual templates but allows for an unrestricted non-negative linear combination of templates to create a single model for each galaxy. This flexibility of EAZY is useful for efficiently describing a wide variety of galaxies, especially on the scale expected from a survey spanning tens of square degrees. However, the same flexibility is not guaranteed to be well constrained in cases of limited wavelength coverage, which may lead to disagreements in the measurements of physical parameters when compared to LePhare.
One departure from Weaver et al. (2022) was the specification of the EAZY template set. Recently, several sets of templates were added to the online repository2 that allow some of the physical attributes of the templates to evolve with redshift. For example, some templates include redshift-dependent star-formation histories and require the maximum attenuation of the reddened templates to evolve with redshift as well. In some works (e.g. Weaver et al. 2024), these template sets have been shown to outperform previous template sets from EAZY. Specifically, the template set described by the file ‘corr_sfhz_13.param’ was used.
Similar to LePhare, EAZY has methods for determining photometric offsets between observed and predicted photometry from the template set in specific bands. In contrast to LePhare, galaxies with spectroscopic redshifts are not needed. Instead, a user-defined fraction or subset of galaxies is selected from the catalogue, their photo-zs are computed, and the differences between the observed and predicted photometry from the best-fit templates are recorded. This photometric offset is then applied to the sample, and the procedure iterates five times, after which the change in the derived offset is < 1%. There is no guarantee for the photo-z measurements to improve for spectroscopically confirmed galaxies according to this method, although often they do. The strength of this method is that a large and unbiased sample of galaxies can be used to correct for systematics in observed photometric bands or in specific wavelength regimes in the theoretical template set. By contrast, spectroscopic samples tend to be biased in one way or another, over-representing galaxies from which redshifts can easily be measured.
Unlike with LePhare, photometric uncertainties were not manually adjusted in specific bands when using EAZY. This is because EAZY uses a ‘template error function’ (Brammer et al. 2008) that serves a similar purpose. The template error function is designed to account for many of the causes of disagreement between the observed photometry and the theoretically predicted photometry from the template set. EAZY also provides two options for redshift priors, an observed K-band magnitude prior and an observed r-band magnitude prior. While the r-band is included in the DAWN survey wavelength coverage, high-redshift (z > 3) solutions were too strongly disfavoured when the r-band magnitude prior was used. Therefore, a magnitude-based redshift prior was not used.
To assist in star/galaxy separation, the built-in routines of EAZY were used to fit stellar templates provided with the code in the same manner described as in Weaver et al. (2022). The catalogues include the goodness of fit and effective temperature for the best-fit stellar template for each source.
4.3 Photometric redshift validation
Perhaps the most common method for validating photo-zs is to directly compare the measurements from SED fitting codes with reliable spectroscopic redshifts. The obvious advantage of this approach is that it involves a direct comparison with ‘ground truth’ for spectroscopic sources. To this end, the spectroscopic samples described above in Sect. 4.1 were employed for the respective fields. Galaxies were matched between the spectroscopic catalogues and the photometric catalogues using a matching radius of 0.5 arcseconds, yielding a total of 36 500 spectroscopic matches in EDF-N and 3300 matches in EDF-F. For EDF-N, the sample was reduced to 1300 to provide more uniform sampling in redshift space. To assess the quality of the photo-zs, summary statistics regularly used in the literature were calculated. The first quantifies the precision and is the normalised median absolute deviation (NMAD; Hoaglin et al. 1983), defined as
 (1)
(1)
following Brammer et al. (2008). The second statistic is a measure of purity, and it quantifies the rate of ‘catastrophic’ outliers (given by η) as the fraction of galaxies that differ from their spec-z by |∆z| > 0.15(1 + zspec) (Hildebrandt et al. 2012).
A comparison between photo-zs and spec-zs is presented in Fig. 8, where galaxies have been separated into different intervals depending on their apparent magnitude in the HSC i band. Here, the EDF-F photometry and matched-spectroscopic sample is highlighted, as it provides dense sampling across redshift and magnitude. In Appendix C, a comparison between photometric redshifts in EDF-N and spectroscopic redshifts matched from the Early Data Release of the Dark Energy Spectroscopic Instrument (DESI Collaboration 2024) is provided. Globally, excellent agreement is found between photometric and spectroscopic redshifts with both EAZY and LePhare, despite the lack of near-infrared photometry. For galaxies with HSC i magnitudes between 17 < i < 24, both codes achieve a strong precision of σNMAD ~ 0.035 and an outlier fraction η < 7%. As is to be expected, the photo-z performance generally declines for fainter objects, both in terms of σNMAD and the outlier fraction η. The performance of the two codes, based on comparison with spectroscopic galaxies, is broadly similar.
Another approach to validate the output of the two photo-z codes was to compare their output with each other. This provided an opportunity to identify large-scale disagreements and biases between the two codes for the entire sample of galaxies. This comparison is shown in the bottom row of Fig. 8. Generally, there is good agreement between the two codes across redshift, despite the many differences in the respective templates considered. As to be expected, fainter galaxies disagree in their photo-z assignment more frequently. The majority of galaxies that are off-diagonal on either side of the 1:1 relation are due to disagreements in spectral ‘breaks’ that cause strong colours and are typically indicative of a particular redshift. The two most prominent in the case of SED fitting are the Lyman and Balmer breaks, and their confusion interchanges high- and low-redshift solutions. Further discussion of validating photo-z estimates is provided in Appendix D.
A significant feature of photo-z measurement is the uncertainty associated with the measurement. Calculated correctly, the uncertainty is informative of the confidence of the photo-z measurement. One method for investigating the reliability of the photo-z uncertainties consists of measuring the cumulative fraction of galaxies with spectroscopic redshifts contained within the interval ![Mathematical equation: $\left[ {z_{{\rm{phot}}}^{\min },z_{{\rm{phot}}}^{\max }} \right]$](/articles/aa/full_html/2025/03/aa51857-24/aa51857-24-eq2.png) as a function of the photo-z uncertainty. If the uncertainty is adequately measured, then the cumulative fraction of galaxies with spectroscopic redshifts enclosed within this interval should be approximately 0.68 when the photo-z uncertainty is 1σ. If too few galaxies are found to be within this interval, then one possible explanation is that the photo-z errors are underestimated (and vice versa). One way to address this problem is to modify the flux uncertainties that propagate through to the photo-z uncertainty.
as a function of the photo-z uncertainty. If the uncertainty is adequately measured, then the cumulative fraction of galaxies with spectroscopic redshifts enclosed within this interval should be approximately 0.68 when the photo-z uncertainty is 1σ. If too few galaxies are found to be within this interval, then one possible explanation is that the photo-z errors are underestimated (and vice versa). One way to address this problem is to modify the flux uncertainties that propagate through to the photo-z uncertainty.
The cumulative fraction of galaxies between |zspec − zphot| divided by the 1σ uncertainty is shown in Fig. 9, again for the EDF-F spectroscopic sample. Here, the 1σ uncertainty is defined as the maximum between  and
and  . Based on this exercise, both the EAZY and LePhare photo-z uncertainties appear well calibrated. In Weaver et al. (2022), only the brightest galaxies (17 < i < 22.5) in the COSMOS2020 catalogue created with aperture photometry (as opposed to with The Farmer; see text for details) actually reach 0.68 when the value of the x-axis is 1, while all other samples enclose less. In this way, the observed cumulative distribution function of this work may reflect a reliable photo-z uncertainty, albeit greater when compared to the results of Weaver et al. (2022). The exact shape and displacement of these curves relative to each other appears dependent on the spectroscopic sample, a feature also noted by Laigle et al. (2019). Following Weaver et al. (2022), a factor of two scaling was applied to the flux errors prior to SED fitting to improve the scaling of the photo-z uncertainties, a modification likewise necessary in both Laigle et al. (2016) and Weaver et al. (2022). However, a factor of three scaling was applied to the Spitzer/IRAC flux errors, given their more significant underestimation (see Fig. 5).
The full photo-z distributions according to EAZY and LePhare, are shown as histograms in Fig. 10 in four ranges of HSC i apparent magnitude. As expected, the distributions tend towards higher redshift with decreasing flux density. Greater photo-z bias may be present in the EAZY measurements, according to the noticeable structure at z > 3 in the brightest bins. A significant feature to note is the absence of galaxies above z = 6. This is consistent with the detection bands of this catalogue (HSC r + i + z) and the implied selection function, as galaxies above z = 6 are mostly detected in (observed-frame) near-infrared wavelengths. The absence of galaxies at z > 6 in these catalogues is therefore a further affirmation of the photo-z methods utilised in this work.
 |
Fig. 8 Validation of photometric redshifts (photo-zs) computed with two codes, EAZY and LePhare, in three bins of apparent HSC i magnitude. The black solid line represents a one-to-one relation, and the dashed lines enclose the photo-z at ±0.15(1 + zspec) representing galaxies typically considered non-outliers. The fraction of sources outside the dashed lines (denoted η) and the precision measured with the normalised absolute deviation (noted σNMAD) are indicated in each panel. Top: comparison between photo-zs and spec-zs. Galaxies shown are those from the EDF-F spectroscopic sample from GOODS-S (Garilli et al. 2021; Kodra et al. 2023). The photo-z measurements of EAZY are displayed as orange circles, while the photo-z measurements of LePhare are displayed as blue circles. Bottom: comparison between photo-zs as calculated with the two codes for the full sample of galaxies in EDF-F. The EAZY photo-zs are displayed along the x-axis while the LePhare photo-zs are displayed along the y-axis. Bin colouring increases on a logarithmic scale. |
5 Physical properties of galaxies
The SED fitting codes employed for photometric redshift estimation in Sect. 4 are also capable of providing estimates of the physical properties of galaxies. At present, the primary interest in this work was to constrain basic physical properties, including absolute magnitudes in particular broadband filters and galaxy stellar mass. Measurements of additional physical quantities from the DAWN survey data are deferred to future work.
For LePhare, the procedure used here followed both Laigle et al. (2016) and Weaver et al. (2022). The reader is referred to these works for a more detailed explanation for the estimation of physical parameters. In brief, a template library of BC03 (Bruzual & Charlot 2003) stellar population synthesis (SPS) models was generated and compared to the measured photometry after fixing the redshift to the derived photo-z for each source, in this case, the median photo-z of the P(z) distribution. Unlike the template library used in the photo-z estimation, which includes empirical SEDs from which physical properties cannot be derived, the BC03 SSP templates are fully synthetic and enable estimates of all the physical parameters that define the templates. The variable parameters among of the BC03 templates included stellar mass, metallicity, age, two parametrisations of star-formation history (exponentially declining and delayed), two dust attenuation curves, and a range of E(B − V) values.
As for EAZY, physical parameters of galaxies were measured simultaneously alongside redshifts during the SED fitting since the templates used in the photo-z estimation (described above in Sect. 4.2) are themselves fully synthetic. Weaver et al. (2022) found EAZY suitable for measuring physical parameters in addition to redshifts. However, the lack of near-infrared imaging in the DAWN survey PL catalogues presented a challenge in constraining the entire shape of galaxy SEDs when using non-linear combinations of basis templates. More specifically, the large gap in the wavelength coverage between HSC z and IRAC [3.6 µm], and the lack of constraints redder than IRAC [4.5 µm], enabled unphysical solutions at times. Examples included solutions with too-strong Balmer breaks and/or unrealistic observed-frame mid-infrared colours. For this reason, a detailed analysis of the quality of physical parameters as measured by EAZY is deferred to future work is. However, the physical properties of galaxies as measured by EAZY may be made available upon request.
The future combination of near-infrared data from Euclid with the UV/optical and infrared data from the DAWN survey will yield significantly improved physical parameter measurements from both EAZY and LePhare. In the remainder of this work, only the physical properties of galaxies as provided by the LePhare measurements are considered.
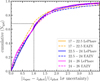 |
Fig. 9 Cumulative fraction of galaxies between |zspec − zphot| divided by the 1σ uncertainty for the EDF-F spectroscopic sample. For well calibrated photo-z uncertainties, the enclosed fraction (y-axis) should be equal to 0.68 when this ratio (x-axis) is equal to 1, highlighted by the dotted black line. The 1σ uncertainty is defined as the maximum between |


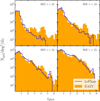 |
Fig. 10 Redshift distribution of galaxies included in the EDF-F catalogue according to EAZY (orange filled histogram) and LePhare (blue transparent histogram). Each panel considers a different selection of galaxies depending on their HSC i magnitude. |
5.1 Stellar mass reliability
A large body of work has been devoted to validating galaxy stellar masses measured from broadband photometry (e.g. Mobasher et al. 2015; Pacifici et al. 2023 and citations therein). The objective of this section is simply to demonstrate that the stellar masses presented in the DAWN survey PL catalogues, as measured with LePhare, are useful and reliable. However, unlike photometric redshifts, which may be compared to spectroscopic redshifts, there are no ‘ground truth’ measurements of the stellar masses of observed distant galaxies. Empirically, one straightforward option is to compare a set of stellar mass measurements with another reference set of measurements that has been validated in its own right. There is no such reference set available in the EDF-N and EDF-F for extensive comparison. Instead, the following test has been devised using the COSMOS2020 catalogue. Having been measured with some forty photometric bands and carefully vetted, the COSMOS2020 stellar masses are considered reliable. In addition, the COSMOS2020 catalogue includes all the photometric bands also contained by the DAWN survey PL catalogues presented in this work. With this in mind, stellar masses were measured from the COSMOS2020 catalogue using only photometry in bands present in both catalogues. From there, a comparison of the resulting stellar masses were made with the original stellar masses presented in Weaver et al. (2022).
COSMOS2020 does not only provide greater sampling in wavelength than the DAWN survey PL catalogues, but is also slightly deeper in the overlapping bands. Therefore, the test described above was made more realistic by further inflating the original photometric uncertainties of COSMOS2020 to broadly match the relationship between magnitude and magnitude error (i.e. the relationships of Fig. 5) of the DAWN survey PL catalogues. In practice, this consisted of modelling the relationship between magnitude and magnitude error with an exponential function of the form y = Aebx, where y is the magnitude error, x is the magnitude, and A and b are free parameters. The model was fit using least-squares optimisation for both the present catalogues and the COSMOS2020 catalogue, obtaining a functional relationship for each dataset. The magnitude errors of the COSMOS2020 catalogue were then rescaled by the ratio of the two functions, effectively applying a magnitude-dependent scaling factor, to match the relationship between magnitude and magnitude error of the DAWN survey PL catalogues. The corresponding modification was finally propagated to the flux errors.
Correctly measuring the stellar mass of a given galaxy depends on first correctly determining its redshift. To this end, LePhare was used to first fit for photometric redshifts and then for stellar masses using the modified COSMOS2020 dataset. The stellar mass was measured at the newly derived photometric redshift following the exact methods as described above (in Sect. 4.1). Good agreement was achieved between the newly estimated photometric redshifts and those presented in Weaver et al. (2022) and even with the COSMOS spectroscopic sample. At bright magnitudes (HSC i < 15), less than 6% of objects strongly disagree in their redshift determination. This comparison of photo-z is more fully in Appendix D.
A comparison between stellar masses computed only with the bands overlapping between the present DAWN survey PL catalogues (‘PL’) and of COSMOS2020 (‘All’) is presented in six redshift bins in Fig. 11. Here, galaxies with |∆z| < 0.15(1 + zPhot, all) are selected (see Fig. D.1 for a comparison of photo-z). This selection effectively removes disagreements in stellar mass that are driven by disagreements in the assumed redshift. An additional requirement was to have a S/N of at least three in Spitzer/IRAC [4.5 µm] and either the HSC z band or the HSC i band. The agreement is strong across both redshift and mass: there appears to be a small, variable offset of <0.1 dex, and a spread that varies between 0.1 and0.2 dex (1σ). The variable off-set in stellar mass is consistent with the uncertainties of stellar masses measured from SED fitting, which are typically of order 0.1–0.3 dex. The spread, on the other hand, is driven mostly by differences in photometric redshift. Selecting samples with smaller differences in measured redshifts decreases the spread. Indeed, as discussed in Appendix D, disagreement in photo-z is virtually entirely responsible for disagreement in stellar mass estimates.
It is emphasised that the same template set was used in both the work of Weaver et al. (2022) and the present work and fit to the same photometry, although only a subset of the photometry (with increased flux uncertainties) was used herein. Accordingly, some amount of agreement is to be expected. However, the test presented here demonstrates that both photo-zs and stellar masses are very reliably constrained using the filter set of the DAWN survey PL catalogues.
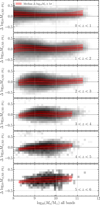 |
Fig. 11 Validation of stellar masses as a function of redshift measured using photometry in the bandpasses included by the present DAWN survey PL catalogues. Each panel shows the difference in stellar mass measured using the COSMOS2020 catalogue (Weaver et al. 2022) when using only the present DAWN bandpasses (‘PL’) and all forty (‘All’) of the original bandpasses of COSMOS2020. The medians are indicated by the red lines, and the shaded envelopes enclose 68% of the sources corresponding to 1σ. |
5.2 Stellar mass completeness
A key characteristic of every galaxy survey is its selection function. The selection function directly relates to various completeness limits (e.g. flux, colour, stellar mass, and intersections of such qualities). For many science investigations, the stellar mass completeness limit is of primary interest. In an ideal case, the mapping between the selection function and the completeness limit is roughly linear. This is the basis for the empirical method of measuring stellar mass completeness limits presented by Pozzetti et al. (2010). The method consists of converting the detection limit of a given survey to a stellar mass completeness limit by first inferring a mass-to-light ratio, applying a transformation to the measured stellar masses given the difference between their measured flux and the limiting flux, and using the rescaled stellar masses to describe the completeness limit. Many works (Ilbert et al. 2013; Laigle et al. 2016; Weaver et al. 2022) have used this method to arrive at an analytical description of the stellar mass completeness limit. The crucial assumption of this method is that the selection function can be reduced to a detection limit and that the detection limit maps linearly to the stellar mass limit.
The challenge of describing the stellar mass completeness limit of the present DAWN survey PL catalogues was that the above assumption does not hold for all galaxies. In general, galaxy stellar masses are most directly correlated with rest-frame optical emission. Therefore, selection functions defined by a domain of wavelength mostly trace stellar mass within redshift ranges where rest-frame optical emission is observed (with the exception of galaxies with very young and intrinsically blue stellar populations, for which rest-frame optical emission is not as representative of stellar mass). For the DAWN survey PL catalogues, the selection function is defined by the wavelength domain represented by the HSC r + i + z filters. Accordingly, rest-frame optical emission falls out of this wavelength domain by z ~ 1.5. As demonstrated by Fig. 10, included in the DAWN survey PL catalogues are many galaxies at z > 1.5, motivating an alternative method to the one presented by Pozzetti et al. (2010). However, as previously stated, future catalogues from the DAWN survey will include galaxies selected from the near-infrared imaging of Euclid, which will overcome some of these limitations and significantly improve mass-completeness.
One alternative to the Pozzetti et al. (2010) method is to use a reference survey with well understood characteristics that is deeper than the survey at hand, matching detections from the latter to the former, and quantifying the fraction of galaxies that are missed. In general, many works combine the Pozzetti et al. (2010) method with the one just described (Davidzon et al. 2017; Weaver et al. 2022, 2023a). As previously stated in Sect. 5.1, there is no such reference survey overlapping with the EDF-N and EDF-F fields with extensive and well vetted stellar mass measurements. The solution presented here was to perform a comparison test similar to the one used to validate the method for measuring stellar masses. In this case, the test began with creating a detection image with the same properties of the detection image used for the DAWN survey PL catalogues (Sect. 3.1), but using the COSMOS2020 images. By construction, the galaxies detected on the modified image are defined by the selection function of the DAWN survey PL catalogues. As such, a comparison was made between the newly detected galaxies and those originally included in Weaver et al. (2022) to obtain an empirical description of the selection function.
To adequately represent the DAWN survey PL selection function, the modified COSMOS2020 detection image must share the characteristics of the DAWN survey PL detection image, including wavelength domain and sky noise. Achieving an equivalent wavelength domain solely required limiting the included images to the HSC r + i + z images. As the original COSMOS2020 images are deeper than the H20 images, each of these images were then individually modified to share the same level of noise across the image plane to its corresponding H20 counterpart. This was achieved by measuring the per-pixel RMS variation in both the original COSMOS2020 images and the H20 images and adding random noise (drawn from a Gaussian distribution) to the former such that the median resulting RMS agrees with the H20 RMS. This operation was performed on each of the three filters. The modified COSMOS2020 images were finally combined and sources were detected following the procedure presented in Sect. 3.1.
Finally, the present DAWN survey PL catalogue selection function, as viewed through the COSMOS2020 dataset, was characterised. First, a two-dimensional histogram describing the number of galaxies as a function of redshift and stellar mass was measured from the original COSMOS2020 catalogue. Then, a second two-dimensional histogram was measured according to the same properties, but limited to include only the galaxies that are detected using the modified COSMOS2020 detection image. The ratio of these two histograms describes the influence of the present selection function on the stellar mass completeness as a function of redshift. This result is depicted in Fig. 12. For comparison, also included are the analytical stellar mass completeness curves for the COSMOS2015 catalogue (Laigle et al. 2016) and the COSMOS2020 catalogue (Weaver et al. 2022). The fraction of galaxies detected is essentially 100% within the COSMOS2015 stellar mass completeness limit out to z = 1.5. Beyond this redshift, the DAWN survey PL selection function does not include rest-frame optical emission, so the fraction of detected galaxies drops to between 80 and 90% until z ~ 4. Many galaxies are detected at z > 4, but the fraction decreases with increasing redshift as galaxies continue to fall out of the detection bands. There are further two notable features that stand out in the redshift range 2 < z < 4 corresponding to massive and low-mass galaxies. Regarding massive galaxies, there is a subset of galaxies within this redshift range with log10(M⋆/M⊙) > 10.2 that are not detected, comprising ~25% of all galaxies with those qualities. According to their rest-frame colours as presented in Weaver et al. (2022), these galaxies are red, dusty, and only detectable with near-infrared coverage. The fraction of detected low-mass galaxies (below the COSMOS2015 completeness limit), on the other hand, increases in the range 2 < z < 4. At these redshifts, the DAWN PL detection bands probe bluer wavelengths, becoming more sensitive to star formation. These low-mass galaxies are likely UV-dominated, making them easily detected.
In its present state, the DAWN survey PL catalogues are well suited for characterising galaxies as a function of stellar mass, at least at z < 2, though careful efforts to account for missing objects may be taken to extend analyses to z ~ 4 and above. Future catalogues produced by the DAWN survey in the EDFs and EAFs will yield samples of galaxy populations exceeding the mass-completeness achieved by COMSOS2020 through detection on the even deeper Euclid near-infrared imaging.
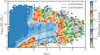 |
Fig. 12 Empirical description of the DAWN survey PL selection function as viewed through the COSMOS2020 dataset. Each cell represents the fraction of galaxies detected from the original COSMOS2020 catalogue (Weaver et al. 2022) according to the DAWN survey PL selection function. The dotted line represents the COSMOS2015 stellar mass completeness limit (Laigle et al. 2016), while the dashed line represents the COSMOS2020 stellar mass completeness limit (Weaver et al. 2023a). Future catalogues selected on near-infrared imaging provided by Euclid will enhance the mass completeness of galaxies beyond z ~ 2. |
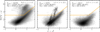 |
Fig. 13 Rest-frame colour-colour diagram classifying galaxies as either star forming or quiescent in the DAWN survey PL EDF-F catalogue. Star-forming galaxies are labelled as ‘SF’ and quiescent galaxies are labelled as ‘Q’. The COSMOS2015 (Laigle et al. 2016) stellar mass completeness has been assumed (see Fig. 12). The bounding region discriminating the two populations is provided by Ilbert et al. (2013). The fraction of quiescent galaxies decreases with increasing redshift, due to both physical and observational effects driven by the present DAWN selection function. Future catalogues selected on near-infrared imaging provided by Euclid will enhance both the detection and identification of quiescent galaxies out to z ~ 3. |
5.3 Galaxy classification
Galaxies were classified as either star-forming or quiescent using absolute magnitudes measured by LePhare. More specifically, quiescent and star-forming galaxies were identified via their location in the rest-frame NUV − r versus r − J diagram following the approach described in Ilbert et al. (2013). Here, quiescent galaxies were defined as those with MNUV − Mr > 3(Mr − MJ) + 1 and MNUV − Mr > 3.1. Absolute magnitudes were calculated according to the procedure given in the appendix of Ilbert et al. (2005), where the absolute magnitude in a given filter λabs is constrained by the observed-frame filter nearest to λabs(1 + z). This minimises the dependence of the k-correction on the assumed galaxy template.
It is important to note that without the near-infrared photometry provided by Euclid, there is not any redshift with direct overlapping wavelength coverage between the current observed filters and all of the rest-frame diagnostic filters. Beyond redshift z = 1.5, the 4000 Å break is redshifted out of the detection filters, suggesting that the completeness of the quiescent galaxy sample will drop off (analogous to stellar mass completeness). At this point, only rest-frame NUV and rest-frame J are directly constrained by the DAWN survey PL catalogues, until z = 3.5. Beyond z = 3.5 direct overlap with the rest-frame NUV decreases. Therefore, the best-fit template was relied on to infer absolute magnitude in at least one of the three diagnostic filters at all redshifts.
Figure 13 shows the breakdown of quiescent and star-forming galaxies in the rest-frame NUVrJ diagram separated in three redshift bins from z = 0.2 to z = 3.5 assuming the COSMOS2015 stellar mass completeness (see Fig. 12). The fraction of quiescent galaxies increases dramatically from high to low-redshift for well documented physical reasons (Ilbert et al. 2010; Behroozi et al. 2013; Weaver et al. 2023a) in addition to the observational effects described above. Though the uncertainties in the rest-frame colours may be substantial, the large cosmic volume covered by the H20 dataset should provide legitimate quiescent galaxies, and future works will investigate their rate of false positive classification. Finally, the imminent addition of Euclid near-infrared photometry and detection will dramatically enhance the identification of quiescent galaxies throughout the redshift ranges considered here.
6 Summary
This paper describes the creation and contents of the first public multiwavelength catalogues from the Cosmic Dawn Survey (DAWN) consisting of pre-launch (PL) data, that is, without Euclid photometry. In this first release, photometry was measured from H20 survey data, which includes deep ultraviolet and optical ground-based imaging from CFHT MegaCam and Subaru HSC, respectively. These data were paired with deep infrared imaging across EDF-N and EDF-F provided by the DAWN survey (Euclid Collaboration: Moneti et al. 2022) Spitzer/IRAC data, where the primary contribution is from the SLS (Capak et al. 2016). In addition to photometry and photometric uncertainties, photometric redshifts and estimates of galaxy physical parameters were measured from two SED fitting codes, EAZY and LePhare. These catalogues represent the deepest available UV/optical photometry covering EDF-N and EDF-F, as well as the deepest Spitzer photometry over any such area of this extent.
The EDF-N DAWN survey PL catalogue spans 16.87 deg2 with 9.37 deg2 completed to final survey depth in all bands. The EDF-F DAWN survey PL catalogue spans 2.85 deg2 with 1.77 deg2 completed to final survey depth. Sources were detected in the HSC r + i + z bands. In total, 5186 819 objects were detected over the 16.87 deg2 area of the PL EDF-N catalogue, where 3 513 111 of the detected objects are in the 9.37 deg2 full-depth region. In EDF-F, 1061645 objects were detected over the PL 2.85 deg2 PL area, where 717 678 are in the 1.77 deg2 full-depth region. Model-based photometry was measured using The Farmer from all publicly available CFHT MegaCam u band, Subaru HSC, and Spitzer/IRAC imaging overlapping EDF-N and EDF-F. The two catalogues were then used to measure photometric redshifts and galaxy properties with the SED fitting codes EAZY and LePhare. The two codes show general agreement for the majority of sources with a high S/N, but disagree for fainter objects. Photometric redshifts achieve strong performance compared to our spectroscopic sample, with an outlier fraction of less than 10% for galaxies brighter than HSC i = 25, and a precision of σNMAD ~ 0.06(1 + z) for the same sample. Stellar masses are found to be reliable and rest-frame colours are sufficiently constrained for identifying galaxies as star-forming and quiescent to z ~ 3. However, rest-frame optical emission falls out of the selection function of the present DAWN catalogues by z ~ 1.5, impacting both stellar mass completeness and the numbers of quiescent galaxies detected.
As further Subaru HSC imaging is acquired, the full-depth areas in both EDF-N and EDF-F will continue to grow to their respective final goals of 20 deg2 for EDF-N and 10 deg2 for EDF-F. Even more significantly, Euclid will soon provide deep near-infrared imaging across these fields and the other EDFs and EAFs. Upon the acquisition of Euclid data, the Euclid near-infrared imaging will be used to create a new detection image resulting in a near-infrared selected catalogue. Together with Euclid, the Cosmic Dawn Survey data will enable scientific investigations out to z ~ 10, firmly through the epoch of reionisation, as described by Euclid Collaboration: McPartland et al. (2025). The Cosmic Dawn Survey catalogues will be updated continually as new ground-based and space-based data is processed, and new releases will be made publicly available on our website (further described in Appendix A).
Data availability
A copy of the catalogues is available at the CDS via anonymous ftp to cdsarc.cds.unistra.fr (130.79.128.5) or via https://cdsarc.cds.unistra.fr/viz-bin/cat/J/A+A/695/A229
Acknowledgements
The Cosmic Dawn Center (DAWN) is funded by the Danish National Research Foundation under grant DNRF140. The Hyper Suprime-Cam (HSC) collaboration includes the astronomical communities of Japan and Taiwan, and Princeton University. The HSC instrumentation and software were developed by the National Astronomical Observatory of Japan (NAOJ), the Kavli Institute for the Physics and Mathematics of the Universe (Kavli IPMU), the University of Tokyo, the High Energy Accelerator Research Organization (KEK), the Academia Sinica Institute for Astronomy and Astrophysics in Taiwan (ASIAA), and Princeton University. Funding was contributed by the FIRST program from Japanese Cabinet Office, the Ministry of Education, Culture, Sports, Science and Technology (MEXT), the Japan Society for the Promotion of Science (JSPS), Japan Science and Technology Agency (JST), the Toray Science Foundation, NAOJ, Kavli IPMU, KEK, ASIAA, and Princeton University. This work was made possible by utilising the CANDIDE cluster at the Institut d’Astrophysique de Paris,which was funded through grants from the PNCG,CNES, DIM-ACAV, and the Cosmic Dawn Center and maintained by S. Rouberol. This paper makes use of software developed for the Large Synoptic Survey Telescope. We thank the LSST Project for making their code available as free software at http://dm.lsst.org. The Pan-STARRS1 Surveys (PS1) have been made possible through contributions of the Institute for Astronomy, the University of Hawaii, the Pan-STARRS Project Office, the Max-Planck Society and its participating institutes, the Max Planck Institute for Astronomy, Heidelberg and the Max Planck Institute for Extraterrestrial Physics, Garching, The Johns Hopkins University, Durham University, the University of Edinburgh, Queen’s University Belfast, the Harvard-Smithsonian Center for Astrophysics, the Las Cumbres Observatory Global Telescope Network Incorporated, the National Central University of Taiwan, the Space Telescope Science Institute, the National Aeronautics and Space Administration under Grant No. NNX08AR22G issued through the Planetary Science Division of the NASA Science Mission Directorate, the National Science Foundation under Grant No. AST-1238877, the University of Maryland, and Eotvos Lorand University (ELTE) and the Los Alamos National Laboratory. Based in part on data collected at the Subaru Telescope and retrieved from the HSC data archive system, which is operated by Subaru Telescope and Astronomy Data Center at National Astronomical Observatory of Japan. Some of The data presented herein were obtained at the W. M. Keck Observatory, which is operated as a scientific partnership among the California Institute of Technology, the University of California and the National Aeronautics and Space Administration. The Observatory was made possible by the generous financial support of the W. M. Keck Foundation. Based on observations obtained with MegaPrime/MegaCam, a joint project of CFHT and CEA/DAPNIA, at the Canada-France-Hawaii Telescope (CFHT) which is operated by the National Research Council (NRC) of Canada, the Institut National des Science de l’Univers of the Centre National de la Recherche Scientifique (CNRS) of France, and the University of Hawaii. The observations at the Canada-France-Hawaii Telescope were performed with care and respect from the summit of Maunakea which is a significant cultural and historic site. This work is based in part on observations made with the Spitzer Space Telescope, which was operated by the Jet Propulsion Laboratory, California Institute of Technology under a contract with NASA. Support for this work was provided by NASA through an award issued by JPL/Caltech. The authors wish to recognise and acknowledge the very significant cultural role and reverence that the summit of Maunakea has always had within the indigenous Hawaiian community. We are most fortunate to have the opportunity to conduct observations from this mountain. The Euclid Consortium acknowledges the European Space Agency and a number of agencies and institutes that have supported the development of Euclid, in particular the Agenzia Spaziale Italiana, the Austrian Forschungsförderungsgesellschaft funded through BMK, the Belgian Science Policy, the Canadian Euclid Consortium, the Deutsches Zentrum für Luft- und Raumfahrt, the DTU Space and the Niels Bohr Institute in Denmark, the French Centre National d’Etudes Spatiales, the Fundaçâo para a Ciência e a Tecnologia, the Hungarian Academy of Sciences, the Ministerio de Ciencia, Innovación y Universidades, the National Aeronautics and Space Administration, the National Astronomical Observatory of Japan, the Netherlandse Onderzoekschool Voor Astronomie, the Norwegian Space Agency, the Research Council of Finland, the Romanian Space Agency, the State Secretariat for Education, Research, and Innovation (SERI) at the Swiss Space Office (SSO), and the United Kingdom Space Agency. A complete and detailed list is available on the Euclid web site (www.euclid-ec.org).
Appendix A Data release
DAWN survey PL catalogue columns used for the creation of figures in this work.
The DAWN survey PL catalogues are currently hosted in an online repository, accessible with a username and password3. Please contact the authors of this work for access. As further ground-based data are obtained and reduced, updated catalogues will be produced and shared therein. Included alongside the catalogues are README files explaining the contents of each catalogue (e.g. column naming conventions). Table A.1 provides a description of the main columns used to produce the figures of this work. As described above (e.g. Fig. 1, Sect. 2, Sect. 2.4) Spitzer/IRAC imaging is not available across the entirety of the 20 deg2 survey area of EDF-N but only the innermost 10 deg2 area. Accordingly, there is significant variation in the quality of galaxy properties measured from SED fitting for sources that lack Spitzer/IRAC photometry. Although these sources may be appropriately studied via their CFHT and HSC photometry, caution is advised if considering SED-inferred properties for sources lacking Spitzer/IRAC coverage.
Appendix B Image depths continued
The following further describes the method and caveats of measuring limiting magnitudes (Sect. B). The dispersion of empty aperture fluxes is expected to follow an approximately Gaussian distribution, assuming proper image processing (i.e. flat fielding and background subtraction) and that the apertures do not capture object flux. One important consideration is adequate sampling of the image on scales relevant to the expected variation. Using a small number of apertures spread across an image can only capture variation on the largest scales. Further care with respect to the sample size of the empty aperture fluxes is especially needed if an operation such as a sigma-clip is to be performed; with a small sample, a sigma-clip will remove measurements that are not actually outside the true underlying population distribution (i.e. the sample standard deviation will not approximate the population standard deviation). For example, in the measurements presented here, using only 1 aperture per 100 square arcseconds resulted in a limiting magnitude ~0.4 mag deeper than using 1 aperture per 5 square arcseconds.
Another challenge in measuring limiting magnitudes and image depths using dispersion of empty aperture fluxes is properly accounting for the contribution to the dispersion by undetected astronomical sources. As previously described, the method relies on placing apertures away from astronomical sources because apertures placed near sources will bias the measurement towards greater dispersion. However, given a flux threshold for source detection, it is impossible to detect every single object. Every survey fails to detect some number of sources in a trade-off between completeness, detecting more sources, and purity, not detecting spurious objects. Accordingly, apertures placed away from detected sources inevitably fall upon some number of sources that are not detected in the first place. The usual approach to account for undetected sources is to simply sigma-clip the measured distribution of aperture fluxes. However, the undetected sources are not all contained within the tail of the distribution (i.e. outside some standard deviation), and a sigma-clip does not solve the problem of the bias. The apertures landing on or near undetected sources create a non-Gaussian distribution of measured fluxes, and applying a sigma-clip may not lead to informative statistics.
In general, faint undetected sources have the effect of shifting the entire distribution of empty aperture fluxes towards positive values (i.e. a translation), as the brightness of the missed objects approaches the sky background while exceeding intrinsic background variation. These sources are not problematic and are effectively accounted for in background subtraction during image processing. Brighter undetected objects, on the other hand, broaden the distribution at values greater than the median (typically a value of 0) in addition to creating a tail towards even larger values and therefore a skewed distribution. Consequently, the values greater than the median (the positive component) are biased in a way that values less than the median (the negative component) are not.
In light of the above, the true profile of the distribution of empty aperture fluxes may be extracted through careful consideration of the negative component of the distribution. This was achieved by modelling the distribution with a Gaussian function in the domain of fluxes spanned by [µ0 − 3σ0, µ0 + σ0], where σ0 is the standard deviation of the sigma-clipped fluxes and µ0 is the median. This domain effectively gives more weight to the negative component than to the positive component. The values of the fit are typically more robust than the point statistic measured on the full distribution. However, even this sigma-clipped distribution can be affected by undetected astronomical sources and accordingly broadened beyond the value corresponding to the variation of the sky background. With robust initial values provided by the first model fit, the impact of the contaminated fluxes was further limited by performing a second Gaussian fit, this time considering only data points in the domain [−2σ1,fit, μ1,fit + 0.5σ1,fit]. Here, σ1,fit is the standard deviation of the first Gaussian fit, and μ1,fit is the mean of the first Gaussian fit.
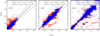 |
Fig. C.1 Photometric redshifts in EDF-N compared with spectroscopic measurements matched from the Early Data Release of the Dark Energy Spectroscopic Instrument. Galaxies are separated according to their DESI target names: “BGS”, “LRG”, and “ELG”. |
In general, measuring the standard deviation from the distribution of sigma-clipped fluxes, without modelling, results in a shallower limiting magnitude of order ~0.2 mag. While it may not be strictly necessary to include more than one iteration of Gaussian model fitting, the first is useful for identifying a reliable domain for the model fit during the final measurement as well as initial values for the model. Further, the method appears to perform equally well for all bands from CFHT-u through Spitzer/IRAC [4.5 µm], as indicated by Fig. 3. The measured depth of the Spitzer/IRAC data matches the expectation of the SLS (Capak et al. 2016), and the significantly deeper region of Spitzer/IRAC data in EDF-F pointed out by Euclid Collaboration: Moneti et al. (2022) is visible as well at the appropriate depth.
Appendix C Photometric redshift validation with DESI
In this section, a brief comparison between photometric redshifts (photo-z) in EDF-N and spectroscopic redshifts (spec-z) matched from the Early Data Release of the Dark Energy Spectroscopic Instrument (DESI Collaboration 2024) is provided. Galaxies were matched to the DESI spectroscopic catalogue within 0.5″. A total of 36 500 galaxies were matched. The comparison between is shown in Fig. C.1 in a similar style to the top panel of Fig. 8. All sources selected by DESI are bright in comparison to the depths of the DAWN survey PL catalogues. Instead of separating the galaxies by apparent magnitude, galaxies are separated according to their DESI target names, including “BGS” (bright galaxy sample), “LRG” (luminous red galaxy), and “ELG” (emission line galaxy). In every category, LePhare significantly outperforms EAZY for reasons that are not fully understood. The most likely explanation is that the template set of LePhare includes empirical templates that are known to perform well for the relatively nearby and bright galaxies sampled by DESI, while the template set of EAZY is entirely synthetic and may not include the most useful templates for this comparison. It is noted that many of the EAZY outliers are located at photo-zs that are outside of the boundaries of the figure. Both codes perform more poorly for the ELG sample, which may be expected, as galaxies with prominent emission lines can be difficult to model correctly from photometry, and prescriptions for adding emission lines to templates vary substantially. Overall, the comparison is promising, especially between LePhare and the BGS and LRG samples.
Appendix D Further validation with COSMOS2020
The validation of stellar masses presented in Sect. 5.1 is supplemented here by a brief discussion of photometric redshifts (photo-zs). Correctly measuring the stellar mass of a galaxy requires first correctly measuring its redshift; changes in the redshift will be propagated to changes in the stellar mass. Thus, in order to compare stellar masses measured with photometry from the bandpasses included in the present DAWN survey PL catalogue, the photo-zs must first be measured. To measure photo-zs for the modified COSMOS2020 catalogue, the procedure for LePhare described in Sect. 4.1 and the procedure for EAZY described in Sect. 4.2 were both followed, respectively. To reiterate, the methods for calculating photo-z were exactly the same as for the DAWN survey PL catalogue, but the input catalogue was changed to the modified COSMOS2020 catalogue containing only photometry measured in the DAWN survey PL bandpasses and with inflated flux errors corresponding to the measured relationship between magnitude and magnitude error in the DAWN survey PL catalogues (i.e. Fig. 5). The top panel of Fig. D.1 presents a comparison between photo-zs measured with the two codes and spec-zs. The bottom panel of Fig. D.1 presents a comparison between photo-zs measured with LePhare using the modified COSMOS2020 catalogue and the original photo-z measurements presented in Weaver et al. (2022) using all forty bands. The agreement between photo-zs and spec-zs is strong across both EAZY and LePhare, and the performance of both code agrees well with the comparison presented in Fig. 8. This provides a further confirmation that redshifts are generally well constrained by the wavelength range spanned and sampled by the DAWN survey PL catalogues. In addition, considering the entire COSMOS2020 catalogue, the agreement between photo-zs measured with LePhare and only the DAWN survey PL catalogue filters compared to those of Weaver et al. (2022) is likewise strong, roughly mimicking the agreement between photo-zs and spec-zs. At magnitudes HSC i < 15 the fraction of galaxies with correct redshifts is nearly 95%. Even at HSC i > 15, more than 80% of all galaxies agree in their photo-zs when they are measured with the subset of bands available the DAWN survey PL catalogues.
Although the quality of the photo-z estimates presented herein are generally strong, users of the DAWN survey PL catalogues may benefit from consideration of where the photo-z estimates are weaker. A nearly universal consequence of estimating photo-zs is the degradation of the performance for both the brightest and the faintest objects. The former, with HSC i ~ 17–18, are predominantly at z < 1 , and their brightness results in an exceedingly large S/N such that even small differences in the predicted photometry from the best-fit template result in a large χ2 value. Galaxies belonging to the latter group, with HSC i >> 15, may be well fit by many templates, and hence their redshifts become more uncertain. It is well known that photo-z estimation is also difficult for galaxies that do not show strong colours in their photometry, resulting in an inability to easily distinguish Balmer and Lyman breaks. Such a situation is more common for fainter galaxies, which may not be bright enough to provide a sufficient signal to reliably constrain the rest-frame wavelength of both the Balmer and Lyman breaks simultaneously. However, as demonstrated by Weaver et al. (2022) (e.g. Sect. 5.3 and Fig. 14), even deep photometry measured in some forty bands from FUV to mid-infrared wavelengths is not enough to circumvent this problem.
One area of weakness unique to the current DAWN survey catalogues is the redshift range of approximately 1 .5 < z < 1.6. At these redshifts, the available filters do not sufficiently constrain either the Balmer break or the Lyman break. As illustrated by the lower row of Fig. D.1, an increased scatter is observed therein, primarily towards higher redshifts. The galaxies that appear to scatter from their true redshifts (or at least the redshifts reported by Weaver et al. (2022)) have weak UV/optical colours (e.g. u – g, g – r, r – i, i – z) but are red when comparing HSC z to Spitzer/IRAC [3.6 µm]. Accordingly, without a constraint on either of the two breaks, higher-redshift solutions are generally allowed because many solutions exist that are consistent with such colours. On the other hand, fewer lower-redshift solutions are allowed, as otherwise the Balmer break would have been observed, thus producing a stronger UV/optical colour. It is not until z ~ 1.6 that the observed-frame wavelength of the Lyman break exceeds 10% transmission in the CFHT u band and the scatter decreases. Users of the DAWN survey PL catalogues should be aware of the uncertain redshifts for such galaxies. However, the imminent inclusion of the Euclid NIR photometry will significantly improve photo-z estimation in this regime by constraining the Balmer break after it drops out of the HSC z band, at least until z ~ 4.
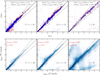 |
Fig. D.1 Photometric redshifts measured using the COSMOS2020 catalogue but limited to only the bands included in the present DAWN survey PL catalogues, namely, CFHT u, HSC grizy, and Spitzer/IRAC [3.6 µm] and [4.5 µm]. Further, the photometric uncertainties have been scaled to follow the relations for EDF-N depicted in Fig. 5. This figure is analogous to Fig. 8 except that the bottom panel compares only photometric redshifts measured with LePhare; the x-axis indicates the photo-zs measured with all forty bands of the COSMOS2020 catalogue, while the y-axis indicates the photo-zs measured with only the DAWN survey PL subset. |
References
- Aihara, H., AlSayyad, Y., Ando, M., et al. 2022, PASJ, 74, 247 [NASA ADS] [CrossRef] [Google Scholar]
- Arnouts, S., Moscardini, L., Vanzella, E., et al. 2002, MNRAS, 329, 355 [Google Scholar]
- Baba, H., Yasuda, N., Ichikawa, S.-I., et al. 2002, ASP Conf. Ser., 281, 298 [NASA ADS] [Google Scholar]
- Barbary, K. 2016, J. Open Source Softw., 1, 58 [Google Scholar]
- Behroozi, P. S., Wechsler, R. H., & Conroy, C. 2013, ApJ, 770, 57 [NASA ADS] [CrossRef] [Google Scholar]
- Bertin, E. 2010, Astrophysics Source Code Library [record ascl:1010.068] [Google Scholar]
- Bertin, E. 2013, Astrophysics Source Code Library [record ascl:1301.001] [Google Scholar]
- Bertin, E., & Arnouts, S. 1996, A&AS, 117, 393 [NASA ADS] [CrossRef] [EDP Sciences] [Google Scholar]
- Bertin, E., Mellier, Y., Radovich, M., et al. 2002, ASP Conf. Ser., 281, 228 [Google Scholar]
- Bosch, J., Armstrong, R., Bickerton, S., et al. 2018, PASJ, 70, S5 [Google Scholar]
- Boulade, O., Charlot, X., Abbon, P., et al. 2003, SPIE Conf. Ser., 4841, 72 [Google Scholar]
- Bouwens, R. J., Oesch, P. A., Stefanon, M., et al. 2021, AJ, 162, 47 [NASA ADS] [CrossRef] [Google Scholar]
- Brammer, G. B., van Dokkum, P. G., & Coppi, P. 2008, ApJ, 686, 1503 [Google Scholar]
- Bruzual, G., & Charlot, S. 2003, MNRAS, 344, 1000 [NASA ADS] [CrossRef] [Google Scholar]
- Capak, P., Arendt, R., Arnouts, S., et al. 2016, The Euclid/WFIRST Spitzer Legacy Survey, Spitzer Proposal [Google Scholar]
- Chabrier, G. 2003, PASP, 115, 763 [Google Scholar]
- Chambers, K. C., Magnier, E. A., Metcalfe, N., et al. 2016, arXiv e-prints [arXiv:1612.05560] [Google Scholar]
- Chávez Ortiz, Ó. A., Finkelstein, S. L., Davis, D., et al. 2023, ApJ, 952, 110 [NASA ADS] [CrossRef] [Google Scholar]
- Cuillandre, J.-C. J., Withington, K., Hudelot, P., et al. 2012, SPIE Conf. Ser., 8448, 84480M [NASA ADS] [Google Scholar]
- Davidzon, I., Ilbert, O., Laigle, C., et al. 2017, A&A, 605, A70 [NASA ADS] [CrossRef] [EDP Sciences] [Google Scholar]
- Davidzon, I., Jegatheesan, K., Ilbert, O., et al. 2022, A&A, 665, A34 [NASA ADS] [CrossRef] [EDP Sciences] [Google Scholar]
- DESI Collaboration (Adame, A. G., et al.) 2024, AJ, 168, 58 [NASA ADS] [CrossRef] [Google Scholar]
- Despali, G., Giocoli, C., Angulo, R. E., et al. 2016, MNRAS, 456, 2486 [NASA ADS] [CrossRef] [Google Scholar]
- Drlica-Wagner, A., Sevilla-Noarbe, I., Rykoff, E. S., et al. 2018, ApJS, 235, 33 [Google Scholar]
- Euclid Collaboration (Moneti, A., et al.) 2022a, A&A, 658, A126 [NASA ADS] [CrossRef] [EDP Sciences] [Google Scholar]
- Euclid Collaboration (Scaramella, R., et al.) 2022b, A&A, 662, A112 [NASA ADS] [CrossRef] [EDP Sciences] [Google Scholar]
- Euclid Collaboration (McPartland, C. J. R., et al.) 2025, A&A, in press, https://doi.org/10.1051/0004-6361/202451849 [Google Scholar]
- Euclid Collaboration (Mellier, Y., et al.) 2025, A&A, in press, https://doi.org/10.1051/0004-6361/202450810 [Google Scholar]
- Faber, S. M., Phillips, A. C., Kibrick, R. I., et al. 2003, Proc. SPIE, 4841, 1657 [NASA ADS] [CrossRef] [Google Scholar]
- Gaia Collaboration (Brown, A. G. A., et al.) 2016a, A&A, 595, A2 [NASA ADS] [CrossRef] [EDP Sciences] [Google Scholar]
- Gaia Collaboration (Prusti, T., et al.) 2016b, A&A, 595, A1 [NASA ADS] [CrossRef] [EDP Sciences] [Google Scholar]
- Gaia Collaboration (Vallenari, A., et al.) 2023, A&A, 674, A1 [NASA ADS] [CrossRef] [EDP Sciences] [Google Scholar]
- Garilli, B., McLure, R., Pentericci, L., et al. 2021, A&A, 647, A150 [NASA ADS] [CrossRef] [EDP Sciences] [Google Scholar]
- Goto, T., Toba, Y., Utsumi, Y., et al. 2017, Pub. Korean Astron. Soc., 32, 225 [Google Scholar]
- Gould, K. M. L., Brammer, G., Valentino, F., et al. 2023, AJ, 165, 248 [NASA ADS] [CrossRef] [Google Scholar]
- Hildebrandt, H., Erben, T., Kuijken, K., et al. 2012, MNRAS, 421, 2355 [Google Scholar]
- Hoaglin, D. C., Mosteller, F., & Tukey, J. W. 1983, Understanding Robust and Exploratory Data Anlysis, (Hoboken: Wiley) [Google Scholar]
- Ilbert, O., Tresse, L., Zucca, E., et al. 2005, A&A, 439, 863 [NASA ADS] [CrossRef] [EDP Sciences] [Google Scholar]
- Ilbert, O., Arnouts, S., McCracken, H. J., et al. 2006, A&A, 457, 841 [NASA ADS] [CrossRef] [EDP Sciences] [Google Scholar]
- Ilbert, O., Salvato, M., Le Floc'h, E., et al. 2010, ApJ, 709, 644 [NASA ADS] [CrossRef] [Google Scholar]
- Ilbert, O., McCracken, H. J., Le Fèvre, O., et al. 2013, A&A, 556, A55 [NASA ADS] [CrossRef] [EDP Sciences] [Google Scholar]
- Ito, K., Tanaka, M., Miyaji, T., et al. 2022, ApJ, 929, 53 [NASA ADS] [CrossRef] [Google Scholar]
- Kauffmann, O. B., Ilbert, O., Weaver, J. R., et al. 2022, A&A, 667, A65 [NASA ADS] [CrossRef] [EDP Sciences] [Google Scholar]
- Kodra, D., Andrews, B. H., Newman, J. A., et al. 2023, ApJ, 942, 36 [NASA ADS] [CrossRef] [Google Scholar]
- Kollmeier, J. A., Zasowski, G., Rix, H.-W., et al. 2017, arXiv e-prints [arXiv:1711.03234] [Google Scholar]
- Laigle, C., McCracken, H. J., Ilbert, O., et al. 2016, ApJS, 224, 24 [Google Scholar]
- Laigle, C., Davidzon, I., Ilbert, O., et al. 2019, MNRAS, 486, 5104 [Google Scholar]
- Lang, D., Hogg, D. W., & Mykytyn, D. 2016, Astrophysics Source Code Library [record ascl:1604.008] [Google Scholar]
- Laureijs, R., Amiaux, J., Arduini, S., et al. 2011, arXiv e-prints [arXiv:1110.3193] [Google Scholar]
- Lindegren, L., Lammers, U., Bastian, U., et al. 2016, A&A, 595, A4 [NASA ADS] [CrossRef] [EDP Sciences] [Google Scholar]
- Marmo, C., & Bertin, E. 2010, Astrophysics Source Code Library [record ascl:1010.069] [Google Scholar]
- Miyazaki, S., Komiyama, Y., Kawanomoto, S., et al. 2018, PASJ, 70, S1 [NASA ADS] [Google Scholar]
- Mobasher, B., Dahlen, T., Ferguson, H. C., et al. 2015, ApJ, 808, 101 [NASA ADS] [CrossRef] [Google Scholar]
- Oi, N., Goto, T., Matsuhara, H., et al. 2021, MNRAS, 500, 5024 [Google Scholar]
- Oke, J. B. 1974, ApJS, 27, 21 [Google Scholar]
- Pacifici, C., Iyer, K. G., Mobasher, B., et al. 2023, ApJ, 944, 141 [NASA ADS] [CrossRef] [Google Scholar]
- Pozzetti, L., Bolzonella, M., Zucca, E., et al. 2010, A&A, 523, A13 [NASA ADS] [CrossRef] [EDP Sciences] [Google Scholar]
- Sawicki, M., Arnouts, S., Huang, J., et al. 2019, MNRAS, 489, 5202 [NASA ADS] [Google Scholar]
- Scoville, N., Aussel, H., Brusa, M., et al. 2007, ApJS, 172, 1 [Google Scholar]
- Shuntov, M., McCracken, H. J., Gavazzi, R., et al. 2022, A&A, 664, A61 [NASA ADS] [CrossRef] [EDP Sciences] [Google Scholar]
- Stevans, M. L., Finkelstein, S. L., Wold, I., et al. 2018, ApJ, 863, 63 [Google Scholar]
- Szalay, A. S., Connolly, A. J., & Szokoly, G. P. 1999, AJ, 117, 68 [Google Scholar]
- Taamoli, S., Mobasher, B., Chartab, N., et al. 2024, ApJ, 966, 18 [NASA ADS] [CrossRef] [Google Scholar]
- Taylor, A. J., Barger, A. J., Cowie, L. L., et al. 2023, ApJS, 266, 24 [Google Scholar]
- Weaver, J. R., Kauffmann, O. B., Ilbert, O., et al. 2022, ApJS, 258, 11 [NASA ADS] [CrossRef] [Google Scholar]
- Weaver, J. R., Davidzon, I., Toft, S., et al. 2023a, A&A, 677, A184 [NASA ADS] [CrossRef] [EDP Sciences] [Google Scholar]
- Weaver, J. R., Zalesky, L., Kokorev, V., et al. 2023b, ApJS, 269, 20 [NASA ADS] [CrossRef] [Google Scholar]
- Weaver, J. R., Cutler, S. E., Pan, R., et al. 2024, ApJS, 270, 7 [NASA ADS] [CrossRef] [Google Scholar]
All Tables
DAWN survey PL catalogue columns used for the creation of figures in this work.
All Figures
|
Fig. 1 Layouts and facility coverage for the two fields included in the DAWN survey PL catalogues, EDF-N (left) and EDF-F (right). Also highlighted are areas of particular importance to Euclid, namely, the Euclid self-calibration field in EDF-N, and the Chandra Deep Field South (CDF-S) Euclid Auxiliary Field (EAF) in EDF-F. The regions spanned by the PL catalogues are illustrated by the green squares. The areas of the PL catalogues reaching approximately final integration times by all facilities (or covered to full depth; see Sect. 2.4 and Table 1) are shown in grey. A future release from the DAWN survey will include catalogues with coverage from all facilities at full-depth spanning the entirety of EDF-N and EDF-F areas are targeted by Euclid. |
| In the text | |
|
Fig. 2 Astrometric comparison between Gaia DR3 matched to the DAWN survey PL catalogues for objects with HSC g magnitudes between 16 and 21 (left: EDF-N, right: EDF-F). The spacing between the dashed lines represent the dimensions of HSC pixels, while the green and red shaded regions represent the 1 and 3σ covariance ellipses, respectively. For clarity, only 2.5 and 10% of the matched sources are shown for EDF-N and EDF-F, respectively, where fewer sources are shown for EDF-N due to the higher stellar density (lower Galactic latitude) and greater catalogue extent. |
| In the text | |
|
Fig. 3 Depths and limiting magnitudes measured by the dispersion of empty aperture fluxes for each bandpass (see Sect. 2.5 and Appendix B for details). The top two rows correspond to EDF-N, and the bottom two rows correspond to EDF-F. The ‘full-depth’ regions of EDF-N and EDF-F illustrated in Fig. 1 are apparent by the areas of greater depth in the HSC griz (see Sect. 2.4, Tables 1 and 2). The quoted value along the top of each panel is the median 5σ depth measured over the full-depth region of each field. Only the areas covered by the DAWN survey PL catalogues are shown, corresponding to the green rectangular regions in Fig. 1. Future data acquired from CFHT MegaCam and Subaru HSC will expand the areas of both fields and lead to more uniform coverage. The depths are summarised in Table 3. |
| In the text | |
|
Fig. 4 Variation of the HSC griz PSF FWHM (top) and ellipticity (B/A, bottom). EDF-N is shown in the top row of each pair, while EDF-F is shown in the bottom. Only the areas covered by the DAWN survey PL catalogues are shown, corresponding to the green square regions in Fig. 1 and consistent with Fig. 3. |
| In the text | |
|
Fig. 5 Magnitude versus magnitude error for each unique facility and filter combination, with EDF-N shown in colour and EDF-F shown in grey. Each solid line represents the median magnitude uncertainty as a function of magnitude for a given band. The shaded regions are bounded by the 84th and 16th percentiles of the magnitude error distributions, enclosing 68% of the objects. The 5σ limiting magnitudes measured with 2″ diameter apertures reported in Table 3 are shown by vertical lines. A horizontal dotted line indicates a 5σ model-based photometric uncertainty. |
| In the text | |
|
Fig. 6 Subaru HSC i number counts of galaxies detected in the DAWN survey PL HSC r + i + z detection image. As a comparison, the HSC i number counts from the COSMOS2020 The Farmer catalogue (Weaver et al. 2022) are also shown, which were obtained using many of the same methods used in the present work. Bin spaces are 0.5 mag in each case. A small offset in the measured number counts before the turnover is caused by differences in the methods for separating stars from galaxies. |
| In the text | |
|
Fig. 7 Colour-colour diagram for stars and galaxies identified via SED fitting. Only sources with S/N > 3 in the listed bands are included. Galaxies are coloured according to their photo-z measured by LePhare, and sources with zphot > 5 are all shown in red. Stars are shown as black points following a well defined sequence in colour-colour space. A comparison validating the approximate locations of galaxies in colour-colour space as a function of redshift, as well as the size and extent of the stellar sequence, can be made with Fig. 12 of Weaver et al. (2022). |
| In the text | |
|
Fig. 8 Validation of photometric redshifts (photo-zs) computed with two codes, EAZY and LePhare, in three bins of apparent HSC i magnitude. The black solid line represents a one-to-one relation, and the dashed lines enclose the photo-z at ±0.15(1 + zspec) representing galaxies typically considered non-outliers. The fraction of sources outside the dashed lines (denoted η) and the precision measured with the normalised absolute deviation (noted σNMAD) are indicated in each panel. Top: comparison between photo-zs and spec-zs. Galaxies shown are those from the EDF-F spectroscopic sample from GOODS-S (Garilli et al. 2021; Kodra et al. 2023). The photo-z measurements of EAZY are displayed as orange circles, while the photo-z measurements of LePhare are displayed as blue circles. Bottom: comparison between photo-zs as calculated with the two codes for the full sample of galaxies in EDF-F. The EAZY photo-zs are displayed along the x-axis while the LePhare photo-zs are displayed along the y-axis. Bin colouring increases on a logarithmic scale. |
| In the text | |
|
Fig. 9 Cumulative fraction of galaxies between |zspec − zphot| divided by the 1σ uncertainty for the EDF-F spectroscopic sample. For well calibrated photo-z uncertainties, the enclosed fraction (y-axis) should be equal to 0.68 when this ratio (x-axis) is equal to 1, highlighted by the dotted black line. The 1σ uncertainty is defined as the maximum between |
| In the text | |
|
Fig. 10 Redshift distribution of galaxies included in the EDF-F catalogue according to EAZY (orange filled histogram) and LePhare (blue transparent histogram). Each panel considers a different selection of galaxies depending on their HSC i magnitude. |
| In the text | |
|
Fig. 11 Validation of stellar masses as a function of redshift measured using photometry in the bandpasses included by the present DAWN survey PL catalogues. Each panel shows the difference in stellar mass measured using the COSMOS2020 catalogue (Weaver et al. 2022) when using only the present DAWN bandpasses (‘PL’) and all forty (‘All’) of the original bandpasses of COSMOS2020. The medians are indicated by the red lines, and the shaded envelopes enclose 68% of the sources corresponding to 1σ. |
| In the text | |
|
Fig. 12 Empirical description of the DAWN survey PL selection function as viewed through the COSMOS2020 dataset. Each cell represents the fraction of galaxies detected from the original COSMOS2020 catalogue (Weaver et al. 2022) according to the DAWN survey PL selection function. The dotted line represents the COSMOS2015 stellar mass completeness limit (Laigle et al. 2016), while the dashed line represents the COSMOS2020 stellar mass completeness limit (Weaver et al. 2023a). Future catalogues selected on near-infrared imaging provided by Euclid will enhance the mass completeness of galaxies beyond z ~ 2. |
| In the text | |
|
Fig. 13 Rest-frame colour-colour diagram classifying galaxies as either star forming or quiescent in the DAWN survey PL EDF-F catalogue. Star-forming galaxies are labelled as ‘SF’ and quiescent galaxies are labelled as ‘Q’. The COSMOS2015 (Laigle et al. 2016) stellar mass completeness has been assumed (see Fig. 12). The bounding region discriminating the two populations is provided by Ilbert et al. (2013). The fraction of quiescent galaxies decreases with increasing redshift, due to both physical and observational effects driven by the present DAWN selection function. Future catalogues selected on near-infrared imaging provided by Euclid will enhance both the detection and identification of quiescent galaxies out to z ~ 3. |
| In the text | |
|
Fig. C.1 Photometric redshifts in EDF-N compared with spectroscopic measurements matched from the Early Data Release of the Dark Energy Spectroscopic Instrument. Galaxies are separated according to their DESI target names: “BGS”, “LRG”, and “ELG”. |
| In the text | |
|
Fig. D.1 Photometric redshifts measured using the COSMOS2020 catalogue but limited to only the bands included in the present DAWN survey PL catalogues, namely, CFHT u, HSC grizy, and Spitzer/IRAC [3.6 µm] and [4.5 µm]. Further, the photometric uncertainties have been scaled to follow the relations for EDF-N depicted in Fig. 5. This figure is analogous to Fig. 8 except that the bottom panel compares only photometric redshifts measured with LePhare; the x-axis indicates the photo-zs measured with all forty bands of the COSMOS2020 catalogue, while the y-axis indicates the photo-zs measured with only the DAWN survey PL subset. |
| In the text | |
Current usage metrics show cumulative count of Article Views (full-text article views including HTML views, PDF and ePub downloads, according to the available data) and Abstracts Views on Vision4Press platform.
Data correspond to usage on the plateform after 2015. The current usage metrics is available 48-96 hours after online publication and is updated daily on week days.
Initial download of the metrics may take a while.