Fig. 3
Download original image
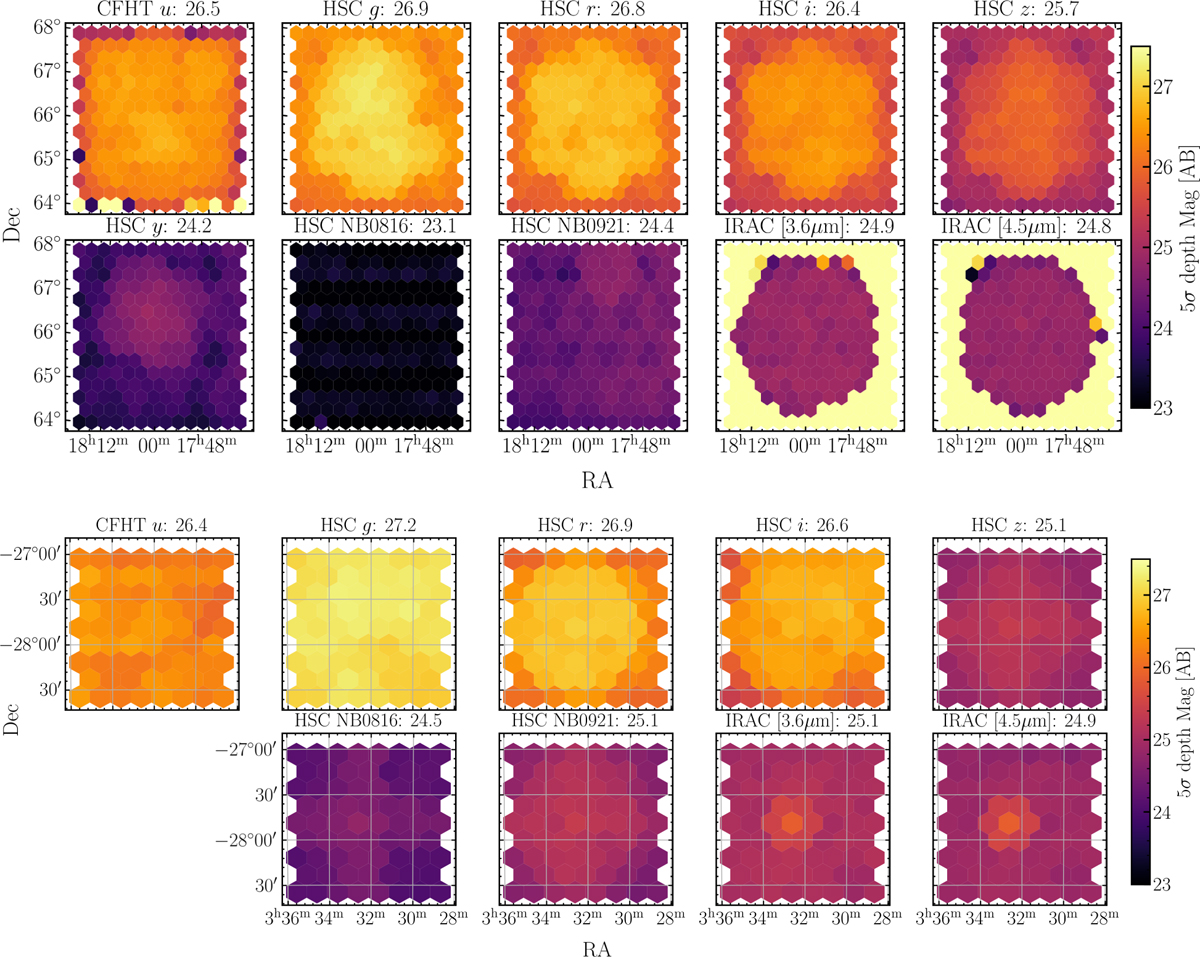
Depths and limiting magnitudes measured by the dispersion of empty aperture fluxes for each bandpass (see Sect. 2.5 and Appendix B for details). The top two rows correspond to EDF-N, and the bottom two rows correspond to EDF-F. The ‘full-depth’ regions of EDF-N and EDF-F illustrated in Fig. 1 are apparent by the areas of greater depth in the HSC griz (see Sect. 2.4, Tables 1 and 2). The quoted value along the top of each panel is the median 5σ depth measured over the full-depth region of each field. Only the areas covered by the DAWN survey PL catalogues are shown, corresponding to the green rectangular regions in Fig. 1. Future data acquired from CFHT MegaCam and Subaru HSC will expand the areas of both fields and lead to more uniform coverage. The depths are summarised in Table 3.
Current usage metrics show cumulative count of Article Views (full-text article views including HTML views, PDF and ePub downloads, according to the available data) and Abstracts Views on Vision4Press platform.
Data correspond to usage on the plateform after 2015. The current usage metrics is available 48-96 hours after online publication and is updated daily on week days.
Initial download of the metrics may take a while.