| Issue |
A&A
Volume 667, November 2022
|
|
|---|---|---|
| Article Number | A65 | |
| Number of page(s) | 22 | |
| Section | Cosmology (including clusters of galaxies) | |
| DOI | https://doi.org/10.1051/0004-6361/202243088 | |
| Published online | 07 November 2022 | |
COSMOS2020: UV-selected galaxies at z ≥ 7.5
1
Aix-Marseille Univ., CNRS, CNES, LAM, Marseille, France
e-mail: This email address is being protected from spambots. You need JavaScript enabled to view it.
2
California Institute of Technology, Pasadena, CA 91125, USA
3
Jet Propulsion Laboratory, California Institute of Technology, Pasadena, CA 91109, USA
4
Cosmic Dawn Center (DAWN), Rådmandsgade 62, 2200 Copenhagen, Denmark
5
Niels Bohr Institute, University of Copenhagen, Jagtvej 128, 2200 Copenhagen, Denmark
6
Sorbonne Université, CNRS, UMR 7095, Institut d’Astrophysique de Paris, 98 bis bd Arago, 75014 Paris, France
7
Max-Planck-Institut für Extraterrestrische Physik (MPE), Giessenbachstr. 1, 85748 Garching, Germany
8
Department of Physics and Astronomy, University of California, Riverside, 900 University Avenue, Riverside, CA 92521, USA
9
The University of Texas at Austin, 2515 Speedway Blvd Stop, C1400, Austin, TX 78712, USA
10
Institute for Astronomy, University of Edinburgh, Royal Observatory, Edinburgh, EH9 3HJ, UK
11
School of Physics and Astronomy, Rochester Institute of Technology, 84 Lomb Memorial Drive, Rochester, NY 14623, USA
12
Space Telescope Science Institute, 3700 San Martin Drive, Baltimore, MD 21218, USA
13
Institute for Astronomy, University of Hawaii, 2680 Woodlawn Drive, Honolulu, HI 96822, USA
Received:
11
January
2022
Accepted:
5
August
2022
Abstract
This paper presents a new search for z ≥ 7.5 galaxies using the COSMOS2020 photometric catalogues. Finding galaxies at the reionisation epoch through deep imaging surveys remains observationally challenging. The larger area covered by ground-based surveys such as COSMOS enables the discovery of the brightest galaxies at these high redshifts. Covering 1.4 deg2, our COSMOS catalogues were constructed from the latest UltraVISTA data release (DR4) combined with the final Spitzer/IRAC COSMOS images and the Hyper-Suprime-Cam Subaru Strategic Program DR2 release. We identified 17 new 7.5 < z < 10 candidate sources, and confirm 15 previously published candidates. Using deblended photometry extracted by fitting surface brightness models on multi-band images, we selected four candidates which would be rejected using fixed aperture photometry. We tested the robustness of all our candidates by comparing six different photometric redshift estimates. Finally, we computed the galaxy UV luminosity function in three redshift bins centred at z = 8, 9, 10. We find no clear evolution of the number density of the brightest galaxies MUV < −21.5, in agreement with previous works. Rapid changes in the quenching efficiency or attenuation by dust could explain such a lack of evolution between z ∼ 8 and z ∼ 9. A spectroscopic confirmation of the redshifts, already planned with JWST and the Keck telescopes, will be essential to confirm our results.
Key words: galaxies: luminosity function / mass function / galaxies: evolution / galaxies: formation / galaxies: high-redshift / galaxies: photometry / galaxies: statistics
Deceased.
© O. B. Kauffmann et al. 2022
 Open Access article, published by EDP Sciences, under the terms of the Creative Commons Attribution License (https://creativecommons.org/licenses/by/4.0), which permits unrestricted use, distribution, and reproduction in any medium, provided the original work is properly cited.
This article is published in open access under the Subscribe-to-Open model. This email address is being protected from spambots. You need JavaScript enabled to view it. to support open access publication.
1. Introduction
Star-forming galaxies are expected to be major contributors to the reionisation process in the primordial Universe (e.g. Dayal & Ferrara 2018; Finkelstein et al. 2019). During this time, when the Universe was less than 1 Gyr old, Lyman continuum photons emitted by newborn massive stars ionised the intergalactic medium around them. The efficiency of this process is expected to depend on the density of galaxies, their star formation rate (SFR), and the fraction of ionising photons escaping from their interstellar medium (e.g. Bouwens et al. 2015a). The latest results from the Planck survey (Planck Collaboration VI 2020) give the reionisation redshift mid-point zre = 7.67 ± 0.73, while the reionisation probably ended around redshift z = 6 (e.g. Fan et al. 2006). However, an accurate timeline showing the interplay between the formation of the first galaxies and reionisation has not been established yet. At high redshifts, the galaxy UV luminosity function (UVLF) is the main observable to establish the cosmic star formation rate density (SFRD). The number of ionising photons generated by galaxies can be derived from the SFRD, assuming a number of Lyman continuum photons per second produced per unit SFR, and a fraction of them escaping from galaxies (e.g. Robertson et al. 2015; Vanzella et al. 2018). Furthermore, because of the fluctuation of the inter-galactic medium (IGM) opacity on large scales (e.g. Kulkarni et al. 2019), the observed redshift of the end of the reionisation may depend on sight lines. Therefore, a census of star-forming galaxies at z > 6 in deep fields is essential to understand the origin and physics of reionisation, as well as the formation of the first galaxies.
Neutral hydrogen in the IGM, the circumgalactic medium, and the interstellar medium absorbs the flux blueward of the Lyman limit at 912 Å, with a flux expected to be consistent with zero below this limit (e.g. Bouwens et al. 2015b). Moreover, the IGM absorbs the light bluer than the Lyman alpha emission line at 1215.67 Å. These features have been used to select high-redshift galaxies in deep imaging surveys (Steidel et al. 1996). The search for these Lyman-break galaxies (LBGs) is carried out by using fluxes straddling the Lyman emission wavelength at any given redshift and detecting the amplitude of this feature (the height of the Lyman break). The colour redward of the break constrains the rest-frame UV slope, which is sensitive to star formation, dust, and metallicity. Photometric redshifts are also commonly used to select high-redshift candidates, through spectral energy distribution (SED) fitting (e.g. McLure et al. 2013; Finkelstein et al. 2015; Bowler et al. 2015). This method presents the advantage of using more than three bands if available, as well as providing a redshift probability distribution function (hereafter zPDF) for each candidate.
Recent deep and wide-area surveys have provided the necessary multi-wavelength data to select high-redshift galaxies, in particular at near-infrared wavelengths (1 − 2 μm). The Wide Field Camera 3 (WFC3) onboard the Hubble Space Telescope (HST), with its unmatched sensitivity at near-infrared wavebands, has revolutionised our knowledge of the distant Universe. One of the major surveys in this context is the Cosmic Assembly Near-infrared Deep Extragalactic Legacy Survey (CANDELS; Grogin et al. 2011; Koekemoer et al. 2011), covering a total of 750 arcmin2 with deep HST imaging. The CANDELS fields include the Great Observatories Origins Deep Survey (GOODS; Giavalisco et al. 2004) with two fields (GOODS-South and GOODS-North), COSMOS (Scoville et al. 2007), the Extended Groth Strip (EGS; Davis et al. 2007), and the UKIDSS Ultra-deep Survey field (UDS; Cirasuolo et al. 2007). Furthermore, the Hubble Ultra-Deep Field (HUDF) covering 4.7 arcmin2 (Illingworth et al. 2013) has allowed for the deepest ever astronomical images to be taken, reaching depths of 30 mag in the optical and near-infrared. Alternatively, the Hubble Frontier Fields (HFFs; Lotz et al. 2017) include deep imaging of six massive galaxy clusters, which are used to study extremely faint background galaxies magnified through gravitational lensing. Using these multi-wavelength surveys, over a thousand galaxies with z > 6 have been identified, reaching z ∼ 10 (e.g. McLeod et al. 2016; Oesch et al. 2014, 2018; Bouwens et al. 2015b, 2019).
Based on galaxy candidates detected in these HST deep fields, there is evidence that the Schechter function (Schechter 1976) still provides a reasonable fit to the UVLF at high redshift (e.g. Schmidt et al. 2014; Bouwens et al. 2015b). The shape of the UVLF appears to evolve with redshift, with a steepening of the faint-end slope α from −1.6 at z = 4 to −2.3 at z = 10 (e.g. Bouwens et al. 2015b; Finkelstein et al. 2015; Oesch et al. 2018). The observed steep slope for the UVLF at high redshifts predicts a high abundance of faint galaxies in the Universe during the reionisation epoch. However, there is no consensus whether the observed evolution of the UVLF at z > 6 is driven by changes in the characteristic absolute magnitude or in the normalisation (e.g. McLure et al. 2013; Finkelstein et al. 2015). This may be due to an evolving shape of the LF towards a non-Schechter form. When converted in SFRD, most of the studies are consistent with a steady decrease in the SFRD from its peak at z = 2 − 3 to z = 10 (e.g. Madau & Dickinson 2014; Finkelstein 2016). Oesch et al. (2018) find that this decrease is even more rapid between z = 8 and z = 10 by more than a factor ten, possibly explained by the fast buildup of the underlying dark matter mass function in the primordial Universe.
While an extremely powerful technique to study the faint galaxy populations, the current deep pencil-beam surveys do not cover sufficient cosmological volumes to capture the rare and bright sources which would constrain the bright end of the UVLF. For instance, Oesch et al. (2018) analysed 800 arcmin2 of archival data, but did not constrain the LF brighter than MUV < −21.2. Bridge et al. (2019) found eight galaxies brighter than MUV < −21.5 at 7 < z < 8 in the Brightest of Reionising Galaxies (BoRG) survey, a parallel HST survey specially designed to observe the brightest galaxies. In this regime, deep ground-based imaging surveys are invaluable. The combination of deep optical (27 − 28 mag) and near-infrared (25 − 26 mag) imaging over a degree-scale area has made it possible to isolate the brightest galaxies in the z > 7 − 8 Universe (e.g. Bowler et al. 2014). Sufficiently deep Spitzer coverage with the InfraRed Array Camera (IRAC) at 3.6 and 4.5 μm complements these observations, allowing for the efficient removal of the intermediate-redshift contaminants (e.g. Oesch et al. 2012), as well as the direct detection of high-redshift sources.
Using the available data from the UltraVISTA survey (McCracken et al. 2012) in the COSMOS field, multiple samples of galaxy candidates have already been identified at z > 6 (Bowler et al. 2014, 2015) and z ≥ 7.5 (Stefanon et al. 2017, 2019, hereafter S19), imposing strong constraints on the bright end of the galaxy UVLF. Bowler et al. (2020, hereafter B20) found 27 LBGs over a 6 deg2 area combining data from the COSMOS and XMM-LSS fields. The bright end (−23 < MUV < −21) of the resulting galaxy number density is in excess compared to the exponential decline predicted from a Schechter parametrisation, suggesting a double power law may be more appropriate. Early models have linked the UVLF evolution with the one of the dark matter halo mass functions (Cooray & Ouchi 2006; Bouwens et al. 2008; Tacchella et al. 2013). The change of shape at the bright end of the UVLF compared to the halo mass function is interpreted by the combination of several physical processes, including quenching and dust extinction (e.g. Harikane et al. 2022). Indeed, for a given massive galaxy, its host dark matter halo or its own intrinsic stellar content may not be massive enough to trigger internal star-formation quenching (Peng et al. 2010). Moreover, dust extinction is known to bend the bright end of the UVLF at intermediate redshift (Reddy et al. 2010). The formation of dust in the interstellar medium (ISM) of galaxies at z > 6 may still be immature, thus high SFR galaxies at this epoch may experience less attenuation (Finkelstein et al. 2015). This would result in a UVLF that is well populated at the bright end, describing a double power law (Bowler et al. 2014, 2015).
With the COSMOS2020 photometric catalogues (Weaver et al. 2022), we have the opportunity to improve the search and identify the brightest star-forming galaxies at the epoch of reionisation. Candidates are identified using deep near-infrared imaging from UltraVISTA DR4, complemented with IRAC images from the Cosmic Dawn Survey (Euclid Collaboration 2022) to detect the galaxy rest-frame optical emission. While B20 used the latest UltraVISTA release (DR4), we used, in addition, the latest deep optical images from the public DR2 of the Hyper Suprime-Cam (HSC) Subaru Strategic Program (HSC-SSP; Aihara et al. 2018) and the final Spitzer images in the mid-infrared. We also validated our results using the recently released DR3 of the HSC-SSP (Aihara et al. 2022). These data are essential to improve the purity of the high-redshift sample and to extend the area under investigation. Furthermore, COSMOS2020 photometric extractions have been made with two different techniques: a traditional approach using aperture photometry and a surface brightness profile-fitting technique using multi-band images. In this paper, we combine both photometric catalogues, and multiple photometric redshift codes, leading to a more robust final sample of candidates.
For this study, we searched for galaxies at z ≥ 7.5 in the COSMOS field using the COSMOS2020 photometric catalogue, and we estimated the galaxy rest-frame UVLF at 8 ≤ z ≤ 10. The paper is structured as follows. Section 2 presents the imaging data used in this work, as well as the estimated source photometry. Section 3 describes the high-redshift galaxy selection. The sample of candidates is presented in Sect. 4 and compared with previous studies. The updated constraints on the high-redshift UVLF resulting from the selected galaxies are presented in Sect. 5. We discuss these results in Sect. 6 and summarise our conclusions in Sect. 7.
We adopted the standard Λ Cold Dark Matter cosmology with Ωm = 0.3, ΩΛ = 0.7, and H0 = 70 km s−1 Mpc−1. We used the initial mass function (IMF) from Chabrier (2003). Magnitudes are given in the AB system (Oke 1974).
2. Data
This work is based on the COSMOS2020 photometric catalogues (Weaver et al. 2022), which includes the currently deepest optical to mid-infrared imaging in the COSMOS field. The imaging data, as well as the extracted photometry are briefly described here. Full details can be found in Weaver et al. (2022).
2.1. Imaging
The COSMOS field is covered by several multi-wavelength deep imaging surveys. While the photometric catalogue consists of observations in more than 35 bands, here we only discuss the deepest and reddest broad-band imaging, which are the most relevant datasets to search for high-redshift galaxies. The photometric depths of these broad-band images are given in Table 1. We stress that the depths are not homogeneous over the full field and differ by wavelength. We discuss the impact on the selection of the high-redshift candidates in Sect. 4.
Depth of the deepest optical and infrared broad bands used in this work.
The UltraVISTA survey (McCracken et al. 2012) provides deep near-infrared imaging over 1.5 deg2 of the COSMOS field, as shown in Fig. 1. The exposure time is not homogeneous over the entire field. Four ultra-deep stripes across the field covering 0.62 deg2 have deeper exposure times (vertical dark grey stripes in Fig. 1). We use the UltraVISTA DR4 data, with a near-infrared coverage in four broad bands, YJHKs. The additional narrow-band NB118 covers the ultra-deep stripes.
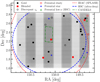 |
Fig. 1. Imaging data in COSMOS. The background image shows the UltraVISTA H-band weight map, where the vertical dark grey stripes represent the UltraVISTA ultra-deep stripes. The red dashed line indicates the Spitzer/IRAC [3.6] coverage of the SPLASH survey, the blue dashed line represents the ultra-deep region of the HSC images, and the green dot-dashed line corresponds to CANDELS. The filled circles indicate our gold sample (see Sect. 4.1). Open symbols indicate sources for which we cannot exclude a low redshift or star solution based on template fitting, or because of a low S/N detection in one HSC band. |
The mid-infrared data comes from the Cosmic Dawn Survey (Euclid Collaboration 2022), in which all the Spitzer observations in the IRAC/[3.6], [4.5] bands are processed (the full list of included programs is given in their Table C.1). This notably includes the COSMOS Spitzer survey (S-COSMOS; Sanders et al. 2007) over 2 deg2, the Spitzer Large Area Survey with Hyper Suprime-Cam (SPLASH; Steinhardt et al. 2014) over 1.8 deg2, the Spitzer Extended Deep Survey (SEDS; Ashby et al. 2013), the deep Spitzer Matching Survey of the UltraVISTA ultra-deep Stripes survey (SMUVS; Ashby et al. 2018) and Completing the Legacy of Spitzer/IRAC over COSMOS (COMPLETE, COMPLETE2; Labbe et al. 2016; Stefanon et al. 2018). The IRAC depths reported in Table 1 are separately computed inside the deep and ultra-deep UltraVISTA stripes. The 3σ depths of S-COSMOS data outside the SPLASH field (shown in Fig. 1) reach 25.3 mag in [3.6] and 25 mag in [4.5].
The optical data provided by the Hyper Suprime-Cam (HSC) Subaru Strategic Program (HSC-SSP; Aihara et al. 2018), include deep imaging in the g, r, i, z, y broad bands over 2.2 deg2. We use the HSC-SSP DR2 images (Aihara et al. 2019), stacked for the COSMOS2020 catalogue. The central region of the COSMOS field includes ultra-deep HSC imaging within a 0.75 deg radius circle (blue circle in Fig. 1), and deep imaging in the extended COSMOS survey, about 0.5 mag shallower than in the centre. Since the COSMOS2020 catalogue was created, a third release of the HSC-SSP became available (Aihara et al. 2022). While these data are not included in our analysis, we used these images to insure the robustness of our candidates. In addition, we include the reprocessed Subaru Suprime-Cam images with 12 medium and two narrow bands in optical (Taniguchi et al. 2007, 2015), the u and u* bands from the CFHT Large Area U-band Deep Survey (CLAUDS; Sawicki et al. 2019), and the UV photometry from GALEX (Zamojski et al. 2007).
2.2. Photometry
Source detection is performed in the combined CHI_MEAN image constructed with SWarp (Bertin et al. 2002) from the HSC/i, z and UltraVISTA/Y, J, H, Ks bands. This stacked detection image provides an advantage for faint, high-redshift sources compared to single images. Photometry is extracted following two independent approaches, leading to two separate photometric catalogues, called the CLASSIC catalogue and The Farmer catalogue. In the CLASSIC approach, the photometry of the high-resolution images is performed with SExtractor (Bertin & Arnouts 1996) in dual-image mode. The photometry is extracted in fixed 2″ diameter apertures. To ensure that the apertures include the same features at all wavelengths, the point-spread functions (PSF) of the science images are homogenised. Multiple corrections are applied to the measured magnitudes, including the magnitude error scaling and the aperture-to-total magnitude corrections. The photometry of the low-resolution IRAC images is performed with the software IRACLEAN (Hsieh et al. 2012), using the high-resolution images as prior to extract the photometry of the confused sources. In this case, the IRAC PSF is iteratively subtracted from the IRAC images centred within the source boundary, as defined by the high-resolution prior. In the second approach, all bands are extracted with The Farmer (Weaver et al., in prep.), which uses The Tractor software (Lang et al. 2016) to obtain more accurate photometry by fitting galaxy profiles with parametric models. The morphology of the sources is determined through a decision tree, separating point and extended sources. In contrast with the CLASSIC approach, this method directly provides total magnitudes, performs an improved deblending in the high-resolution images, and extracts all the images consistently.
3. Galaxy selection criteria
Here we describe different steps taken to select a complete sample of galaxies at high redshifts. The resulting candidates are discussed in Sect. 4.
We exclusively search for candidates over the UltraVISTA area, by rejecting sources located in the masked regions near bright stars in the HSC images. This corresponds to an area of 1.404 deg2. We require the candidates to be detected in three bands among the H, Ks, [3.6] and [4.5] bands. We require at minimum a 5σ detection in one of these bands, one at 3σ in a second band, and at 1σ in a third band. This ensures that at least two colours are reliable to estimate photo-z. Sources only detected in IRAC images are not included. We apply these selection criteria separately on both the CLASSIC and The Farmer catalogues.
We reject candidates detected in any broad band blueward of the Lyman alpha break based on visual inspection, rather than explicit magnitude cuts. The measured flux may be inconsistent with zero in the case of a noise local maximum at the source coordinates. Moreover, nearby sources likely contaminate aperture fluxes for blended candidates, and generate a significant flux in the photometric apertures. In these cases, we estimate whether the observed flux originates from the detected source or from nearby sources. In the latter case, we flag these sources as blended. Artefacts are also rejected through the visual inspection of the science images, as discussed in Appendix A.
3.1. Photometric redshift selection
Our initial candidate lists are selected taking into account both the photometric redshifts and the posterior probability redshift distributions (zPDF) computed for all sources in COSMOS2020 using LePhare (Arnouts et al. 2002; Ilbert et al. 2006) with both the CLASSIC and The Farmer catalogues. We first use the default COSMOS2020 configuration of LePhare, as done in Ilbert et al. (2013), Laigle et al. (2016) and Weaver et al. (2022), with the templates, dust attenuation curves and the recipe to add emission lines from Ilbert et al. (2009). The galaxy library includes 33 templates, covering various SED types, from quenched to starbursting galaxies. The most relevant ones for this work are 12 templates generated with the Bruzual & Charlot (2003, hereafter BC03) stellar population synthesis models, with ages ranging from 30 Myr to 3 Gyr, and including sub-solar metallicities (Z = 0.004, 0.008, 0.02). We add the dust attenuation as a free parameter, allowing E(B − V) to vary between 0 and 0.5 for two different attenuation curves: Calzetti et al. (2000) and Prevot et al. (1984). Several emission lines are added using an empirical relation between the UV luminosity corrected for dust attenuation and Hα emission line flux. Physically constrained ratios are considered between the intrinsic emission lines. We added [OII], Hβ, [OIII], and Hα emission lines, as well as Lymanα, despite the large uncertainties that potentially affect the modelling of this line. Dust attenuation is applied to the emission line fluxes using the same dust model as for the stellar continuum. The normalisation of the emission line fluxes are allowed to vary by a factor of two (using the same ratio for all lines) during the fitting procedure. IGM absorption is implemented following the analytical correction of Madau (1995).
As in Laigle et al. (2016), we perform the fit using fluxes (and not magnitudes), even when a source is extremely faint or non-detected in one band. This type of approach is suitable as long as uncertainties are measured consistently. Therefore, we do not have to include upper-limits in the fitting procedure.
LePhare provides the redshift likelihood distribution for each source, after a marginalisation over the galaxy templates and the dust attenuation. We use it as the posterior redshift probability density function (zPDF), assuming a flat prior. The photo-z point estimate, zphot, is defined as the median of the zPDF. We also consider the photo-z which minimises the χ2 over the full template library as an alternate photo-z point estimate, to strengthen our selection of high-redshift sources. We select any source with a solution at z ≥ 7.5 with LePhare, in either the CLASSIC or The Farmer catalogue. This is defined by imposing that both the median of the zPDF and the redshift which minimises the χ2 are at z ≥ 7.5.
3.2. Complementary template-fitting procedures
We produce photometric redshifts with other template-fitting procedures for the selected candidates. These estimates are not directly used to select the candidates, but are used in Sect. 4.1 to assess their robustness.
The photometric redshifts computed for all sources using EAZY (Brammer et al. 2008) are available in COSMOS2020. The adopted strategy is equivalent to LePhare and corresponds to the technique described in Weaver et al. (2022). The fitted galaxy library consists of 17 templates derived from the Flexible Stellar Population Synthesis models (Conroy et al. 2009; Conroy & Gunn 2010). Moreover, EAZY allows the combination of the templates in the fitting procedure.
Furthermore, we compute new photometric redshifts for the selected candidates using a different LePhare configuration, hereafter noted LePhare BC03. Such a configuration is optimised to model sources with extreme colours. Since we select a really specific population with extreme properties, a larger coverage of the parameter space (in terms of dust, ages, star formation histories) should be explored to reject potential intermediate redshift contaminants. In this case, we include a set of BC03 templates assuming different star formation histories (exponentially declining and delayed), as described in Ilbert et al. (2015). Each of these 12 templates is generated at 43 ages from 50 Myr to 13.5 Gyr. During the fitting procedure, no template with an age older than the age of the Universe is considered. We assume two attenuation curves (Calzetti et al. 2000; Arnouts et al. 2013) with E(B − V) varying from 0 to 2. The dust attenuation reaches AV ∼ 8, enabling potentially extremely dusty sources at lower redshift to be rejected (Dunlop et al. 2007). We add the emission line fluxes with a recipe described in Saito et al. (2020). For each template, we derive the number of ionising photons by integrating the SED blueward of the Lyman break, and convert it into Hβ luminosity following Schaerer & de Barros (2009). Then, the ratios between Hβ and other emission lines are given by Osterbrock & Ferland (2006) and Anders et al. (2003). Emission line fluxes are allowed to vary by a factor of two during the fitting procedure, to reproduce potential variations around the expected value. We do not use this configuration to compute photometric redshifts for the full COSMOS2020 catalogue, since the large parameter space covered by the templates increases the risk of degeneracy in the colour-redshift space and creates a larger fraction of catastrophic failures for the general population1.
3.3. Brown dwarf contamination
The selected high-redshift candidates may be contaminated by cool Milky Way brown dwarfs, because of their similar near-infrared colours (e.g. Wilkins et al. 2014). Given the predictions by Ryan & Reid (2016), we could expect 277/deg2 brown dwarfs at J < 25.
To isolate these contaminants, we fit brown dwarf templates to COSMOS2020 photometry. We include the simulated high-resolution brown dwarf templates from Baraffe et al. (2015, BT-Settl/CIFIST2011_2015) and Morley et al. (2012, 2014) in LePhare. The modelled emission extends to at least 10 μm in the mid-infrared. In addition, the nonphysical templates are rejected following constraints from Saumon & Marley (2008) in the effective temperature versus surface gravity space, based on the predicted evolution of cool brown dwarfs. Then, we compare the minimum χ2 obtained with the galaxy templates (we use the standard LePhare configuration described in Sect. 3.1) and the one obtained with the stellar library including brown dwarf templates. We compute  with
with  being the minimum χ2 obtained with the galaxy templates, and
  the one obtained with the stellar templates. We select candidates with Δχ2 > 0.
3.4. The case of ID 720309
The source ID 720309 has the highest photo-z among the candidates extracted from the COSMOS2020 catalogue. However, we identified a bright star at the coordinates RA = 09h59m10.81s, Dec = +2d11m04.29s which could potentially generate a cross-talk signal (see Appendix A) at a position 09h59m10.81s +2d06m42.40s (assuming a native pixel scale of 0.341″ expected for the detector 7 of the VIRCAM camera). Each ultra-deep stripe is the combination of VIRCAM observations taken at three different declinations, each called “paw” (see McCracken et al. 2012). This source presents two components in one paw (paw 1), and just one component in the other (paw 2). It suggests that ID 720309 in COSMOS2020 is the superposition of a cross-talk and a real source separated by 0.7″. It contributes to the signal in the 2″ aperture of the CLASSIC catalogue. As The Farmer photometry is centred on the real source, the cross-talk has less impact on the profile-fitting photometry. We also notice that the [3.6] and [4.5] positions are well aligned with the Ks position of the source in paw 2.
The star responsible for the artefact is not included in 80% of the images taken in the paw 2. Therefore, we created new stacks in Y, J, H, Ks using only these observations. This impacts the sensitivity of our dataset, but it ensures that the source is not affected by the cross-talk. Figure 2 shows the difference between the images on the full stack (top panels) and the stack not affected by the cross-talk (bottom). The main difference appears in H with a change in the shape of the source. We recomputed the flux using The Farmer on this new stack. The resulting magnitudes are given in Table 2, showing fainter magnitude in H and Ks, and a non-detection in the Y-band.
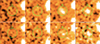 |
Fig. 2. Images of the source ID 720309 in the Y, J, H, Ks UltraVISTA broad bands (from left to right), in the full stack (top) and in the stack including only the images not contaminated by the potential cross-talk artefact (bottom). The circles represent the 2″ diameter aperture used in the CLASSIC photometry. |
Coordinates and observed photometry of the selected z ≥ 7.5 candidates.
4. Resulting galaxy sample
Our final galaxy sample comprises 32 candidates at z ≥ 7.5. Based on the LePhare/The Farmer photometric redshifts, the sample includes 15 candidates in the range 7.5 < z < 8.5, 11 candidates at 8.5 < z < 9.5 and 1 candidates at z > 9.5 (some photo-z are below z < 7.5 in the LePhare/The Farmer configuration). Tables 2 and 3 present the coordinates, photometry, photometric redshifts and absolute magnitudes of each object. The identifiers are from the CLASSIC catalogue, and are always indicated starting with the letters “ID” in the following discussion. We report the magnitudes from The Farmer, corrected for the Milky Way extinction and systematic zero-point offsets. Appendix B describes the photometry, the best-fitting templates and the zPDF estimated with LePhare together with a detailed discussion for each candidate. Figure 1 illustrates the coordinates of the identified candidates over the COSMOS field. We emphasise an important aspect of our selection: four candidates are located in the UltraVISTA “deep stripes”. These areas are one magnitude shallower than the ultra-deep stripes in YJH. This makes it more difficult to meet selection criteria requiring an unambiguous three-band detection.
Photometric redshifts estimated with LePhare and EAZY as in Weaver et al. (2022), and with LePhare using BC03 templates, for the z ≥ 7.5 candidates.
We identify 17 new unpublished candidates at z ≥ 7.5, many of which are located within the westernmost UltraVISTA ultra-deep stripe (at low right ascension), as shown in Fig. 1. This region is fully covered with the “deep” HSC-SSP DR2 survey, about 0.5 mag shallower on the outer part of the field compared to the centre. In contrast, the Suprime-Cam data did not cover this part of the field, which made impossible the search of z > 7 galaxies in this region in previous works, because of the lack of a sufficiently deep optical photometry.
We find some differences between the total apparent magnitudes between the CLASSIC and The Farmer photometric COSMOS2020 catalogues, as shown in Appendix B. The Farmer catalogue has the advantage of photometric measurements performed consistently over the full wavelength range. Moreover, The Farmer measures fluxes more accurately in crowded fields. Therefore, we adopt this photometry by default for our UVLF analysis.
4.1. Robustness of the selected candidates
We produce several tests to establish the robustness of our candidates. Based on this step, we define a gold sample of 22 sources satisfying all our criteria as z > 7.5 galaxies (see Table 3). But we cannot exclude a possible contaminant for the remaining sources, based on these additional criteria.
First, we compare several photo-z estimates to assess the sensitivity of our selection to the template-fitting approach. Table 3 presents the six photometric redshift estimates for each candidate, computed using the three different template-fitting procedures (LePhare, EAZY and LePhare BC03) applied to both the CLASSIC and The Farmer catalogues, as described in Sects. 3.1 and 3.2. All template-fitting codes consolidate our selection for the first 16 candidates listed in Table 3. They represent the core of our gold sample. We find some discrepancies for the remaining candidates, separated by categories in Table 3.
Blended galaxies: for four of these candidates, the three photo-z estimates with the CLASSIC catalogue are at z < 3. These sources are flagged as blended in the images (flag B in Table 3), as a bright foreground source is clearly identified and contaminates the 2″ aperture. Based on the CLASSIC aperture photometry, all four of these candidates show a 3σ detection in at least one HSC optical band. The flux captured in the fixed aperture present a spatial offset. The CLASSIC redshift probability distributions peak at z ∼ 2 for all candidates, although one of them presents a secondary z > 7 solution. In contrast, the majority of the zPDF weights are located at z > 7 with The Farmer catalogue. It is precisely in these cases that The Farmer photometry is expected to be more reliable than the CLASSIC aperture photometry, since these candidates are well deblended thanks to the profile-fitting photometry. Therefore, we consider these estimates with The Farmer as robust and we include these candidates in our gold sample. We note that ID 859061 falls in the CANDELS region and Stefanon et al. (2019) confirmed the lack of emission in the visible from HST data (see their Fig. 5).
Low-redshift galaxies based on EAZY photo-z: for two sources, we find one solution at z < 3 using EAZY. Since EAZY produces a high-redshift solution in either the CLASSIC or The Farmer catalogue, we decide to consider these candidates as robust and keep them in our gold sample.
Low-redshift galaxies based on LePhare photo-z: EAZY points towards a robust z > 9 solution with a single peak for ID 1356755. However, all the solutions obtained with LePhare present a significant peak at z < 3, including more than 30% of the zPDF. Hence, we do not include this candidate in our gold sample. The configuration The Farmer/LePhare is our reference to derive the UVLF, but corresponds to a photo-z of  . Therefore, we do not indicate the corresponding absolute magnitude in Table 3 and this source is not used to derive the UVLF. For the source ID 720309, all photo-z indicate a z > 9 solution with the original COSMOS2020 photometry. However, our photometry could be contaminated by a cross-talk artefact (see Sect. 3.4). We recompute the photo-z with LePhare using the new stack not contaminated by the cross-talk. The redshifts which minimise the χ2 are
  and
and  for the COSMOS and BC03 templates, respectively. We obtain
  and
and  using the median of the zPDF. This galaxy remains a high-redshift candidate in our sample, but with a significant peak in the zPDF at z ∼ 2.8.
Dusty star-forming galaxies at intermediate redshift: we checked that none of the selected candidates has H − [3.6]> 2 which would indicate a low-redshift galaxy with strong Balmer-break or high dust obscuration (Oesch et al. 2013). None of the candidates has coincident Spitzer/MIPS 24 μm emission nor at longer wavelengths in the COSMOS Super-deblended catalogue (Jin et al. 2018), and are thus unlikely to be contaminated by low-redshift dusty galaxies. We also checked that none of these sources were detected in SCUBA2 (Simpson et al. 2019) at less than 6″. Three of the candidates present a lower redshift z < 6 solution when fitted using the LePhare BC03 configuration. In this case, we allow for a possible attenuation reaching AV ∼ 8, which could reveal a possible solution associated with a dusty star-forming galaxies. These three candidates have also secondary peaks in their zPDF using other template-fitting configurations. They are located outside the ultra-deep HSC region, and outside the SPLASH coverage. Their mid-infrared photometry relies on S-COSMOS, which is about 1 mag shallower than in the centre of the field. The use of shallower data may explain the lower constraint on the zPDF resulting in multiple peaks. In addition, the width of the zPDF is systematically larger when using the CLASSIC catalogue compared to The Farmer, because of larger flux errors for the same objects (as explained in Weaver et al. 2022). While our fits favour a high-redshift solution for these sources, we flag them as possible intermediate redshift contaminants and we do not include them in our gold sample.
Secondly, we also assess the robustness of the star-galaxy classification. We already rejected all candidates with a better χ2 using the brown dwarf templates than with the galaxy templates. However, such a sharp cut does not quantify the risk of degeneracy in the classification. Therefore, we generate 500 realisations of the candidates, and for each realisation we add noise to the observed flux corresponding to the photometric uncertainty in each band2. We compute Δχ2 for each realisation. The analysis of these 500 realisations allows us to quantify the robustness of the star-galaxy classification for a given source. For three sources ID 485056, ID 545752, ID 1346929, we find that 31%, 28%, 23% (27%, 33%, 43%) of the Δχ2 distribution falls at Δχ2 < 0 with The Farmer (CLASSIC). Therefore, these sources present a significant probability to be brown dwarf contaminants, and we do not include them in our gold sample.
Thirdly, we inspect the HSC-SSP DR3 images in g, r, i and z for the 32 candidates. The increase in depth for DR3 compared DR2 is minor in the COSMOS field (Aihara et al. 2022). DR3 correspond to the final images taken on COSMOS and the sky subtraction has been improved in the SSP pipeline. In the z-band image at the position of each of the 32 candidates, we measure the photometric flux in a 2″ diameter aperture and the corresponding sky flux in a 2 − 4″ diameter annulus using the python package photutils. To minimise the impact of objects in the sky annulus, we compute a sigma-clipped mean value. The noise per pixel is computed by aggressively detecting and removing all objects in the postage-stamp around the object and computing the standard deviation of the remaining pixels. We note that the precise signal-to-noise ratio (S/N) values reported here are dependent on the exact details of object thresholding and background computation. However, we have verified that the conclusions presented below are largely robust to the exact parameter choice. In addition to the S/N values presented below, we examine both the pixels present in the measurement aperture and in the sky annulus around the object. Six candidates have S/N > 1. One of them is already identified as potential z < 6 dusty galaxy (ID 241443). Two galaxies (ID 1297232 and ID 441697) have a z-band S/N of 1.4 and 2.7, respectively, and are listed separately in Table 3. The three remaining S/N > 1 candidates are not considered since the bright pixels are shifted by 1″ with the expected source position, or the signal comes from only one pixel.
To summarise, the first 16 candidates satisfy all the criteria to be selected as z > 7.5 galaxies. Six additional candidates present discrepancies between the different photo-z procedures, explained by blending in the CLASSIC catalogue and one discrepant photo-z in the EAZY run. We still consider them as robust and include them in our gold sample. For the last 10 candidates in Table 3, there is a significant probability that these sources are either intermediate redshift galaxies or brown dwarf contaminants.
4.2. Comparison with z > 7.5 candidates from the literature
We find six candidates with a match in the A3COSMOS ALMA catalogue3 (Liu et al. 2019) from the Reionisation Era Bright Emission Line Survey (REBELS, Bouwens et al. 2022). Five of them present [CII]158μm line detection with a spectroscopic redshift from Schouws et al. (in prep.) provided in Table 3. One of them was independently confirmed using a detection of the Lyman-α emission line (Valentino et al. 2022). Only one ALMA source (ID 564423/REBELS-24) does not present a [CII]158μm line detection, either because of too weak SFR, or observations which are still missing for this source (Bouwens et al. 2022). These five spec-z confirm the high-redshift nature z > 7 of our candidates. We find a systematic over-estimate of the photo-z. For the CLASSIC catalogue, these spec-z are consistent with the zPDF (with a PIT4 of 0.3, 0.05, 0.10, 0.13 for ID 336101, ID 978062, ID 1103149, ID 1151531, respectively). For The Farmer catalogue, their PIT is below 0.02 and the uncertainties for these five sources are underestimated. While this comparison could suggest a systematic over-estimate of the photo-z, we note that these sources could be really specific, which could explain their detection of [CII]158μm with ALMA. Therefore, we do not extrapolate this trend to the full population at this stage. In Sect. 5, we replace the photo-z of these five sources by their spec-z.
We compare our candidates to those previously identified by S19 and B20 in the COSMOS field based on ground-based imaging. S19 (see also Stefanon et al. 2017) used the near-infrared broad and narrow bands from UltraVISTA DR3, all the available CFHT/MegaCam, Subaru/Suprime-Cam optical bands and Spitzer/IRAC channels 1 to 4 in the mid-infrared. This study also benefited from HST/WFC3 coverage from the Drift And SHift mosaic (DASH; Momcheva et al. 2016; Mowla et al. 2019), with an improved spatial resolution. The HSC imaging was not available at the time of their initial sample selection but the authors used the HSC-SSP DR1 data to validate their candidate list, checking that there was no significant detection in the optical. S19 identified 16 galaxy candidates in the COSMOS field, including 10 at z ∼ 8 and 6 at z ∼ 9.
B20 included the UltraVISTA DR4 data and the Spitzer/IRAC [3.6] and [4.5] images from SPLASH, SEDS, and SMUVS in the infrared. Optical data consisted of the CFHT/MegaCam u*, g, r, i, z broad bands from CFHTLS, and the HSC-SSP DR1 g, r, i, z, y broad bands. The Suprime-Cam z′ band, deeper than the HSC/z band in DR1 release, was also used. The search was performed in the HSC ultra-deep area. B20 recovered seven candidates from S19 and selected nine new candidates for a total of 16 LBG at 7.5 < z < 9.1 in the COSMOS field, including 14 at z ∼ 8 and 2 at z ∼ 9.
We select 15 out of the 25 high-redshift candidates from S19 and B20. The majority of these candidates present single-peaked redshift probability distributions located at z > 7, and are classified as galaxies in both COSMOS2020 catalogues. The identifiers from S19 and B20 are shown in Table 3. The 10 rejected candidates from S19 and B20 are described in details in Appendix B.3. Four of those candidates include strong low-redshift solutions, and six are not detected in the combined izYJHKs image. Since these galaxies are not expected to be visible in the i and z bands, the signal may be diluted in the combined izYJHKs detection image. To test the impact of such approach, we matched these six sources with the official release catalogues from UltraVISTA DR4 (McCracken et al. 2012) with a detection performed in each VIRCAM band. These sources do not have any counterpart in the Ks catalogue. One source from S19 is detected only in the H selected catalogue (but not identified in COSMOS2020 or B20 because of the proximity of a bright source J = 20.7). Another source from S19 is only detected in the J-band selected catalogue with a magnitude of J = 26.3 ± 0.1. At best, we could have retrieved one of these six candidates with a detection performed in each VIRCAM band, rather than our combined izYJHKs detection image.
Finally, we checked the z ≥ 7 galaxy candidates identified in CANDELS (Bouwens et al. 2015b). None of these sources are in our sample considering our selection criteria at z ≥ 7.5. Although deeper, CANDELS covers a smaller area of 151.9 arcmin2, which is less efficient when selecting the brightest sources at z > 7.5.
4.3. Lensing magnification
Any high-redshift galaxy sample may be subject to gravitational lensing, and in particular lensing magnification, from massive, low-redshift galaxies (e.g. Mason et al. 2015; Barone-Nugent et al. 2015; Roberts-Borsani et al. 2016). While gravitational lensing preserves surface brightness, the apparent solid angle of the background source may increase, leading to an increased apparent flux.
We investigate the possible impact of lensing magnification on our selected galaxy candidates. We search the full COSMOS2020 catalogue for massive low-redshift galaxies within a 20″ radius for each candidate galaxy5. Lens galaxies are modelled as singular isothermal spheres (SIS). Stellar velocity dispersions are estimated from photometry through the Faber-Jackson relation (FJR; Faber & Jackson 1976 of Barone-Nugent et al. 2015), based on the rest-frame B-band absolute magnitude and calibrated using early-type galaxies with redshifts spanning 0 < z < 1.6. Velocity dispersion uncertainties are dominated by the intrinsic scatter in the FJR, estimated at 46 km s−1. We checked that these velocity dispersion estimates are consistent with the FJR of Bernardi et al. (2003) using i-band absolute magnitudes. Photometric redshifts and absolute magnitudes in the rest-frame Suprime-Cam/B are taken from The Farmer catalogue. We restrict the lens selection to galaxies with a velocity dispersion of at least σv = 200 km s−1, because the spectroscopic samples used to calibrate the FJR become incomplete at lower values (Barone-Nugent et al. 2015). In addition, we only include lenses with a magnification of μ ≥ 1.1.
We find that eight candidates out of 32 are probably magnified with 1.1 < μ < 1.2, and 5 galaxies with μ ≥ 1.2. This includes five already identified candidates from S19 and B20. However, we find no evidence of strongly lensed galaxies with multiple images. The most magnified candidate is ID 441697, with a cumulative magnification of μ = 2.36 ± 0.80 from five lenses within 14″, representing a boost of 0.9 mag. The main contribution comes from a  galaxy located within 4.6″ and with a σv = 231 km s−1 velocity dispersion, leading to a μ = 1.37 ± 0.20 magnification. The second most magnified candidate is ID 442053 because of two sources, one
  galaxy at 6.0″ with σv = 218 km s−1 and μ = 1.14 ± 0.07, and one
  galaxy at 4.0″ with σv = 207 km s−1 and μ = 1.17 ± 0.09. The candidate Y8 (ID 1209618) has a
  galaxy at a 4.4″ distance with a velocity dispersion of σv = 215 km s−1, which gives a μ = 1.21 ± 0.11 magnification. This candidate was already identified as magnified by S19, who found a 40 km s−1 higher velocity dispersion and a 0.3″ smaller angular separation6, resulting in a higher magnification μ = 1.39. Three other candidates (Y1, Y10, Y12) from S19 are moderately magnified, with 1.1 < μ < 1.2.
Consequently, every object in our z ≥ 7.5 sample is potentially affected by lensing magnification. However, as we shall see in Sect. 6.2, the impact of this magnification remains limited on our luminosity function measurements.
The velocity dispersion values quoted above are extracted from the FJR and their uncertainties reach 46 km s−1 due to the scatter of the relation (Barone-Nugent et al. 2015). Moreover, the velocity dispersion may be overestimated, because of the calibration based on early-type galaxies, leading to overestimated magnifications. Inversely, we note that the velocity dispersion lower limit of σv = 200 km s−1 significantly restricts the number of lens galaxies, so that the reported total magnifications may be underestimated. This will need to be further investigated with more precise velocity dispersion estimates at fainter luminosities.
5. The UV luminosity function
In this section, we use our z ≥ 7.5 candidates to make a new measurement of the bright end of the UVLF. We select objects brighter than H = 25.6, equivalent to the 5σ depth in the ultra-deep stripes. We use the 0.812 deg2 of the HSC-masked UltraVISTA ultra-deep area, so we do not include the 4 candidates selected in the deep area. This ensures a homogeneous selection function across the field. We take the physical parameters estimated with the LePhare/The Farmer configuration. This is necessary because the blended candidates are not included in the CLASSIC selection.
We split our galaxy sample into three redshift bins, centred at z = 8, 9, 10 with a Δz = 1 width. Since the photometric redshift estimates mainly rely on infrared broad-band imaging, the redshift probability distributions are relatively broad in the interval 7 < z < 10, and so are the photometric redshift uncertainties. As a result, the candidates with photometric redshifts at the limit between two adjacent bins may be scattered in one bin or the other. Therefore, we develop a Monte Carlo simulation to propagate the photometric uncertainties into the absolute magnitude estimates. We generate 500 realisations of the high-redshift candidates. For each realisation, we add noise to the observed flux, according to the photometric uncertainty measured in the considered band. We base our estimate of the UVLF on the 500 catalogues for which the photo-z and absolute magnitudes have been derived.
We adopt the spec-z derived with REBELS, when possible. As a result, two sources among the five are included in our first redshift range, for which we recompute the FUV absolute magnitudes.
5.1. Completeness correction
To estimate the completeness of our sample of high-redshift galaxies, we simulate point-like sources with a Moffat profile (Moffat 1969) with parameter β = 3 and a FWHM of 0.9″. We generate these objects with a uniform distribution in magnitude over 22 < H < 27 and in position over the ultra-deep stripes area and add them to the J, H, Ks bands, avoiding placing objects on masked areas or where object are present in the segmentation map derived from the CHI_MEAN image (see Sect. 2.2). We then generate a new CHI_MEAN detection image from these simulated J, H, Ks images combined with the original i, z, Y images. Object detection is repeated using the same parameters as the main catalogue and using this new CHI_MEAN image. The resulting catalogue is cross-correlated with the input simulated catalogue to the find the fraction of recovered sources as a function of magnitude.
We must assume colours for the simulated galaxies. We use LePhare and the BC03 templates to predict the expected colours. For E(B − V) = 0.1, we find average colours of J − H = 0.05, 0.49, 4.94 at z = 8, 9, 10, respectively, and Ks − H = 0.00, −0.10, −0.09 at z = 8, 9, 10, respectively. The predicted Ks − H colours do not vary by more than 0.25 mag at z > 7, depending on the assumed attenuation. We simplify the simulation by assuming J = H = Ks for galaxies at z ∼ 8, and H = Ks for galaxies at z ∼ 9 and 10, with no flux contribution in the other bands.
We estimate the completeness as a function of the H-band magnitude, defined as the fraction of recovered sources in the CHI_MEAN image. At z ∼ 8, we find a drop in completeness from 84% to 60% between H = 25 to 25.6, the latter being our selection limit. At z ∼ 9 and 10, the completeness drops from 72% to 37% in the same magnitude range.
We do not attempt to correct for contamination or incompleteness in our selection method, considering that possible biases in the redshift estimate (as shown by the comparison with ALMA) dominate the uncertainty budget and cannot be captured by a simulation. Moreover, the use of the zPDF to generate multiple realisations of the UVLF would make such correction difficult, since a single source is split in several redshift bins.
5.2. Binned luminosity function
Absolute UV magnitudes are computed with LePhare in the GALEX far-UV filter7, as follows:
 (1)
(1)
with mf being the observed magnitude in the filter f, DM the distance modulus. KC is the sum of the k-correction kf and a rest-frame colour term, all derived from the best-fit SED. The filter f is chosen among J, H, Ks, [3.6] to minimise the SED dependency of the KC term (Ilbert et al. 2005). For each source, we list in Table 3 the median of the MUV distribution, as well as the associated 0.16 and 0.84 quantiles.
The binned luminosity function is calculated using the Vmax estimator (Schmidt 1968). This estimator is non-parametric, although the number of bins and the bin widths are set, and implicitly assumes a uniform spatial distribution of galaxies. The number density in a given magnitude bin depends on the maximum volume Vmax in which each galaxy could have been selected. This volume, for a given galaxy i, is computed as:
 (2)
(2)
where zmin, i and zmax, i are the lower and upper redshift limits in which a galaxy i can be included in the sample, and dV is the differential co-moving volume. The co-moving volume is defined as the shell between the limits of the redshift bins. The maximum redshift zmax, i is the redshift at which a galaxy with the same intrinsic properties would not be selected in our sample, with a flux limit set to H = 25.6. Thus, the luminosity function ϕ can be expressed as:
 (3)
(3)
where N(M) is the number of galaxies in the magnitude bin centred at M and of width ΔM, considering all the Nreal = 500 realisations of the catalogues. wi is the inverse of the completeness estimated at the H-band magnitude of the galaxy i. The associated Poisson uncertainties σϕ are computed as Marshall (1985):
 (4)
(4)
The total uncertainties are computed as the quadratic sum of the Poisson errors and cosmic variance errors, estimated following Trenti & Stiavelli (2008). Since the galaxy samples become incomplete at faint magnitudes, the LFs are computed brightward of MUV = −21.5.
The galaxy UV luminosity functions at z = 8, 9, 10 estimated from the selected galaxy candidates are represented in Figs. 3–5, and tabulated in Table 4. In magnitude bins with no galaxies, we put an upper limit with the number density computed from one galaxy. Cosmic variance represents about 14% of the Poisson uncertainties at MUV < −23, 20% at MUV = −22.75, and 30% at MUV = −22.25.
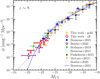 |
Fig. 3. Galaxy UV luminosity functions at z = 8. The red symbols show number densities from the galaxy sample presented in this work (uncorrected for incompleteness). The upper limits are at 1σ. The orange diamonds correspond to the measurement only based on the gold sample. The data points from B20; S19; Bouwens et al. (2021, 2015b), Finkelstein et al. (2015), McLure et al. (2013) are represented. The best-fitting double power-law function from B20 and the Schechter function from Bouwens et al. (2021) are displayed. |
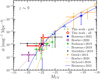 |
Fig. 4. Galaxy UV luminosity functions at z = 9 as in Fig. 3. Data points from B20; S19; Bouwens et al. (2021, 2019), Morishita et al. (2018), Oesch et al. (2013) are shown. The best-fitting double power-law function from B20 and the Schechter function from McLeod et al. (2016) are displayed. |
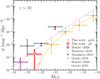 |
Fig. 5. Galaxy UV luminosity functions at z = 10, as in Fig. 3. Data points from B20; Bouwens et al. (2019), Morishita et al. (2018), Oesch et al. (2018) are shown. The best-fitting double power-law function from B20 and the Schechter function from Oesch et al. (2018) are displayed. |
Galaxy luminosity functions derived from all the z ≥ 7.5 candidates.
We show in Fig. 6 the three UVLFs. Given the magnitude limit at H < 25.6, we cover the brightest end of the UVLF at −23 < MUV < −21.5. There is no clear evolution of the number densities from z = 8 to z = 9, with an equivalent number of candidates at −22.5 < MUV < −21.5 in both redshift bins. At z = 10, the density in the single absolute magnitude bin is lower than at z = 9, but the median MUV is shifted to brighter magnitudes and could follow a simple extrapolation of the LF at lower redshift. However, the constraint on the UVLF at z ∼ 10 remains weak.
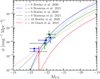 |
Fig. 6. Galaxy UV luminosity functions from z = 8 to z = 10. Our results are shown with blue, green, and red squares for z = 8, 9, 10, respectively. The dotted and solid lines are results from the literature using the same colours, for double power-law functions and Schechter functions, respectively. |
We provide a constraint on the brightest part of the UVLF and over 1.5 mag range, thus the shape of the UVLF cannot be constrained from our data alone. Hence, we do not attempt a fit with a power law or a Schechter function. Nevertheless, we discuss the consistency with the various fitting forms when comparing with the literature in Sect. 5.3.
5.3. Comparison with UVLFs from the literature
The calculated UVLFs are in good agreement with results from the literature in particular at MUV < −22. This suggests that our sample is complete for the brighter magnitude bins. The most straightforward comparison is with B20 who used the same near-infrared images as this work (see Sect. 4.2). In the COSMOS field, we have 12 galaxy candidates in common. However, the authors analysed about 6 deg2 of imaging data from both the COSMOS and the XMM-LSS fields, sampling larger co-moving volumes than in this work.
All candidates from B20 at z < 8.5 and MUV < −22.5 are outside the COSMOS field, and this is the reason for their better constraint on the bright end of the UVLF. Nonetheless, our number densities at MUV < −22.5 are in excellent agreement with B20 and S19.
At redshift z ∼ 10, the number densities computed from the three candidates selected in this work are in agreement with the double power-law evolution from B20. The candidate XMM3-3085 from B20, identified in the XMM-LSS field with a photometric redshift of zphot = 10.8 ± 1.0, is extremely bright with an absolute magnitude of MUV = −23.7 and H = 23.9. It is the brightest z > 7 galaxy candidate ever found in the literature, although spectroscopic confirmation is still required. The z ∼ 10 candidate 2140+0241–303 from Morishita et al. (2018) has an HST/F160W flux of 24.4 mag and an absolute magnitude of MUV = −22.6. The authors used the Brightest of Reionising Galaxies (BoRG[z9]) survey, including HST optical and near-infrared imaging in five broad bands over 370 arcmin2, in addition to IRAC/[3.6] imaging. The resulting number density from that paper is an order of magnitude higher than our results at MUV < −22.5.
We compare our results with Bouwens et al. (2021), who used the most comprehensive compilation of HST data taken on deep fields. Our results at z ∼ 8 and 9 are consistent within the uncertainties. The faintest of our points at z ∼ 8 falls below their fit by a factor two in density. At z ∼ 10, they considered the results from Oesch et al. (2018) which indicate a sharp decline of the galaxy density at MUV < −22. Our data probe brighter absolute magnitudes (our only point is brighter than MUV < −22 while their brightest point is at MUV = −21.25). However, the lower density of our fit is unconstrained and consistent with zero. Therefore, we cannot draw clear conclusions regarding differences with Oesch et al. (2018).
6. Discussion
6.1. Sources of contamination
The most obvious explanation for the high density of bright sources at z ≥ 7.5 is the contamination by low-redshift galaxies or brown dwarfs wrongly classified as z > 9 candidates. Even if we combine several photometric redshift codes, and two different methods to extract the photometry, contamination of our sample remains a possibility. In Sect. 4.1, we found 10 candidates with a significant probability of being either dusty star-forming galaxies at intermediate redshift or brown dwarf contaminants. Seven over ten of these candidates fall on the westernmost ultra-deep stripe with a lower HSC and IRAC coverage (see Fig. 1). The larger surface density of sources in this stripe compared to the others points out towards a significant population of contaminants among these ten galaxies.
In Figs. 3–5, we present the UVLF after having removed these sources (gold squares). We find that the measurement at 7.5 < z < 8.5 is severely affected by this removal, as expected since 7 sources have a photo-z estimated in this redshift range. Therefore, the density could be affected by a factor 2 if all these sources are in fact contaminants.
A systematic overestimate of the photo-z could also impact the UVLF. The 5 sources with a spec-z have a systematically higher photo-z (see Sect. 4.1). If this trend affects the whole sample, galaxies could move in a lower redshift bin. Given the shape of the redshift distribution, it would lead to an overestimation of the UVLF density. A better modelling of the galaxy properties (e.g. dust attenuation law, emission lines) could alleviate these biases. We are particularly sensitive to the modelling because the major feature used to derive the photo-z at this epoch, namely the continuum break around 1216 Å, cannot be accurately located. Indeed, this break is redshifted within the gap between the ground-based Y and J-bands for galaxies between z ∼ 7.6 and z ∼ 8.7. Spectroscopic confirmation of the candidate redshifts is the solution to alleviate these uncertainties (Muñoz & Loeb 2008), as well as future space mission without such gap between near-infrared filters.
In addition, the uncertainties in the absolute UV magnitudes may affect the bright end through the Eddington bias (Eddington 1913). Because of the steep slope of the luminosity function, there are statistically more faint galaxies scattered in the brighter bins than the reverse, resulting in a flattened slope. The Eddington bias is also stronger for steep luminosity functions. In the selected galaxy sample, photometric redshift uncertainties can be relatively large, leading to large uncertainties once propagated to absolute magnitudes. This bias may be limited by using large magnitude bins.
The presence of Active Galaxy Nuclei (AGN) in the selected galaxy sample may also affect the estimated galaxy UVLF at the bright end. High-redshift AGN have Lyman alpha break features similar to star-forming galaxies without an AGN component. At intermediate redshifts 4 < z < 6, the contribution from faint AGN dominates the number densities at MUV < −23, whereas it becomes negligible at MUV > −22 (Ono et al. 2018; Harikane et al. 2022). At z > 6, the number density of faint AGN is still uncertain. The evolution of the quasar spatial density is often parametrised as ρ(z)∝10k(z − 6), with k ≃ −0.47 from z = 3.5 to z = 5 (Fan et al. 2001) and k ≃ −0.72 from z = 5 to z = 6 (Jiang et al. 2016). Recently, Wang et al. (2019) measured a consistent value k ≃ −0.78 from z = 6 to z = 6.7. With this accelerated redshift evolution, high-redshift AGN are sufficiently rare such that they have a negligible impact on the galaxy number density at MUV = −23 in a survey of this size. The faint-end slope of the quasar UV luminosity function is nonetheless poorly constrained at high redshift (Matsuoka et al. 2019).
6.2. Impact of magnification
As a consequence of gravitational lensing at very high redshifts, and in particular for steep luminosity functions (Mason et al. 2015), the bright end of the luminosity function is expected to be artificially higher. As discussed in Sect. 4.3, we find no evidence of strongly magnified galaxies in the selected sample; although, candidates are still affected by multiple lenses, leading to cumulative magnifications up to μ = 2.4. We estimate the UVLF after having corrected the UV absolute magnitudes from the magnification (not attempting to correct the density). The binned UVLF at z = 8 and z = 9 remain unchanged. Thus, magnification bias does not explain the lack of evolution of the UVLF bright end at the probed magnitudes. In the z = 10 galaxy sample, the candidate ID 441697 with a cumulative magnification of μ = 2.36 becomes fainter than MUV = −22 after removing the effect of lensing. Therefore, it would even lower down the density found at z ∼ 10.
6.3. Shape of the UVLF
It is well established that the UVLF at z < 6 is well-fit with a Schechter function (e.g. Moutard et al. 2020; Bouwens et al. 2021). At the same time, the very different shape of the bright and massive ends of the dark matter (DM) halo mass function from cosmological models and the observed galaxy luminosity function is currently explained with “quenching”, or any process which can halt star formation in these haloes and galaxies. This cessation of the star-forming activity can be due to numerous processes like AGN feedback (e.g. Croton et al. 2006; Hopkins et al. 2006) or halo quenching due to shock-heated gas in halos more massive than 1012 M⊙ (e.g. Somerville et al. 2008; Gabor & Davé 2015). Peng et al. (2010) showed that if the quenching rate is proportional to the SFR, it would naturally lead to a galaxy luminosity function with a Schechter shape.
While the Schechter form is well established at z < 6, whether this holds at higher redshifts is unclear. Bowler et al. (2015) find a high density of sources at MUV < −22 and conclude that the UVLF at z > 8 is better fit with a power law than a Schechter function, without displaying an exponential cutoff at the bright end. We confirm the density measured by B20 and our points are superposed on their extrapolation of the UVLF with a power law. Our measurements are inconsistent with the Schechter function obtained by McLeod et al. (2016), and the density of galaxies we measure is ten times higher than expected by their extrapolation to bright magnitudes (or brighter by 0.4 mag). The brightest galaxies observed by McLeod et al. (2016) is at MUV = −20.7, not allowing them to constrain the UVLF in the bright regime probed by our data.
The latest estimates by Bouwens et al. (2021) compile all HST measurements and find that the UVLF are consistent with a Schechter function at z ∼ 8 − 9. The new Schechter parameters obtained by Bouwens et al. (2021) shift the exponential cut-off at brighter magnitude than previous publications (e.g. McLeod et al. 2015). This is more consistent with the density of galaxies we find at MUV < −22. At z ∼ 8, our faintest point falls below their fit; however, such an effect could be explained by some residual incompleteness that is not corrected in our measurement. We find that our points are still consistent with their fit at z ∼ 9. So, we cannot reject the Schechter fit by Bouwens et al. (2021).
6.4. Lack of evolution at the bright end
The UVLF evolves rapidly at magnitudes fainter than MUV > −20.5. At a given density of ϕ ∼ 10−4 mag−1 Mpc−3, we expect a brightening of about 0.7 mag between z ∼ 9 and z ∼ 8 following the latest compilation from Bouwens et al. (2021). Between z ∼ 9 and z ∼ 10, this trend is even more extreme with a brightening of 0.9 mag. This evolution is interpreted as the galaxy population following the growth of the dark matter halos with a constant star-formation efficiency (Oesch et al. 2018).
In contrast with the faint end, the density of galaxies at MUV ∼ −22 is consistent with no evolution from z ∼ 8 to z ∼ 9 as shown in Fig. 6. This is consistent with the findings of B20.
One interpretation is that quenching efficiency increases between z = 9 and z = 8 at high mass and as a consequence we observe the building of the exponential cut-off of the UVLF. Peng et al. (2010) introduced a quenching rate proportional to the SFR to preserve a constant characteristic stellar mass around 1010.6 M⊙. If we extrapolate the relation between MUV and stellar mass found by Stefanon et al. (2021), we do not reach this regime at z = 8. Also, halo quenching is efficient above 1012 M⊙ (Cattaneo et al. 2006). According to Stefanon et al. (2021), galaxies in our sample are hosted by lower mass halos. So, mass quenching is not expected to be efficient yet. However, the physical conditions at z > 8 may be different from those considered in lower redshift studies and the quenching mechanisms may be already effective for lower mass galaxies or DM halos.
Another possibility is that dust is generated in significant quantities between z = 9 and z = 8 (Finkelstein et al. 2015), sufficiently to decrease the light emerging from the brightest UV galaxies at z = 8, leading to the wrong interpretation that the density of bright galaxies remains the same between z = 9 and z = 8. Indeed, if dust is increasing with decreasing MUV, it would bend the bright end of the luminosity function, with a more pronounced dimming of the UV absolute magnitudes at bright magnitudes8. The mean dust content is generally expected to decrease with increasing redshift in particular for bright galaxies (e.g. Bouwens et al. 2016), because of the low metallicity of young stars in galaxies. Hence, the mean dust attenuation at z > 9 is often assumed to be zero (e.g. Bouwens et al. 2015b), so that the bright end of the UVLF is expected to reflect the recent star formation in the galaxy population.
7. Summary and conclusions
This paper presents one of the first science results from the COSMOS2020 catalogues: a search for candidate z ≥ 7.5 galaxies at the epoch of the reionisation of the Universe. The deep optical, near-infrared, and mid-infrared imaging over the 1.4 square-degree field of COSMOS enables the detection of rare and bright galaxies, a complementary population to the much fainter galaxies found in deep pencil beam surveys such as CANDELS or HUDF.
COSMOS2020 uses the latest and deepest optical, mid-infrared, and near-infrared imaging in COSMOS. It includes the most recent UltraVISTA DR4 data together with new optical data from the HSC-SSP PDR2 release. We also used new images comprising all of the Spitzer/IRAC [3.6], [4.5] bands’ data ever taken on COSMOS from the Cosmic Dawn Survey. From these data, we extracted two photometric catalogues using independent approaches: the CLASSIC catalogue measures colours using circular aperture photometry, whilst The Farmer catalogue colours are measured based on a fit of surface brightness models. Sources were detected in a combined izYJHK image.
The galaxy selection was primarily based on photometric redshifts estimated from SED fitting with LePhare and their associated zPDF. We selected sources with a robust solution at z ≥ 7.5 with LePhare using either the CLASSIC or The Farmer catalogues. The final sample consists of 32 candidates at z ≥ 7.5, including 17 unpublished candidates. To assess the robustness of the COSMOS2020 photo-z estimates, we computed new sets of photometric redshifts with three different template-fitting procedures using LePhare and EAZY, with both the CLASSIC and The Farmer catalogues. We isolated a gold sample of 22 out of 32 candidates, which is more robust. Among them, four blended candidates were identified thanks to the profile-fitting photometry from The Farmer, where the contamination of light from nearby sources can be identified. These candidates have low photo-z solutions of z < 3 with the CLASSIC catalogue because of the optical flux of the nearby sources. This illustrates the effectiveness of profile-fitting techniques in deblending confused sources typically found in the search of distant galaxies. The final sample of high-redshift galaxies is therefore more complete.
From this unique list of z ≥ 7.5 star-forming galaxies, we made a new determination of the bright end of the UV luminosity functions in three redshift bins, centred at z = 8, 9, 10. There is no clear evolution of the number densities from z = 8 to z = 9 between −23 < MUV < −21.5, which is in excellent agreement with B20. One interpretation is that quenching efficiency increases between z = 9 and z = 8. Another possibility is that dust is generated in a significant quantity, which is sufficient enough to decrease the light emerging from the brightest UV galaxies at z = 8. Another explanation for the high density of bright sources at z ≥ 7.5 is the contamination by low-redshift galaxies or brown dwarfs, or a systematic overestimation of photometric redshifts. Spectroscopic confirmation is thus essential. Follow-up observations with JWST-NIRSpec (Weaver et al. 2021) are planned for five of our brightest candidates (see Table 3). We have also begun a systematic follow-up of these candidates with the WERLS Key Strategic Mission Support Program on Keck (Casey et al., in prep.).
This work has demonstrated the great potential of COSMOS2020 for finding rare, luminous objects in the distant Universe and the benefit from using multiple photometric extraction techniques and photometric redshift codes to assess the robustness of the results. In the longer term, deep Euclid near-infrared observations of COSMOS and other Cosmic dawn survey fields, together with our approved 218 + 80 h, 0.6 deg2 COSMOS-Webb proposal, will provide the ultimate survey of bright, luminous objects in the early Universe.
Reducing the parameter space could be seen as a prior for the general population.
We note that even if the source is undetected in a given image, a flux is always provided with an associated uncertainty at the position indicated in the combined CHI_MEAN image.
Probability Integral Transform (PIT, Dawid 1984) defined as 
We identify lenses leading to magnifications μ ≥ 1.1 up to a 15″ angular distance.
We find an astrometric shift of  in declination compared to S19 for the candidate Y8 (ID 1209618). This is more than the shift of about
  induced by the change of astrometric calibration from UltraVISTA DR3 to DR4. We note that this candidate remains faint with H > 25.6, which may have led to uncertain coordinates in S19 who used DR3.
With a central wavelength of 1526 Å and a full-width at half maximum of 224 Å.
We stress that dust was included in our modelling of the galaxy SED during the fitting process, but we did not correct the MUV absolute magnitudes for dust attenuation.
Acknowledgments
We are grateful to the referee for a careful reading of the manuscript and useful suggestions. This paper is dedicated to Olivier Le Fèvre who initiated this work and devoted so much energy and passion to building the COSMOS survey. We warmly acknowledge the contributions of the entire COSMOS collaboration consisting of more than 100 scientists. The HST-COSMOS program was supported through NASA grant HST-GO-09822. More information on the COSMOS survey is available at https://cosmos.astro.caltech.edu. This research is also partly supported by the Centre National d’Etudes Spatiales (CNES). OI acknowledges the funding of the French Agence Nationale de la Recherche for the project “SAGACE”. HJMcC acknowledges support from the PNCG. ID has received funding from the European Union’s Horizon 2020 research and innovation program under the Marie Skłodowska-Curie grant agreement No. 896225. This work used the CANDIDE computer system at the IAP supported by grants from the PNC, DIM-ACAV and the CNES and maintained by S. Rouberol. BMJ is supported in part by Independent Research Fund Denmark grant DFF – 7014-00017. The Cosmic Dawn Center (DAWN) is funded by the Danish National Research Foundation under grant No. 140. ST, GB and JW acknowledge support from the European Research Council (ERC) Consolidator Grant funding scheme (project ConTExt, grant No. 648179). CMC thanks the National Science Foundation for support through grants AST-1814034 and AST-2009577, and the Research Corporation for Science Advancement from a 2019 Cottrell Scholar Award sponsored by IF/THEN, an initiative of Lyda Hill Philanthropies. CMC thanks the National Science Foundation for support through grants AST-1814034 and AST-2009577, and the Research Corporation for Science Advancement from a 2019 Cottrell Scholar Award sponsored by IF/THEN, an initiative of Lyda Hill Philanthropies. The authors wish to recognise and acknowledge the very significant cultural role and reverence that the summit of Mauna Kea has always had within the indigenous Hawaiian community. We are most fortunate to have the opportunity to conduct observations from this mountain. This work is based on data products from observations made with ESO Telescopes at the La Silla Paranal Observatory under ESO program ID 179.A-2005 and on data products produced by CALET and the Cambridge Astronomy Survey Unit on behalf of the UltraVISTA consortium. This work is based in part on observations made with the NASA/ESA Hubble Space Telescope, obtained from the Data Archive at the Space Telescope Science Institute, which is operated by the Association of Universities for Research in Astronomy, Inc., under NASA contract NAS 5-26555.
References
- Aihara, H., Arimoto, N., Armstrong, R., et al. 2018, PASJ, 70, S4 [NASA ADS] [Google Scholar]
- Aihara, H., AlSayyad, Y., Ando, M., et al. 2019, PASJ, 71, 114 [Google Scholar]
- Aihara, H., AlSayyad, Y., Ando, M., et al. 2022, PASJ, 74, 247 [NASA ADS] [CrossRef] [Google Scholar]
- Anders, P., Bissantz, N., Boysen, L., & de Grijs, R. 2003, A&A, 401, 1063 [NASA ADS] [CrossRef] [EDP Sciences] [Google Scholar]
- Arnouts, S., Moscardini, L., Vanzella, E., et al. 2002, MNRAS, 329, 355 [Google Scholar]
- Arnouts, S., Le Floc’h, E., Chevallard, J., et al. 2013, A&A, 558, A67 [NASA ADS] [CrossRef] [EDP Sciences] [Google Scholar]
- Ashby, M. L. N., Willner, S. P., Fazio, G. G., et al. 2013, ApJS, 769, 80 [NASA ADS] [Google Scholar]
- Ashby, M. L. N., Caputi, K. I., Cowley, W., et al. 2018, ApJS, 237, 39 [CrossRef] [Google Scholar]
- Baraffe, I., Homeier, D., Allard, F., & Chabrier, G. 2015, A&A, 577, A42 [NASA ADS] [CrossRef] [EDP Sciences] [Google Scholar]
- Barone-Nugent, R. L., Wyithe, J. S. B., Trenti, M., et al. 2015, MNRAS, 450, 1224 [NASA ADS] [CrossRef] [Google Scholar]
- Bernardi, M., Sheth, R. K., Annis, J., et al. 2003, AJ, 125, 1849 [NASA ADS] [CrossRef] [Google Scholar]
- Bertin, E., & Arnouts, S. 1996, A&AS, 117, 393 [NASA ADS] [CrossRef] [EDP Sciences] [Google Scholar]
- Bertin, E., Mellier, Y., Radovich, M., et al. 2002, in Astronomical Data Analysis Software and Systems XI, eds. D. A. Bohlender, D. Durand, T. H. Handley, et al., ASP Conf. Ser., 281, 228 [Google Scholar]
- Bouwens, R. J., Illingworth, G. D., Franx, M., & Ford, H. 2008, ApJ, 686, 230 [NASA ADS] [CrossRef] [Google Scholar]
- Bouwens, R. J., Illingworth, G. D., Oesch, P. A., et al. 2015a, ApJ, 811, 140 [NASA ADS] [CrossRef] [Google Scholar]
- Bouwens, R. J., Illingworth, G. D., Oesch, P. A., et al. 2015b, ApJ, 803, 34 [Google Scholar]
- Bouwens, R. J., Aravena, M., Decarli, R., et al. 2016, ApJ, 833, 72 [NASA ADS] [CrossRef] [Google Scholar]
- Bouwens, R. J., Stefanon, M., Oesch, P. A., et al. 2019, ApJ, 880, 25 [NASA ADS] [CrossRef] [Google Scholar]
- Bouwens, R. J., Oesch, P. A., Stefanon, M., et al. 2021, AJ, 162, 47 [NASA ADS] [CrossRef] [Google Scholar]
- Bouwens, R. J., Smit, R., Schouws, S., et al. 2022, ApJ, 931, 160 [NASA ADS] [CrossRef] [Google Scholar]
- Bowler, R. A. A., Dunlop, J. S., McLure, R. J., et al. 2014, MNRAS, 440, 2810 [NASA ADS] [CrossRef] [Google Scholar]
- Bowler, R. A. A., Dunlop, J. S., McLure, R. J., et al. 2015, MNRAS, 452, 1817 [Google Scholar]
- Bowler, R. A. A., Dunlop, J. S., McLure, R. J., & McLeod, D. J. 2017, MNRAS, 466, 3612 [NASA ADS] [CrossRef] [Google Scholar]
- Bowler, R. A. A., Jarvis, M. J., Dunlop, J. S., et al. 2020, MNRAS, 493, 2059 [Google Scholar]
- Brammer, G. B., van Dokkum, P. G., & Coppi, P. 2008, ApJ, 686, 1503 [Google Scholar]
- Bridge, J. S., Holwerda, B. W., Stefanon, M., et al. 2019, ApJ, 882, 42 [NASA ADS] [CrossRef] [Google Scholar]
- Bruzual, G., & Charlot, S. 2003, MNRAS, 344, 1000 [NASA ADS] [CrossRef] [Google Scholar]
- Calzetti, D., Armus, L., Bohlin, R. C., et al. 2000, ApJ, 533, 682 [NASA ADS] [CrossRef] [Google Scholar]
- Cattaneo, A., Dekel, A., Devriendt, J., Guiderdoni, B., & Blaizot, J. 2006, MNRAS, 370, 1651 [NASA ADS] [CrossRef] [Google Scholar]
- Chabrier, G. 2003, PASP, 115, 763 [Google Scholar]
- Cirasuolo, M., McLure, R. J., Dunlop, J. S., et al. 2007, MNRAS, 380, 585 [NASA ADS] [CrossRef] [Google Scholar]
- Conroy, C., & Gunn, J. E. 2010, ApJ, 712, 833 [Google Scholar]
- Conroy, C., Gunn, J. E., & White, M. 2009, ApJ, 699, 486 [Google Scholar]
- Cooray, A., & Ouchi, M. 2006, MNRAS, 369, 1869 [NASA ADS] [CrossRef] [Google Scholar]
- Croton, D. J., Springel, V., White, S. D. M., et al. 2006, MNRAS, 365, 11 [Google Scholar]
- Davis, M., Guhathakurta, P., Konidaris, N. P., et al. 2007, ApJ, 660, L1 [NASA ADS] [CrossRef] [Google Scholar]
- Dawid, A. 1984, J. R Stat. Soc., 147, 278 [Google Scholar]
- Dayal, P., & Ferrara, A. 2018, Phys. Rep., 780, 1 [Google Scholar]
- Dunlop, J. S., Cirasuolo, M., & McLure, R. J. 2007, MNRAS, 376, 1054 [NASA ADS] [CrossRef] [Google Scholar]
- Eddington, A. S. 1913, MNRAS, 73, 359 [Google Scholar]
- Euclid Collaboration (Moneti, A., et al.) 2022, A&A, 658, A126 [NASA ADS] [CrossRef] [EDP Sciences] [Google Scholar]
- Faber, S. M., & Jackson, R. E. 1976, ApJ, 204, 668 [Google Scholar]
- Fan, X., Strauss, M. A., Schneider, D. P., et al. 2001, AJ, 121, 54 [NASA ADS] [CrossRef] [Google Scholar]
- Fan, X., Strauss, M. A., Becker, R. H., et al. 2006, AJ, 132, 117 [NASA ADS] [CrossRef] [Google Scholar]
- Finkelstein, S. L. 2016, PASA, 33, e037 [Google Scholar]
- Finkelstein, S. L., Ryan, J. R. E., Papovich, C., et al. 2015, ApJ, 810, 71 [NASA ADS] [CrossRef] [Google Scholar]
- Finkelstein, S. L., D’Aloisio, A., Paardekooper, J., et al. 2019, ApJ, 879, 36 [NASA ADS] [CrossRef] [Google Scholar]
- Gabor, J. M., & Davé, R. 2015, MNRAS, 447, 374 [NASA ADS] [CrossRef] [Google Scholar]
- Giavalisco, M., Ferguson, H. C., Koekemoer, A. M., et al. 2004, ApJ, 600, L93 [NASA ADS] [CrossRef] [Google Scholar]
- Grogin, N. A., Kocevski, D. D., Faber, S. M., et al. 2011, ApJS, 197, 35 [NASA ADS] [CrossRef] [Google Scholar]
- Harikane, Y., Ono, Y., Ouchi, M., et al. 2022, ApJS, 259, 20 [NASA ADS] [CrossRef] [Google Scholar]
- Hopkins, P. F., Hernquist, L., Cox, T. J., et al. 2006, ApJS, 163, 1 [Google Scholar]
- Hsieh, B., Wang, W., Hsieh, C., et al. 2012, ApJS, 203, 23 [NASA ADS] [CrossRef] [Google Scholar]
- Ilbert, O., Tresse, L., Zucca, E., et al. 2005, A&A, 439, 863 [NASA ADS] [CrossRef] [EDP Sciences] [Google Scholar]
- Ilbert, O., Arnouts, S., McCracken, H. J., et al. 2006, A&A, 457, 841 [NASA ADS] [CrossRef] [EDP Sciences] [Google Scholar]
- Ilbert, O., Capak, P., Salvato, M., et al. 2009, ApJ, 690, 1236 [NASA ADS] [CrossRef] [Google Scholar]
- Ilbert, O., McCracken, H. J., Le Fèvre, O., et al. 2013, A&A, 556, A55 [NASA ADS] [CrossRef] [EDP Sciences] [Google Scholar]
- Ilbert, O., Arnouts, S., Floc’h, E. L., et al. 2015, A&A, 579, A2 [NASA ADS] [CrossRef] [EDP Sciences] [Google Scholar]
- Illingworth, G. D., Magee, D., Oesch, P. A., et al. 2013, ApJS, 209, 6 [Google Scholar]
- Jiang, L., McGreer, I. D., Fan, X., et al. 2016, ApJ, 833, 222 [Google Scholar]
- Jin, S., Daddi, E., Liu, D., et al. 2018, ApJ, 864, 56 [Google Scholar]
- Koekemoer, A. M., Faber, S. M., Ferguson, H. C., et al. 2011, ApJS, 197, 36 [NASA ADS] [CrossRef] [Google Scholar]
- Kulkarni, G., Keating, L. C., Haehnelt, M. G., et al. 2019, MNRAS, 485, L24 [Google Scholar]
- Labbe, I., Caputi, K., McLeod, D., et al. 2016, Completing the Legacy of Spitzer/IRAC over COSMOS, Spitzer Proposal ID 13094 [Google Scholar]
- Laigle, C., McCracken, H. J., Ilbert, O., et al. 2016, ApJS, 224, 24 [Google Scholar]
- Lang, D., Hogg, D. W., & Mykytyn, D. 2016, Astrophysics Source Code Library [record ascl: 1604.008] [Google Scholar]
- Liu, D., Lang, P., Magnelli, B., et al. 2019, ApJS, 244, 40 [Google Scholar]
- Lotz, J. M., Koekemoer, A., Coe, D., et al. 2017, ApJ, 837, 97 [Google Scholar]
- Madau, P. 1995, ApJ, 441, 18 [NASA ADS] [CrossRef] [Google Scholar]
- Madau, P., & Dickinson, M. 2014, ARA&A, 52, 415 [Google Scholar]
- Marshall, H. L. 1985, ApJ, 299, 109 [NASA ADS] [CrossRef] [Google Scholar]
- Mason, C. A., Treu, T., Schmidt, K. B., et al. 2015, ApJ, 805, 79 [NASA ADS] [CrossRef] [Google Scholar]
- Matsuoka, Y., Onoue, M., Kashikawa, N., et al. 2019, ApJ, 872, L2 [Google Scholar]
- McCracken, H. J., Milvang-Jensen, B., Dunlop, J., et al. 2012, A&A, 544, A156 [NASA ADS] [CrossRef] [EDP Sciences] [Google Scholar]
- McLeod, D. J., McLure, R. J., Dunlop, J. S., et al. 2015, MNRAS, 450, 3032 [NASA ADS] [CrossRef] [Google Scholar]
- McLeod, D. J., McLure, R. J., & Dunlop, J. S. 2016, MNRAS, 459, 3812 [NASA ADS] [CrossRef] [Google Scholar]
- McLure, R. J., Dunlop, J. S., Bowler, R. A. A., et al. 2013, MNRAS, 432, 2696 [Google Scholar]
- Moffat, A. F. J. 1969, A&A, 3, 455 [NASA ADS] [Google Scholar]
- Momcheva, I. G., Brammer, G. B., van Dokkum, P. G., et al. 2016, ApJS, 225, 27 [Google Scholar]
- Morishita, T., Trenti, M., Stiavelli, M., et al. 2018, ApJ, 867, 150 [NASA ADS] [CrossRef] [Google Scholar]
- Morley, C. V., Fortney, J. J., Marley, M. S., et al. 2012, ApJ, 756, 172 [NASA ADS] [CrossRef] [Google Scholar]
- Morley, C. V., Marley, M. S., Fortney, J. J., et al. 2014, ApJ, 787, 78 [Google Scholar]
- Moutard, T., Sawicki, M., Arnouts, S., et al. 2020, MNRAS, 494, 1894 [NASA ADS] [CrossRef] [Google Scholar]
- Mowla, L. A., van Dokkum, P., Brammer, G. B., et al. 2019, ApJ, 880, 57 [NASA ADS] [CrossRef] [Google Scholar]
- Muñoz, J. A., & Loeb, A. 2008, MNRAS, 386, 2323 [CrossRef] [Google Scholar]
- Oesch, P. A., Bouwens, R. J., Illingworth, G. D., et al. 2012, ApJ, 745, 110 [NASA ADS] [CrossRef] [Google Scholar]
- Oesch, P. A., Bouwens, R. J., Illingworth, G. D., et al. 2013, ApJ, 773, 75 [NASA ADS] [CrossRef] [Google Scholar]
- Oesch, P. A., Bouwens, R. J., Illingworth, G. D., et al. 2014, ApJ, 786, 108 [Google Scholar]
- Oesch, P. A., Bouwens, R. J., Illingworth, G. D., Labbè, I., & Stefanon, M. 2018, ApJ, 855, 105 [NASA ADS] [CrossRef] [Google Scholar]
- Oke, J. B. 1974, ApJS, 27, 21 [Google Scholar]
- Ono, Y., Ouchi, M., Harikane, Y., et al. 2018, PASJ, 70, S10 [Google Scholar]
- Osterbrock, D. E., & Ferland, G. J. 2006, Astrophysics of Gaseous Nebulae and Active Galactic Nuclei (Sausalito, CA: University Science Books) [Google Scholar]
- Peng, Y.-J., Lilly, S. J., Kovač, K., et al. 2010, ApJ, 721, 193 [Google Scholar]
- Planck Collaboration VI. 2020, A&A, 641, A6 [NASA ADS] [CrossRef] [EDP Sciences] [Google Scholar]
- Prevot, M. L., Lequeux, J., Maurice, E., Prevot, L., & Rocca-Volmerange, B. 1984, A&A, 132, 389 [Google Scholar]
- Reddy, N. A., Erb, D. K., Pettini, M., Steidel, C. C., & Shapley, A. E. 2010, ApJ, 712, 1070 [NASA ADS] [CrossRef] [Google Scholar]
- Roberts-Borsani, G. W., Bouwens, R. J., Oesch, P. A., et al. 2016, ApJ, 823, 143 [NASA ADS] [CrossRef] [Google Scholar]
- Robertson, B. E., Ellis, R. S., Furlanetto, S. R., & Dunlop, J. S. 2015, ApJ, 802, L19 [Google Scholar]
- Ryan, R. E., Jr, & Reid, I. N. 2016, AJ, 151, 92 [NASA ADS] [CrossRef] [Google Scholar]
- Saito, S., de la Torre, S., Ilbert, O., et al. 2020, MNRAS, 494, 199 [NASA ADS] [CrossRef] [Google Scholar]
- Sanders, D. B., Salvato, M., Aussel, H., et al. 2007, ApJS, 172, 86 [Google Scholar]
- Saumon, D., & Marley, M. S. 2008, ApJ, 689, 1327 [Google Scholar]
- Sawicki, M., Arnouts, S., Huang, J., et al. 2019, MNRAS, 489, 5202 [NASA ADS] [Google Scholar]
- Schaerer, D., & de Barros, S. 2009, A&A, 502, 423 [NASA ADS] [CrossRef] [EDP Sciences] [Google Scholar]
- Schechter, P. 1976, ApJ, 203, 297 [Google Scholar]
- Schmidt, M. 1968, ApJ, 151, 393 [Google Scholar]
- Schmidt, K. B., Treu, T., Trenti, M., et al. 2014, ApJ, 786, 57 [NASA ADS] [CrossRef] [Google Scholar]
- Scoville, N., Aussel, H., Brusa, M., et al. 2007, ApJS, 172, 1 [Google Scholar]
- Simpson, J. M., Smail, I., Swinbank, A. M., et al. 2019, ApJ, 880, 43 [NASA ADS] [CrossRef] [Google Scholar]
- Somerville, R. S., Hopkins, P. F., Cox, T. J., Robertson, B. E., & Hernquist, L. 2008, MNRAS, 391, 481 [NASA ADS] [CrossRef] [Google Scholar]
- Stefanon, M., Labbé, I., Bouwens, R. J., et al. 2017, ApJ, 851, 43 [NASA ADS] [CrossRef] [Google Scholar]
- Stefanon, M., Labbé, I., Caputi, K., et al. 2018, COMPLETE2: Completing the Legacy of Spitzer/IRAC over COSMOS, Spitzer Proposal ID #14045 [Google Scholar]
- Stefanon, M., Labbé, I., Bouwens, R. J., et al. 2019, ApJ, 883, 99 [NASA ADS] [CrossRef] [Google Scholar]
- Stefanon, M., Bouwens, R. J., Labbé, I., et al. 2021, ApJ, 922, 29 [NASA ADS] [CrossRef] [Google Scholar]
- Steidel, C. C., Giavalisco, M., Pettini, M., Dickinson, M., & Adelberger, K. L. 1996, ApJ, 462, L17 [Google Scholar]
- Steinhardt, C. L., Speagle, J. S., Capak, P., et al. 2014, ApJ, 791, L25 [Google Scholar]
- Tacchella, S., Trenti, M., & Carollo, C. M. 2013, ApJ, 768, L37 [NASA ADS] [CrossRef] [Google Scholar]
- Taniguchi, Y., Scoville, N., Murayama, T., et al. 2007, ApJS, 172, 9 [Google Scholar]
- Taniguchi, Y., Kajisawa, M., Kobayashi, M. A. R., et al. 2015, PASJ, 67, 104 [NASA ADS] [Google Scholar]
- Trenti, M., & Stiavelli, M. 2008, ApJ, 676, 767 [Google Scholar]
- Valentino, F., Brammer, G., Fujimoto, S., et al. 2022, ApJ, 929, L9 [NASA ADS] [CrossRef] [Google Scholar]
- Vanzella, E., Nonino, M., Cupani, G., et al. 2018, MNRAS, 476, L15 [Google Scholar]
- Wang, F., Yang, J., Fan, X., et al. 2019, ApJ, 884, 30 [Google Scholar]
- Weaver, J. R., Brammer, G., Casey, C. M., et al. 2021, JWST Proposal Cycle, 1, 2659 [NASA ADS] [Google Scholar]
- Weaver, J. R., Kauffmann, O. B., Ilbert, O., et al. 2022, ApJS, 258, 11 [NASA ADS] [CrossRef] [Google Scholar]
- Wilkins, S. M., Stanway, E. R., & Bremer, M. N. 2014, MNRAS, 439, 1038 [NASA ADS] [CrossRef] [Google Scholar]
- Zamojski, M. A., Schiminovich, D., Rich, R. M., et al. 2007, ApJS, 172, 468 [NASA ADS] [CrossRef] [Google Scholar]
Appendix A: Artefacts
The cross-talk effect is an electronic artefact in which bright sources reappear at different locations in the detector focal plane (e.g. Bowler et al. 2017). Such artefacts are particularly problematic for high-redshift galaxy searches as they appear in the near-infrared channels only. We identified several high-redshift candidates which are most probably these inter-channel cross-talk artefacts in the UltraVISTA images. They are caused by bright sources located at the same RA with a Dec differing by  with integers k = 1, ..., 15 in the VIRCAM images. Here, 128 is the number of detector pixels in each of the 16 readout channels of the detector, and
  is approximately the size of the original pixels. These sources are typically 11.9 − 13.8 mag brighter than the artefacts, and were identified comparing single pawprint stacked images with similar total exposure times, in the UltraVISTA bands. Moreover, we find no evidence of an optical counterpart with HSC for these sources, or in the mid-infrared with IRAC. The coordinates of these candidates are reported in Table A.1. Figure A.1 shows the UltraVISTA stamps at the corresponding coordinates.
Coordinates of the high-redshift galaxy candidates identified as cross-talk artefacts
Appendix B: Detailed description of each candidate
From Fig. B.1 to B.6, we show the observed photometry of each candidate, together with the best-fitted galaxy and stellar templates, for both the CLASSIC and The Farmer catalogues. In the case where the flux is smaller than the flux uncertainty, for clarity the photometric measurement is replaced by a 3σ upper limit. The CLASSIC photometry and posterior redshift distributions are also shown. Figures B.2, B.3, B.5, B.7 and B.8 display stamp images centred on the candidate coordinates.
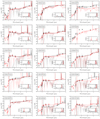 |
Fig. B.1. Observed photometry and best fitting templates for the new z ≥ 7.5 candidates in the COSMOS field. The markers and lines are based on the CLASSIC (black) The Farmer (red) photometry. The photometry is replaced by the 3σ upper limit for non-detection at 1σ. The bright lines show the best-fitting galaxy templates. The faint lines show the best-fitting stellar templates. The insets give the redshift probability distributions. For ID720309, The Farmer photometry is measured on the paw 2 stack, free from the potential cross-talk contamination. We show only the fit corresponding to this case (see Sect. 3.4). |
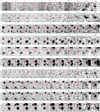 |
Fig. B.2. Stamp images of the z ≥ 7.5 new candidates in the COSMOS field. Each candidate appears in one row of stamps. The stamps are 8″ wide, with north to the top and east to the left. The stamps are saturated beyond the range [ − 1, 4]σ, where σ is the 3σ clipped standard deviation of the pixel values in the stamp. |
 |
Fig. B.3. continued. |
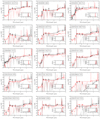 |
Fig. B.6. Same as Fig. B.1 for the z ≥ 7.5 candidates from S19 and B20 which are recovered in the COSMOS2020 catalogue. The identifiers from those papers are indicated in parentheses. |
 |
Fig. B.7. Same as Fig. B.2 for the z ≥ 7.5 candidates from S19 and B20 which are recovered in the COSMOS2020 catalogue. |
 |
Fig. B.8. continued. |
We note that there may be some offsets between the total apparent magnitudes between the CLASSIC and The Farmer photometric COSMOS2020 catalogues, even though the observed colours match each others. One of the main reasons for this is that IRACLEAN and The Farmer provide total fluxes, whereas fixed aperture fluxes are used in the CLASSIC catalogue. Hence, these aperture fluxes are rescaled using aperture-to-total corrections applied to all the aperture-extracted bands, and computed from the weighted mean difference between fixed aperture and pseudo-total fluxes (using Kron apertures) from SExtractor. While the corrections remain low (-0.29, -0.11, -0.01 mag for the 25%, 50%, 75% percentiles), this procedure introduces some additional noise for faint sources.
In IRAC, the flux is already total in both catalogues. Still, we find inconsistencies between the IRACLEAN and The Farmer photometry (e.g. for ID720309 and ID1103149), partially explained by the two different approaches in the algorithms. The Farmer assumes a parametric light-profile for a galaxy, convolved with the IRAC PSF before the fit. IRACLEAN repeatedly removes point-like source contributions from the residual map, until reaching a threshold with no pixel having a flux above a given signal-to-noise within the detection area, defined by the segmentation map. We identify that the presence of close-by objects induces large differences between the two sets of IRAC photometry. The different deblending procedures in The Farmer and CLASSIC introduce small differences in the segmentation map, resulting in this case in large variations of the IRAC flux. We are not able to conclude the superiority of one catalogue over the other, highlighting the importance of using several methods to assess the robustness of the results.
B.1. New galaxy candidates
We identify 17 new candidates at z ≥ 7.5 from the selection in both COSMOS2020 catalogues. We describe them below.
We find two candidates with zphot > 9.5 according to LePhare/The Farmer results. The candidate ID441697 is robustly detected in the J band, its photometric redshift with The Farmer is  . In this case, the CLASSIC photometric redshift
  suggests a lower redshift, nonetheless all the zPDF weight is at z > 8 in both catalogues. The other candidate ID720309 is detected in H and Ks bands, and has zphot ∼ 10.1 for The Farmer photometry and zphot ∼ 9.7 in the CLASSIC catalogue but see Sect. 3.4.
Four sources (ID241443, ID984164, ID1412106) have a primary solution at z < 5 when applying EAZY to the CLASSIC catalogue or allowing for more attenuation in the fit (BC03 configuration). We note that these sources are located outside the ultra-deep HSC region which could explain a looser constraint on the zPDF and multiple peaks in redshifts (in particular for the CLASSIC catalogue).
One new candidate, ID234500, is located in the deep stripe at the south-eastern edge of the field (at high RA). The south-eastern field edge has been covered by NIR data for UltraVISTA DR4 for the first time in COSMOS2020. This region had been previously masked because of the non-uniform quantum efficiency of the VISTA NIR detectors; this region has a higher noise, particularly in the Y-band. Moreover, new HSC DR2 data in this area allows us to select this candidate in a region which has already been studied by S19 and B20.
The observed photometry and images of best-fitted galaxy templates of two blended candidates ID442053 and ID1313521 are shown in Fig. B.4 and Fig. B.5, respectively. These candidates have magnitudes 25.0 < H < 25.5. For these objects we find a photo-z solution at low redshift z < 3 with the CLASSIC catalogue. From aperture photometry alone, all of these candidates have a 3σ detection in at least one HSC optical band. The CLASSIC redshift probability distributions peak at z ∼ 2 for all of them, although one shows a secondary z > 7 solution. In contrast, the majority of the zPDF weights are located at z > 7 with The Farmer catalogue.
B.2. Previously published galaxy candidates
The photometry of the 15 recovered, previously identified candidates are shown in Fig. B.6, and the corresponding stamp images are in Fig. B.7 and B.8.
Among the 25 previously identified candidates we find 15 of them to be at high redshift. This represents 12 of the 16 candidates selected by B20 in COSMOS, and 10 of the 16 candidates from S19 (including 3 selected in S19 but not in B20). The identifiers from S19 and B20 are given in Table 3.
For 9 of them, all photometric redshift estimates indicate a robust z > 7 sources, and 13 of them belong to our gold sample. The candidates 356 (ID485056) and 1032 (ID1346929) present a significant fraction of the Δχ2 distribution falling in the star classification (Sect. 3.3).
The candidates 301 (ID428351) and Y11 (ID859061) are blended with nearby sources and present significant optical fluxes. This was the reason for the candidate Y11 to be rejected from the B20 selection. With the CLASSIC catalogue, the photometric redshifts are z ∼ 2 for both sources. In contrast, these candidates are undetected in the optical with The Farmer catalogue, leading to z ∼ 8. Similarly to the new blended candidates, only the photometry with The Farmer is considered for these sources. For the candidate 301, we note that the smaller 1.8″ diameter apertures used in B20 may have limited the impact of the nearby source on the optical photometry. For the candidate Y11, the H and Ks-band flux is clearly concentrated in one location, while the g-band emission comes from a distinct nearby source, which also contributes to the J-band aperture flux. In this case, a smaller aperture may also limit the contamination.
The estimated redshifts and absolute UV magnitudes are in excellent agreement with those from S19 and B20. We find that the absolute magnitudes from The Farmer are systematically fainter for blended candidates, which is expected since the profile-fitting photometry separates the fluxes from nearby sources. In contrast, we find brighter magnitudes with The Farmer for the two candidates 356 (ID485056) and 879 (ID1103149), which have no obvious neighbours. Nevertheless, resolved internal structures may be observed in the postage stamp images, and the CLASSIC magnitudes are (in fact) in better agreement with B20. This situation may be due to the simple symmetric profile used to estimate the photometry in The Farmer, or to the background subtraction.
Candidate ID978062 is particularly bright, with a H-band magnitude of 24.5. Its relatively broad zPDF, with a full-width at half maximum (FWHM) larger than 1, results from the Lyman break located between the Y and the J band. The resulting photometric redshift is higher (z = 8.86 instead of 8.19) than in B20, and the absolute magnitude brighter (MUV = −22.56 instead of −22.36). This source has a spectroscopic redshift at 7.675 from the REBELS ALMA survey Bouwens et al. (2022).
The candidate Y8 (ID1209618) has problematic IRACLEAN photometry with an extremely low [3.6] flux, which is not the case in The Farmer catalogue. In addition, the IRACLEAN photometric uncertainties in both [3.6] and [4.5] are much smaller than in the near-infrared bands for the CLASSIC catalogue, so that the main constraint on the SED is an unexpectedly red IRAC colour. All but one best-fit galaxy templates produce a redshift at z > 8, except LePhare with the CLASSIC catalogue.
B.3. Rejected candidates from the literature
We now describe the 10 candidates from S19 and B20 which were not selected in this work. For four of these candidates (Y6, Y13, 919, 1212), the estimated zPDF is double-peaked with strong low-redshift solutions. In addition, candidates Y6 and Y13 are detected at more than 2σ in the deep HSC y and z bands, respectively, and were already rejected in the B20 galaxy sample. None of these sources were listed as robust by S19 based on their zPDF, so it is perhaps less of a surprise that we do not confirm them. For these reasons, these candidates are not included. Candidate 1212 is the brightest high-redshift galaxy identified in the COSMOS field in B20, with a photometric redshift of z = 9.1 and an absolute UV magnitude of MUV = −23. For this candidate, both the CLASSIC and The Farmer catalogues have a 3σ detection in the r band, although this is not clear from the associated postage stamp. As a consequence, it is not kept, even though it remains an interesting candidate.
Our combined detection image fails to recover six candidates (Y7, Y9, Y14, Y15, 634, 1043) from S19 and B20. The candidate Y7 is clearly visible in the izYJHK detection image. While it is listed as robust by S19 based on the zPDF, it is not identified as a distinct object because of two large, bright nearby sources (B20 arrived at the same conclusion), with a source at J = 20.7. We matched these six sources with the official release catalogues from UltraVISTA DR4 (McCracken et al. 2012). The detection is performed in each VIRCAM band. These sources do not have any counterpart in the Ks catalogue. The source Y7 discussed previously is detected only in the H-band selected catalogue. The source Y14 from S19 is detected in the J-band selected catalogue with a magnitude of J = 26.3 ± 0.1 mag, but not in the other bands.
All Tables
Photometric redshifts estimated with LePhare and EAZY as in Weaver et al. (2022), and with LePhare using BC03 templates, for the z ≥ 7.5 candidates.
Coordinates of the high-redshift galaxy candidates identified as cross-talk artefacts
All Figures
|
Fig. 1. Imaging data in COSMOS. The background image shows the UltraVISTA H-band weight map, where the vertical dark grey stripes represent the UltraVISTA ultra-deep stripes. The red dashed line indicates the Spitzer/IRAC [3.6] coverage of the SPLASH survey, the blue dashed line represents the ultra-deep region of the HSC images, and the green dot-dashed line corresponds to CANDELS. The filled circles indicate our gold sample (see Sect. 4.1). Open symbols indicate sources for which we cannot exclude a low redshift or star solution based on template fitting, or because of a low S/N detection in one HSC band. |
| In the text | |
|
Fig. 2. Images of the source ID 720309 in the Y, J, H, Ks UltraVISTA broad bands (from left to right), in the full stack (top) and in the stack including only the images not contaminated by the potential cross-talk artefact (bottom). The circles represent the 2″ diameter aperture used in the CLASSIC photometry. |
| In the text | |
|
Fig. 3. Galaxy UV luminosity functions at z = 8. The red symbols show number densities from the galaxy sample presented in this work (uncorrected for incompleteness). The upper limits are at 1σ. The orange diamonds correspond to the measurement only based on the gold sample. The data points from B20; S19; Bouwens et al. (2021, 2015b), Finkelstein et al. (2015), McLure et al. (2013) are represented. The best-fitting double power-law function from B20 and the Schechter function from Bouwens et al. (2021) are displayed. |
| In the text | |
|
Fig. 4. Galaxy UV luminosity functions at z = 9 as in Fig. 3. Data points from B20; S19; Bouwens et al. (2021, 2019), Morishita et al. (2018), Oesch et al. (2013) are shown. The best-fitting double power-law function from B20 and the Schechter function from McLeod et al. (2016) are displayed. |
| In the text | |
|
Fig. 5. Galaxy UV luminosity functions at z = 10, as in Fig. 3. Data points from B20; Bouwens et al. (2019), Morishita et al. (2018), Oesch et al. (2018) are shown. The best-fitting double power-law function from B20 and the Schechter function from Oesch et al. (2018) are displayed. |
| In the text | |
|
Fig. 6. Galaxy UV luminosity functions from z = 8 to z = 10. Our results are shown with blue, green, and red squares for z = 8, 9, 10, respectively. The dotted and solid lines are results from the literature using the same colours, for double power-law functions and Schechter functions, respectively. |
| In the text | |
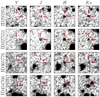 |
Fig. A.1. Same as Fig. B.2, but for the cross-talk artefacts. |
| In the text | |
|
Fig. B.1. Observed photometry and best fitting templates for the new z ≥ 7.5 candidates in the COSMOS field. The markers and lines are based on the CLASSIC (black) The Farmer (red) photometry. The photometry is replaced by the 3σ upper limit for non-detection at 1σ. The bright lines show the best-fitting galaxy templates. The faint lines show the best-fitting stellar templates. The insets give the redshift probability distributions. For ID720309, The Farmer photometry is measured on the paw 2 stack, free from the potential cross-talk contamination. We show only the fit corresponding to this case (see Sect. 3.4). |
| In the text | |
|
Fig. B.2. Stamp images of the z ≥ 7.5 new candidates in the COSMOS field. Each candidate appears in one row of stamps. The stamps are 8″ wide, with north to the top and east to the left. The stamps are saturated beyond the range [ − 1, 4]σ, where σ is the 3σ clipped standard deviation of the pixel values in the stamp. |
| In the text | |
|
Fig. B.3. continued. |
| In the text | |
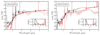 |
Fig. B.4. Same as Fig. B.1, but for the new blended z ≥ 7.5 galaxy candidates. |
| In the text | |
 |
Fig. B.5. Same as Fig. B.2, but for the new blended z ≥ 7.5 galaxy candidates. |
| In the text | |
|
Fig. B.6. Same as Fig. B.1 for the z ≥ 7.5 candidates from S19 and B20 which are recovered in the COSMOS2020 catalogue. The identifiers from those papers are indicated in parentheses. |
| In the text | |
|
Fig. B.7. Same as Fig. B.2 for the z ≥ 7.5 candidates from S19 and B20 which are recovered in the COSMOS2020 catalogue. |
| In the text | |
|
Fig. B.8. continued. |
| In the text | |
Current usage metrics show cumulative count of Article Views (full-text article views including HTML views, PDF and ePub downloads, according to the available data) and Abstracts Views on Vision4Press platform.
Data correspond to usage on the plateform after 2015. The current usage metrics is available 48-96 hours after online publication and is updated daily on week days.
Initial download of the metrics may take a while.