Fig. 1.
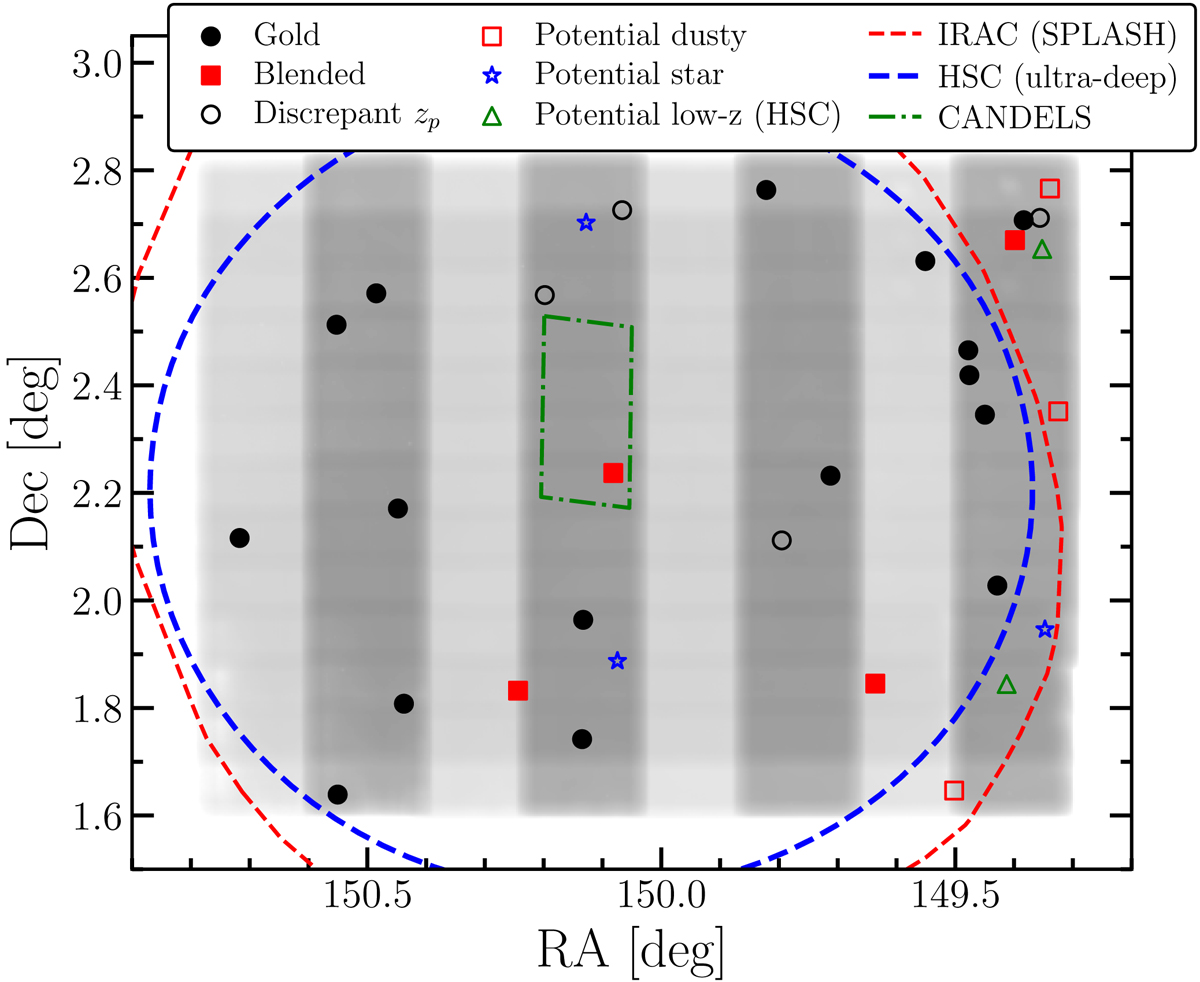
Download original image
Imaging data in COSMOS. The background image shows the UltraVISTA H-band weight map, where the vertical dark grey stripes represent the UltraVISTA ultra-deep stripes. The red dashed line indicates the Spitzer/IRAC [3.6] coverage of the SPLASH survey, the blue dashed line represents the ultra-deep region of the HSC images, and the green dot-dashed line corresponds to CANDELS. The filled circles indicate our gold sample (see Sect. 4.1). Open symbols indicate sources for which we cannot exclude a low redshift or star solution based on template fitting, or because of a low S/N detection in one HSC band.
Current usage metrics show cumulative count of Article Views (full-text article views including HTML views, PDF and ePub downloads, according to the available data) and Abstracts Views on Vision4Press platform.
Data correspond to usage on the plateform after 2015. The current usage metrics is available 48-96 hours after online publication and is updated daily on week days.
Initial download of the metrics may take a while.