Fig. 7
Download original image
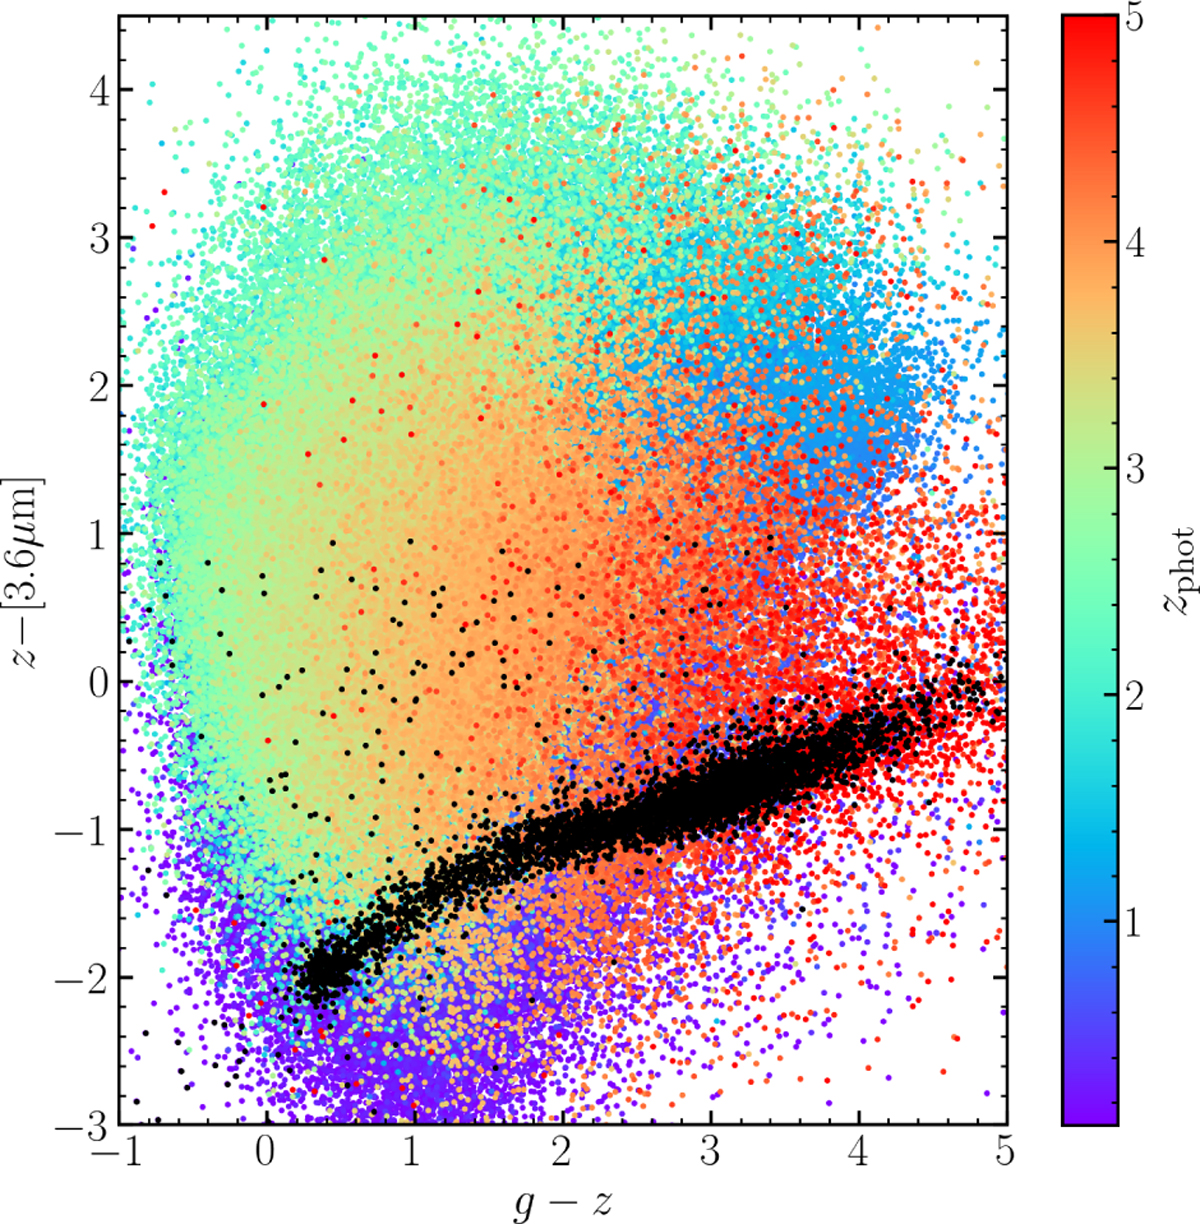
Colour-colour diagram for stars and galaxies identified via SED fitting. Only sources with S/N > 3 in the listed bands are included. Galaxies are coloured according to their photo-z measured by LePhare, and sources with zphot > 5 are all shown in red. Stars are shown as black points following a well defined sequence in colour-colour space. A comparison validating the approximate locations of galaxies in colour-colour space as a function of redshift, as well as the size and extent of the stellar sequence, can be made with Fig. 12 of Weaver et al. (2022).
Current usage metrics show cumulative count of Article Views (full-text article views including HTML views, PDF and ePub downloads, according to the available data) and Abstracts Views on Vision4Press platform.
Data correspond to usage on the plateform after 2015. The current usage metrics is available 48-96 hours after online publication and is updated daily on week days.
Initial download of the metrics may take a while.