Fig. 5
Download original image
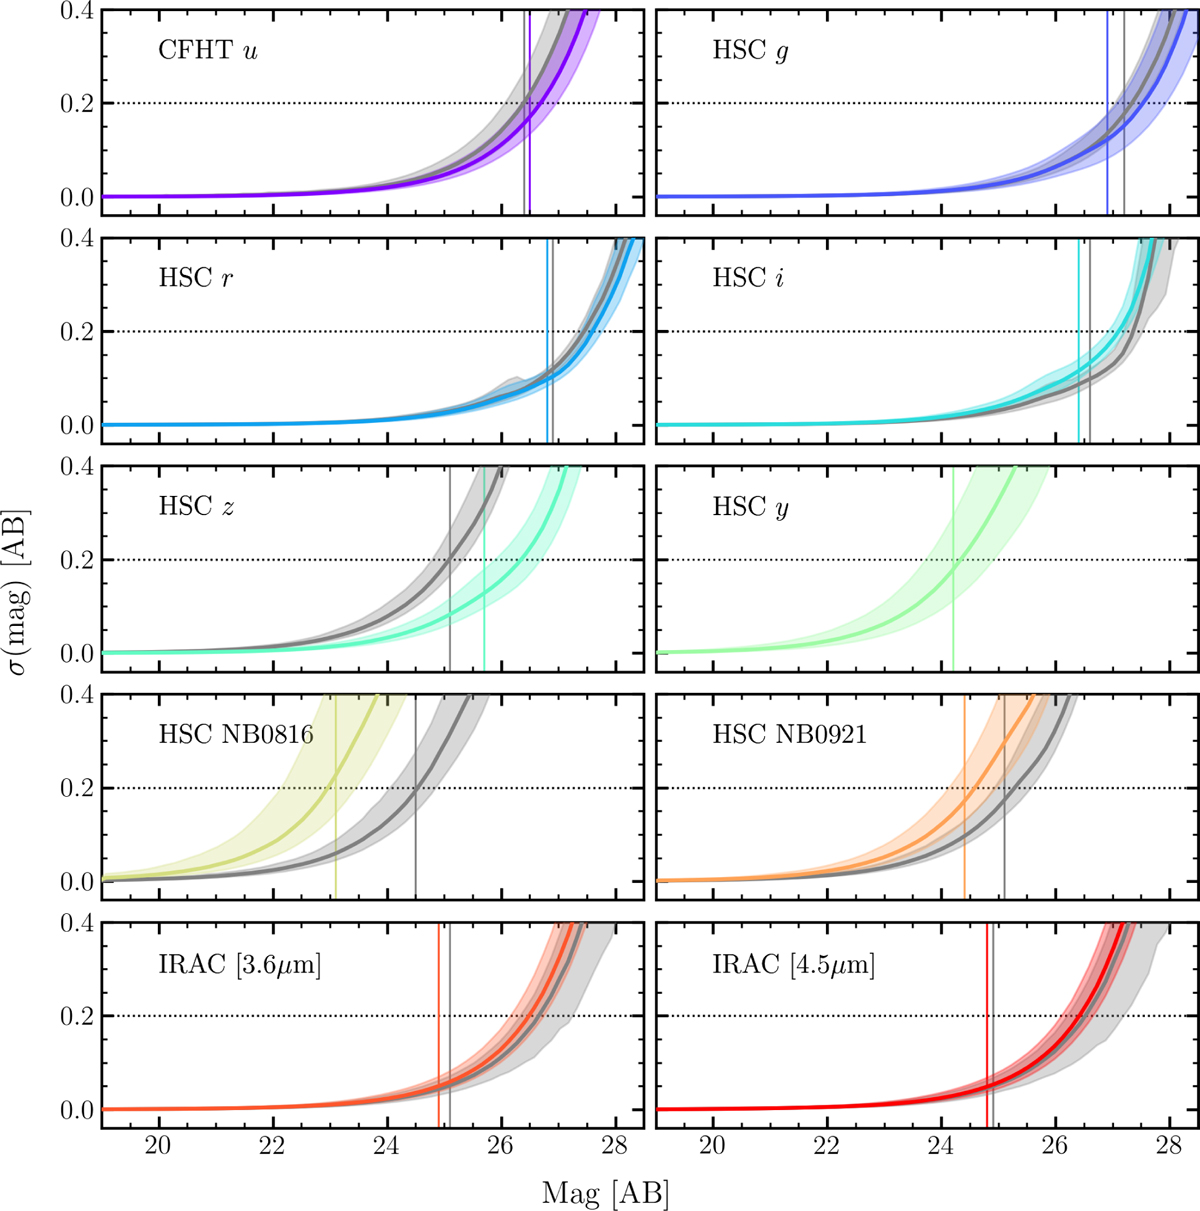
Magnitude versus magnitude error for each unique facility and filter combination, with EDF-N shown in colour and EDF-F shown in grey. Each solid line represents the median magnitude uncertainty as a function of magnitude for a given band. The shaded regions are bounded by the 84th and 16th percentiles of the magnitude error distributions, enclosing 68% of the objects. The 5σ limiting magnitudes measured with 2″ diameter apertures reported in Table 3 are shown by vertical lines. A horizontal dotted line indicates a 5σ model-based photometric uncertainty.
Current usage metrics show cumulative count of Article Views (full-text article views including HTML views, PDF and ePub downloads, according to the available data) and Abstracts Views on Vision4Press platform.
Data correspond to usage on the plateform after 2015. The current usage metrics is available 48-96 hours after online publication and is updated daily on week days.
Initial download of the metrics may take a while.