Fig. 3.
Download original image
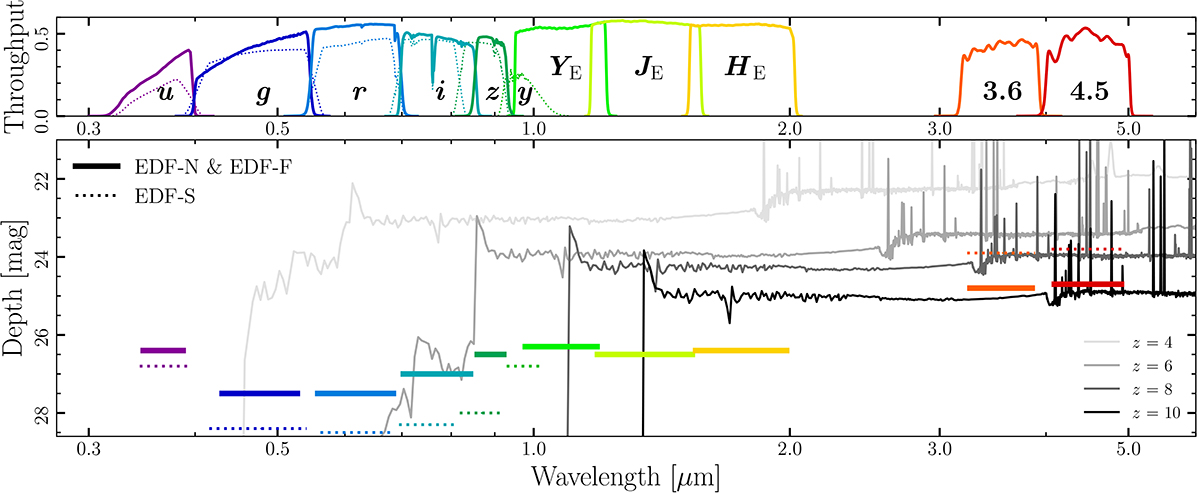
Photometric depths and filters for the EDFs. Top panel: Throughput curves for the photometric bands in the DAWN survey. Bottom panel: photometric sensitivity limits for the EDFs at 5σ with HSC, MegaCam, IRAC, Euclid and Rubin (see Table 2 for details). The solid coloured lines show throughputs and depths for EDF-N and EDF-F data from MegaCam, HSC, and IRAC. The dotted lines show the same for EDF-S coverage from Rubin (expected) and IRAC. Euclid NISP depths are shown with solid lines for all three fields since they are identical. The grey scale lines show FSPS (Conroy et al. 2010; Conroy & Gunn 2010) model spectra for galaxies at a range of redshifts (see legend). The model spectra have been normalised to the characteristic stellar mass of galaxies (M*) at the respective redshift based on Weaver et al. (2023) and Stefanon et al. (2021) which have values of log M⋆ = 10.65, 10.24, 10.0, 9.5 for redshifts z = 4, 6, 8, 10, respectively. All models assume a Chabrier (2003) IMF, a delayed exponential star-formation history with τ = 2 Gyr, Solar metalicity, and Calzetti et al. (2000) dust with AV = 0.2.
Current usage metrics show cumulative count of Article Views (full-text article views including HTML views, PDF and ePub downloads, according to the available data) and Abstracts Views on Vision4Press platform.
Data correspond to usage on the plateform after 2015. The current usage metrics is available 48-96 hours after online publication and is updated daily on week days.
Initial download of the metrics may take a while.