Fig. 10.
Download original image
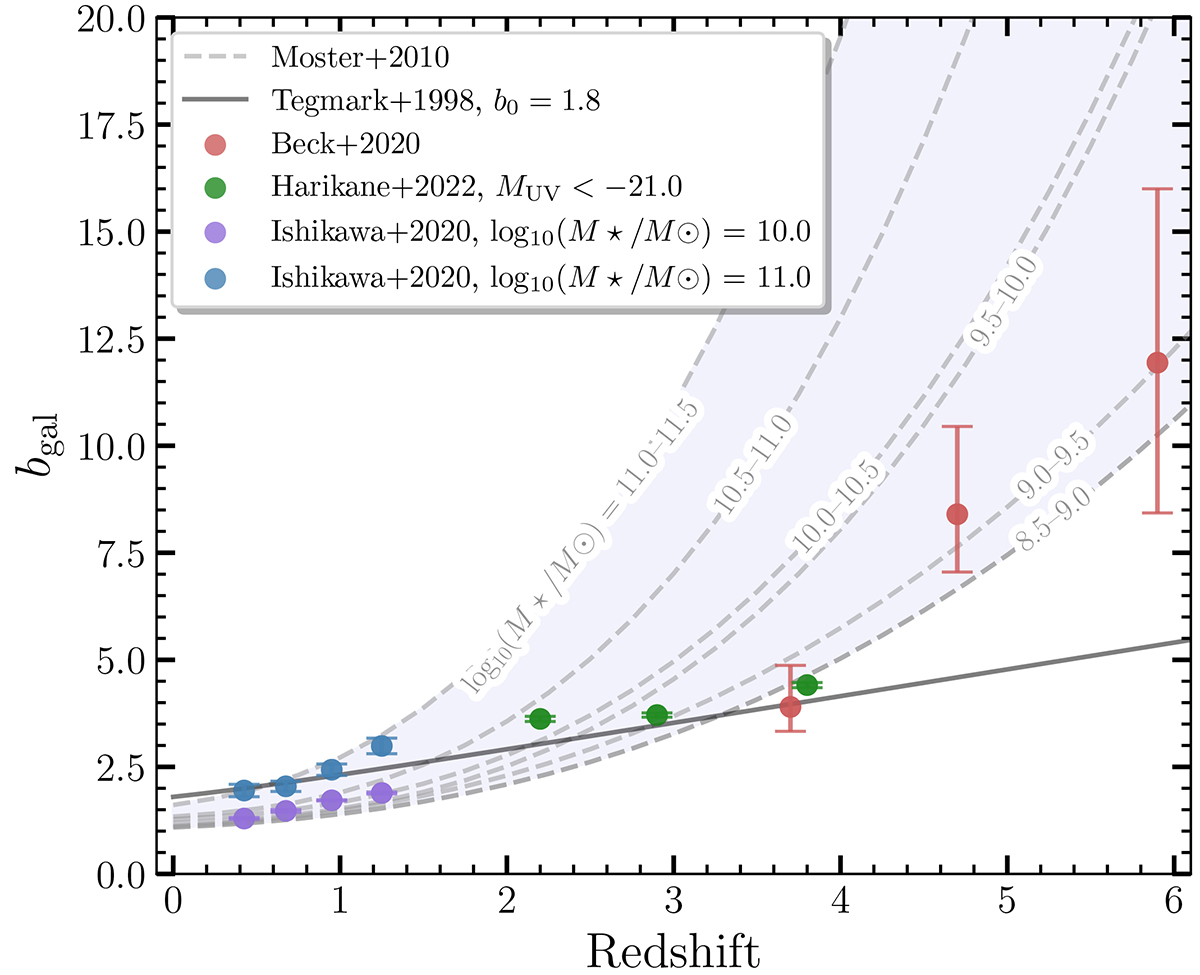
Redshift evolution of linear galaxy bias. The early prediction from Tegmark & Peebles (1998) is shown in solid grey, and more recent models separated by stellar mass from Moster et al. (2010) are shown as dashed grey curves. High-z measurements for dropout-selected samples from Beck et al. (2020) and Harikane et al. (2022) are shown in red and green, respectively. Low-z measurements for two stellar masses from Ishikawa et al. (2020) are shown in blue and purple. The DAWN survey will allow us to constrain bias as a function of redshift and stellar mass in the shaded region.
Current usage metrics show cumulative count of Article Views (full-text article views including HTML views, PDF and ePub downloads, according to the available data) and Abstracts Views on Vision4Press platform.
Data correspond to usage on the plateform after 2015. The current usage metrics is available 48-96 hours after online publication and is updated daily on week days.
Initial download of the metrics may take a while.