| Issue |
A&A
Volume 694, February 2025
|
|
|---|---|---|
| Article Number | A235 | |
| Number of page(s) | 14 | |
| Section | Extragalactic astronomy | |
| DOI | https://doi.org/10.1051/0004-6361/202452596 | |
| Published online | 18 February 2025 | |
CO-CHANGES
II. Spatially resolved IRAM 30 m CO line observations of 23 nearby edge-on spiral galaxies
1
Purple Mountain Observatory, Chinese Academy of Sciences, 10 Yuanhua Road, Nanjing 210023, China
2
School of Astronomy and Space Sciences, University of Science and Technology of China, Hefei 230026, China
3
Key Laboratory of Dark Matter and Space Astronomy, CAS, Nanjing 210023, China
4
Department of Astronomy, University of Michigan, 311 West Hall, 1085 S. University Ave, Ann Arbor, MI 48109-1107, USA
5
Department of Astronomy, University of Massachusetts, Amherst, MA 01003, USA
6
Department of Astronomy, Xiamen University, 422 Siming South Road, Xiamen 361005, China
7
Research Center for Astronomical Computing, Zhejiang Laboratory, Hangzhou 311121, China
⋆ Corresponding author; pandataotao@gmail.com
Received:
13
October
2024
Accepted:
12
December
2024
Context. Molecular gas, which serves as the fuel for star formation, and its relationship with atomic gas are essential for understanding how galaxies regulate their star forming activities.
Aims. We conducted IRAM 30 m observations of 23 nearby spiral galaxies as part of the CHANG-ES project to investigate the distribution of molecular gas and the Kennicutt–Schmidt star formation law in these galaxies. By combining these results with atomic gas masses studied in previous work, we aim to investigate the scaling relations that connect the molecular and atomic gas masses with stellar masses and the baryonic Tully-Fisher relation.
Methods. Based on spatially resolved observations of the 12CO J = 1 − 0, 13CO J = 1 − 0, and 12CO J = 2 − 1 molecular lines, we calculated the total molecular gas masses, obtained the ratios between different CO lines, and derived some key physical parameters, such as the temperature and optical depth of the molecular gas.
Results. For the nuclear and disc regions, the median values of the 12CO/13CO J = 1 − 0 line ratio are 8.6 and 6.1, respectively, while those of the 12CO J = 2 − 1/J = 1 − 0 line ratio are 0.53 and 0.39. The molecular gas mass derived from 13CO J = 1 − 0 is strongly correlated with but systematically lower than that derived from 12CO J = 1 − 0. Most of the galaxies in our sample follow the spatially resolved star forming scaling relation between the star formation rate surface density and molecular gas mass surface density, with a median gas depletion time scale of ∼1 Gyr. A few galaxies exhibit enhanced star formation efficiency, with shorter time scales of ∼0.1 Gyr. Our sample shows a weak correlation between molecular and atomic gas but a strong correlation between the molecular-to-atomic gas mass ratio (MH2/MHI) and stellar mass, consistent with previous studies. Galaxies with lower stellar masses in our sample exhibit an excess of atomic gas by one magnitude compared to molecular gas, suggesting that the transformation of atomic gas into molecular gas is less efficient. Most galaxies tightly follow the baryonic Tully-Fisher relation, but NGC 2992 and NGC 4594 deviate from the relation due to different physical factors. We find that the ratio of the cold gas (comprising molecular and atomic gas) to the total baryon mass decreases with the gravitational potential of the galaxy, as traced by rotation velocity, which could be due to gas consumption in star formation or being heated to the hot phase.
Key words: ISM: molecules / galaxies: ISM / galaxies: spiral / galaxies: star formation
© The Authors 2025
 Open Access article, published by EDP Sciences, under the terms of the Creative Commons Attribution License (https://creativecommons.org/licenses/by/4.0), which permits unrestricted use, distribution, and reproduction in any medium, provided the original work is properly cited.
This article is published in open access under the Subscribe to Open model. Subscribe to A&A to support open access publication.
1. Introduction
Molecular gas clouds serve as the cradles of stars, and their distribution is closely related to the star formation rate (SFR). Kennicutt (1998) and Schmidt (1959) proposed that regions with a higher density of total neutral hydrogen gas (H2 + H I) correlate with a higher SFR. However, studies focusing on the resolved Kennicutt–Schmidt star formation law (SFL) have revealed that the SFR primarily follows a strong relationship with molecular gas surface density, both of which are distributed within a relatively smooth H I distribution (e.g. Leroy et al. 2008; Bigiel et al. 2008).
Molecular and atomic gas content varies across galaxies and is related to stellar mass, morphology, SFR, stellar surface density, and colour (NUV − r or g − r; e.g. Saintonge et al. 2011; Saintonge & Catinella 2022; Tacconi et al. 2020). The gas content is usually expressed in terms of the molecular gas mass to stellar mass ( /Mstar), atomic gas mass to stellar mass (MHI/Mstar), and
  /MHI. Statistical studies based on single-pointing observations of galaxy samples have revealed that the
  /MHI increases gradually with the M⋆ (e.g. Saintonge et al. 2017; Boselli et al. 2014; Bothwell et al. 2014; Cicone et al. 2017). Additionally, the study by Catinella et al. (2018) highlighted that changes in
  /MHI in main-sequence galaxies are primarily driven by variations in the H I reservoir and also confirmed the significance of different galaxy structures on
  /MHI changes. The proportion of these cold baryonic components may vary across different galaxies, and the multi-wavelength data in our sample provide an opportunity for further investigation.
Our project builds on the Continuum Halos in Nearby Galaxies – an EVLA Survey (CHANG-ES) project, which involves systematic VLA observations of 35 nearby edge-on spiral galaxies in order to investigate the relationship between radio coronas, galactic discs, and galactic environments (e.g. Irwin et al. 2012, 2024). In addition to high-resolution multi-band VLA observations, these galaxies also have spatially resolved multi-wavelengths data, which enable detailed studies of SFR and physical conditions in the galaxies. For instance, combining new Hα images with WISE 22 μm data provides more reliable estimates of the SFR for the sample (e.g. Wiegert et al. 2015; Vargas et al. 2019). Subsequent spatially resolved Hα spectral observations are being conducted to explore the distribution of diffuse ionized gas in galaxies (e.g. Lu et al. 2024; Li et al. 2024). High-resolution images of H I are obtained by subtracting the continuum emission from VLA L band observations (e.g. Zheng et al. 2022), which provide the distribution and proportion of atomic gases. Some well-known galaxies in this sample have already been observed and had their molecular gas analysed, such as NGC 660 (e.g. Israel 2009a), NGC 891 (e.g. Yim et al. 2011), and NGC 3079 (e.g. Irwin & Sofue 1992; Israel 2009b). The remaining galaxies either lack observations or only have single-pointing observations of their galactic nuclei. To enhance our understanding of the distribution and properties of molecular gas, its correlation with SFR, its contribution to the baryonic gas budget, and its interactions with the galactic halo, it is essential to conduct spatially resolved observations and analyses of molecular gas across this sample.
We conducted the CO-CHANGES project, which simultaneously covers the 12CO J = 1 − 0, 13CO J = 1 − 0, and 12CO J = 2 − 1 emission lines using the IRAM 30 m telescope. The 12CO J = 1 − 0 line (Tex ∼ 10 K; ncir ∼ 300 cm−3; Evans 1999) is the best tracer of molecular gas. By combining the three emission lines, we can calculate and analyse the distribution of H2 gas related to star formation and its physical properties, such as temperature and optical depth (e.g. Frerking et al. 1982; Wilson et al. 2013), which vary across different star forming environments, including the nucleus and the disc. These observations are made at select positions along the galactic disc of 23 out of the 35 CHANG-ES galaxies, including NGC 4594, which is analysed as a case study in CO-CHANGES Paper I (Jiang et al. 2024). Table 1 lists the CO-CHANGES sample galaxies along with the relevant parameters from previous studies of the CHANG-ES project (e.g. Irwin et al. 2012; Wiegert et al. 2015; Li et al. 2016a; Vargas et al. 2019) that are referenced in this paper. When deriving physical parameters such as the molecular gas temperature and optical depth, we adopted the assumptions and formulas from Paper I, except where deviations are explicitly discussed.
Parameters of the sample galaxies.
In this paper, we introduce the IRAM 30 m observation and data reduction in Sect. 2, and we present the main results in Sect. 3. In Sect. 4, we discuss the correlation analysis of molecular gas, atomic gas, and stellar mass within the sample as well as the SFR and the gas baryon budget. Finally, we summarise the major conclusions in Sect. 5. We note that the 3σ threshold is used to determine whether the spectrum is detected, and the errors drawn in the figure are quoted at the 1σ level throughout the paper.
2. Observations and data reduction
2.1. IRAM 30 m observations
We conducted IRAM 30 m CO line observations of 23 CHANG-ES galaxies in a few observation runs from August 2018 to March 2019 through the project 063-18 and 189-18 (PI: Jiang-Tao Li). Details of the observations are summarised in Table 2. The observations were taken with the Eight MIxer Receiver (EMIR), with the E90/E230 combination (Carter et al. 2012), which simultaneously covers the 12CO J = 1 − 0, J = 2 − 1, and 13CO J = 1 − 0 lines. The superconductor-insulator-superconductor (SIS) receivers were used for observations in position switching (PSW) mode, with a minimum offset of the reference position from the source position of 122″. We used the 24 Fourier transform spectrometer units as backend, covering a total of 32 GHz bandwidth across all channels with a frequency resolution of 200 kHz. The full width at half maximum (FWHM) of the primary beam of IRAM 30 m was ≈21.4″ and ≈10.7″ at 115 GHz and 230 GHz, while the main beam efficiency was set to 78% and 59% at these frequencies, respectively1.
IRAM 30 m observation log.
We observed three to 13 separate positions typically along the disc of each galaxy in order to study the spatial distribution of the gas. Since most galaxies in our sample are axisymmetric, we could position the beams asymmetrically around the galaxy centre, increasing the number of sampling points on one side, which facilitates subsequent kinematic analyses, such as rotation curve fitting. One of these observations in each galaxy is pointed at the galaxy nucleus. We refer to the appendix for the specific distribution of the observation positions. The on-source integration time for most of these positions was 9.8 minutes, while for outer regions of disc, we doubled the on-source integration time to increase the signal-to-noise ratio (S/N). The total integration time for all galaxies amounted to 56 hours.
2.2. Data reduction
We utilised the Continuum and Line Analysis Single-dish software (CLASS) from the GILDAS package (version jul21)2 to reduce and analyse the IRAM 30 m/EMIR data. In CO-CHANGES Paper I, we used an older version (jan17a) for NGC 4594, which did not result in significant differences.
Data taken with the Fourier transform spectrometer backend sometimes showed intermittent ‘platforming’ issues between individual units3. Following the methodology outlined in CO-CHANGES Paper I (see also Lisenfeld et al. 2019), we corrected the ‘platforming’ issues and binned the 12CO J = 1 − 0, J = 2 − 1, and 13CO J = 1 − 0 spectra to a resolution of Δv = 10 km s−1 for all galaxies. Different from Paper I, we primarily fitted spectra using a polynomial function of up to the second degree. To combine the spectra from different polarisation components and multiple on-source integration times, we used sigma-weighted averaging.
Approximately 22% of the 12CO J = 2 − 1 spectra were affected by standing waves, mainly from horizontal polarisation. For spectra with S/N > 7σ, we retained the data without correction. For spectra with 3σ< S/N < 7σ, we subtracted a sinusoidal function based on conditions from other polarisation or observations. This correction, applied to only 1% of the data, was made when it did not significantly affect the signal and indeed improved the rms. We excluded spectra with S/N < 3σ affected by standing waves, accounting for 11% of the total 12CO J = 2 − 1 spectra. The rms thresholds varied for each galaxy, with an average of 30 mK. This exclusion typically reduced the rms from approximately 40 mK to 10 mK.
For 12CO J = 1 − 0 and 13CO J = 1 − 0 spectra, all data were retained except for NGC 3735, in which the 13CO J = 1 − 0 spectra at positions ‘1’ to ‘4’ were not covered due to the incorrect frequency settings during observations on August 24, 2018. Unexpected spike features were detected in some spectra, which could affect the analysis of the emission lines. For example, in the 13CO J = 1 − 0 and 12CO J = 2 − 1 spectra of NGC 2613 and NGC 3044, we observed abnormal spikes at fixed rest frequencies that do not shift with redshift, as shown in Fig. 1 within the velocity range indicated by the blue box. In NGC 3044, these spikes were only detected on specific dates. We therefore attributed these signals to radio frequency interference (RFI) and subsequently masked these spikes. However, for NGC 2613 at positions ‘2’, ‘3’, and ‘4’, the spikes were mixed with the galactic 13CO J = 1 − 0 lines and could not be easily masked. Hence, we applied a Gaussian fit (the blue curve in Fig. 1) to the spike at position ‘1’, fixing its line width and intensity, to subtract the spikes from the other three positions (‘2’, ‘3’, and ‘4’). We applied 3σ to these three positions and excluded them from the statistical analysis. The fitting results were presented in Table 3. For the remaining galaxies, we did not correct for RFI, as it did no affect on the lines of interest.
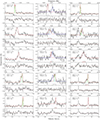 |
Fig. 1. NGC 2613 spectra: 12CO J = 1 − 0 (left), 13CO J = 1 − 0 (middle), and 12CO J = 2 − 1 (right). Each row represents a different location, as shown in Fig. 3. In the upper half of each panel, the y-axis is the main beam temperature after correcting for the main beam forward efficiency. The lower half of each panel shows the residual of the best fit. The lower x-axis for all galaxies shows the same velocity range within ±1000 km s−1. The top x-axis indicates the frequency range for the three different molecular lines of each galaxy, set according to the zero velocity, which is defined by the galaxy’s systematic velocity (Irwin et al. 2012). All spectra are binned to a velocity resolution of 10 km s−1. The green curves represent the best-fit Gaussian lines, and the red line is the baseline. The blue curve represents the fitted RFI, as detailed in Sect. 2.2. The black box indicates the velocity range (ΔW) determined by the 12CO J = 1 − 0 line width, which is used as the fitting range. This range is also displayed on the 13CO J = 1 − 0 and 12CO J = 2 − 1 spectra to show the position of the 12CO emission line. If there is a deviation, the red box highlights the adjusted velocity range used for fitting the other lines. The blue boxes mask some low-significance features that could be artificial and may slightly affect the fitting. These features are masked from the fitting and the calculation of the rms. |
Observed and derived parameters of the CO lines.
In our sample, five galaxies exhibited 12CO J = 1 − 0 emission in their nuclei with a total velocity width exceeding 400 km s−1, including NGC 2683, NGC 2992, NGC 3735, NGC 4845, and NGC 5792. In the nucleus of NGC 2992, the spectra reveal a double-peaked structure with a total emission line width of 587 km s−1 for 12CO J = 1 − 0 and 620 km s−1 for 12CO J = 2 − 1 (see Fig. 2), primarily driven by the rotation of the disc in the nuclear region. There is an extremely active active galactic nucleus (AGN) at the centre of NGC 2992 (Gilli et al. 2000), with multi-wavelength evidence revealing AGN-driven outflows and winds (e.g. Irwin et al. 2017; Zanchettin et al. 2023).
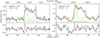 |
Fig. 2. Spectra of 12CO J = 1 − 0 (left panel) and 12CO J = 2 − 1 (right panel) for NGC 2992 presented in the same format as in Fig. 1. |
We fit the CO emission lines with multiple (up to three) Gaussian components to determine the centroid velocities and calculated the integrated intensities of different CO lines for each galaxy by summing the area over the velocity range of ΔW. As 12CO J = 1 − 0 is the strongest line in most cases, its line emission velocity range is marked by the black box in Fig. 1. For the 13COJ = 1 − 0 and 12CO J = 2 − 1 lines, which are not detected, we adopted the same velocity range as 12CO J = 1 − 0. However, when these lines are detected with an S/N greater than 3σ, the velocity window is determined based on their actual line shapes and shown as the red box. Subsequently, we calculated the ratios between different CO emission lines, considering the beam dilution factor to correct for intensity variations caused by differences in the half power beam width at different frequencies, consistent with the method used in Paper I. The beam dilution factors for the 12CO J = 1 − 0/13CO J = 1 − 0 and 12CO J = 1 − 0/12CO J = 2 − 1 ratios typically ranged from 0.87 to 1.08 (median 0.92) and from 0.34 to 0.61 (median 0.42), respectively. An exception was made for the 12CO J = 1 − 0/12CO J = 2 − 1 ratio in NGC 4845 and NGC 5792, where the beam dilution correction factor ranged from 0.37 to 1.15 and 0.32 to 3.15, respectively, due to the exceptionally strong CO emission in both lines from the galactic nucleus.
When we estimated the optical depth (τ13CO) and kinetic temperature (TK) of the molecular gas under local thermodynamic equilibrium (LTE) conditions, we adopted the following assumptions. We assumed that both 12CO J = 1 − 0 and 13CO J = 1 − 0 have the same excitation temperature and filling factor, with τ12CO ≫ 1 and τ13CO ≪ 1. These assumptions were generally valid for galaxies in our sample that do not exhibit extreme conditions, such as intense nuclear starbursts. With the abundance ratio of 12CO/13CO generally ranging from 60 to 90 in molecular clouds (Hollenbach & Thronson 1987), we followed Cormier et al. (2018) by adopting a value of 60. When calculating the kinetic temperature, we assumed an abundance ratio of 12CO/H2 of 8 × 10⁻⁵ (Frerking et al. 1982). Detailed formulas for these calculations are provided in Paper I, and the results are summarised in Table 3. The calculation of uncertainties follows the method described in Paper I, employing 5000 bootstrap samples to determine the distributions of each measurement. All uncertainties were estimated statistically from the measurements.
3. Result
3.1. Radial distribution and total mass of molecular gas
In this subsection, we present the spatial distribution of the 12CO J = 1 − 0, J = 2 − 1, and 13CO J = 1 − 0 lines along the galactic disc and compare the total molecular gas mass ( ) estimated from the 12CO and 13CO J = 1 − 0 lines. The radial CO line and H2 column density profiles for each galaxy are provided in the appendix, with an example of NGC 2613 shown in Fig. 3. For most galaxies, the line intensity decreases with radius.
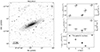 |
Fig. 3. The observational positions and the radial CO line profiles of NGC 2613. Leftpanel: Pan − STARRSg-band image displaying an 11′×11′ area centered on NGC 2613. The solid circles indicate the location of IRAM 30 m beams with a ≈21.4″ diameter for the 12CO J = 1 − 0 spectral band. The dashed circles represent the background location for the PSW observations. The overlay contours are from a convolved 22 μm image from the WISE archive. For most galaxies, contour levels include 3σ, 10σ, and 50σ, with additional levels at 100σ and 150σ for those with more pronounced flux peaks, where 3σ corresponds to a median flux of 0.01 mJy. UGC 10288 is an exception, where the contour levels are 3σ and 10σ. Rightpanel: Integrated intensities of the 12CO J = 1 − 0 (top row), 13CO J = 1 − 0 (middle row), and 12CO J = 2 − 1 (bottom row) lines along the galaxy disc. The lines correspond to the numbered positions in the left panel. The filled diamond indicates the galaxy nucleus. The x-axis represents the projected distance to the minor axis as listed in Table 3. The right y-axes of the top two panels show the molecular gas column density NH2 derived from the corresponding line. |
Both 12CO J = 1 − 0 and 13CO J = 1 − 0 are used to measure the molecular gas column density, with the former usually stronger but optically thick. As for 13CO J = 1 − 0, it is typically regarded as optically thin and a reliable tracer of molecular hydrogen in regions with a higher proportion of dense gas. However, in the normal galactic disc, it is less sensitive to the diffuse phase of molecular gas (Cormier et al. 2018). Cormier et al. (2018) conducted a study on the spatially resolved 13CO(1-0)-to-H2 conversion factor in discs of nearby galaxies, finding that the average value for the entire galaxy sample is  , with an uncertainty of approximately a factor of two due to calibration uncertainties, including variations in CO line ratios, dust properties, and stellar populations.
We employed an X factor of  for 12CO J = 1 − 0 to calculate the molecular gas column density NH2. The X factor generally varies with several parameters of a molecular cloud, such as temperature, optical depth, column density, and metallicity. In general, there is good agreement on the estimated X factors through various independent predictions and observations, such as estimates from the dynamics of molecular clouds (e.g. Solomon et al. 1987), isotopologues (e.g. Goldsmith et al. 2008), extinction (e.g. Frerking et al. 1982), dust emission (e.g. Dame et al. 2001), and gamma-ray emission (e.g. Strong & Mattox 1996). An X factor of approximately
  is yielded by these methods (Shetty et al. 2011). No matter whether these studies focus on larger masses, higher resolution scales, or nearby normal star-forming galaxies, the conclusions are generally consistent with those in the Milky Way, with deviations around 40% in extragalactic environments (e.g. Rosolowsky & Leroy 2006; Bolatto et al. 2013). Previous studies have generally concluded that galaxy centres exhibit lower X factors (e.g. Sandstrom et al. 2013; Bolatto et al. 2013), likely due to higher temperatures, increased velocity dispersion, and elevated metallicity (e.g. Henry & Worthey 1999). Those effects may become even more pronounced in galaxies with AGN activity at their centres (e.g. Papadopoulos & Seaquist 1999; Yao et al. 2003). To maintain consistency with the methodology used for deriving molecular gas masses from 13CO J = 1 − 0, we adopted the same X factor value for both the centres and discs. In our subsequent discussions, we compare molecular gas mass estimates based on both 12CO J = 1 − 0 and 13CO J = 1 − 0.
We measured the CO line flux at a few isolated positions along the disc of each galaxy. In order to estimate the total molecular gas mass of the galaxy, we needed to apply a reasonable scaling factor between our directly measured CO line flux and the same line flux integrated over the whole galaxy. Here, we simply assumed the CO line flux has a constant ratio to the IR flux, which traces the dust-obscured emissions mainly from star forming regions (e.g. Kennicutt 1998; Kennicutt & Evans 2012; Leroy et al. 2008). We adopted the 22 μm flux from the Wide-field Infrared Survey Explorer (WISE) survey, as it is uniformly available for all of our sample galaxies (Vargas et al. 2019) and is little impacted by the extinction effect. (However, see Li et al. 2016a for the potential extinction effect for edge-on galaxies. In the study by Vargas et al. 2018, edge-on galaxies were found to exhibit an average reduction in 25 μm flux by a factor of 1.36 due to extinction when compared to face-on galaxies. This effect has not been accounted for in our analysis.) We reprocessed the WISE 22 μm images by subtracting a local background and convolving them to a resolution of 21″ (the IRAM 30 m main beam size at 12CO J = 1 − 0) using convolution kernels provided by Aniano et al. (2011). We calculated the total 22 μm flux within the contour defined at a level of three times the background standard deviation (3σ), which is often comparable in radial extension to the regions covered by our CO line observations. The scaling factor used to correct for the directly measured CO line flux (fIR; see Table 4) is defined as the ratio between the 22 μm fluxes measured within the IRAM 30 m beams (characterised with isolated circular regions) and the 3σ IR contour of the galaxy. Here we exclude the nuclear region of the galaxy, as it sometimes shows unusually strong IR emissions from the AGN that do not correlate with the CO line emissions. The molecular gas mass measured from the beam covering this nuclear region is directly added to the total mass of the galaxy.
Molecular gas mass of the sample galaxies.
The total molecular gas mass, derived from the corrected molecular gas mass in the disc  plus the original molecular gas mass from the nuclear region
  is summarised in Table 4. For NGC 2683, NGC 4244, and NGC 2820, we defined a single elliptical region to calculate the correction factor fIR, ensuring that only the IR flux from the galaxy itself is included. Specifically, for NGC 2683 and NGC 4244, the 3σ IR contours were fragmented into multiple discrete regions across their discs. For NGC 2820, the elliptical region was used to distinguish the galaxy’s IR flux from that of its companion galaxies. For consistency, we recalculated the total molecular gas mass of NGC 4594 from Paper I using the same method, and we found a negligible difference.
The infrared and radio emissions in an AGN core where the 22 μm flux is heavily influenced by AGN activity differ from those in star formation regions, so the calculation for the nucleus is flawed. Thus, we applied a modified method to galaxies where the nucleus flux exceeds ten times the average flux of the galaxy disc, including NGC 2992, NGC 3448, NGC 4845, and NGC 5792. For NGC 2992, NGC 3448, and NGC 4845, the total masses of molecular gas were obtained by summing the original molecular gas mass from both the disc and nucleus. However, given the compactness of NGC 5792 and the limitations of IR resolution, we used the Hα image from Vargas et al. (2019) to derive the scaling factor. The higher resolution of the Hα image helped us separate the inner ring and other stellar or gaseous structures from the galactic nucleus. Similarly, we then calculated the scaling factor as the ratio of the total Hα flux within the IRAM 30 m beam or within the 22 μm 3σ contour, both of which exclude the flux from the nuclear region. This approach ensures consistency with the method applied to other galaxies in terms of area definition, while the scaling factor itself is based entirely on the Hα flux.
For comparison, we also derived the total molecular gas mass from the 13CO J = 1 − 0 emission using the same method and scaling factor as for 12CO J = 1 − 0. The results are listed in Table 4. We compared the two masses in Fig. 4, and we found that for most of the galaxies, these two masses show a tight linear correlation, but the molecular gas mass derived from 13CO J = 1 − 0 may be systematically smaller, with a median value  /
/ ratio of 0.70 ± +0.08 and a fitted slope of 0.77 ± 0.03 in log space. The discrepancies between the molecular gas mass derived from 12CO J = 1 − 0 emission and those derived from 13CO J = 1 − 0 emission are most likely due to the differences in the X factor dependencies on galaxies or environments, as discussed above in this section, which is not considered in our calculations. For the high-mass end, there may be an overestimation of the X12CO(1 − 0) factor, as evidenced by
  being greater than
  in the galaxy disc, and in the nucleus regions where
  also exceeds
  . Moreover, the slightly higher critical density for excitation of 13CO J = 1 − 0 emission (∼ 600 cm−3; Jiménez-Donaire et al. 2017; Cormier et al. 2018) compared to 12CO J = 1 − 0 makes it weaker or undetectable in a more diffuse regime, particularly across most galactic discs in our sample. Compared with resolved observations from the Atacama Large Millimetre/submillimetre Array (ALMA), such as NGC 2992 (Zanchettin et al. 2023) and NGC 4594 (Sutter & Fadda 2022), the total molecular gas mass derived using the same X factor shows no significant variation. In the subsequent discussions, we only adopt the molecular gas mass derived from the 12CO J = 1 − 0 line.
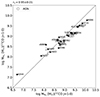 |
Fig. 4. Comparison of the total molecular gas mass derived from the 12CO J = 1 − 0 and 13CO J = 1 − 0 lines for 23 galaxies in our sample. The dashed line represents the 1:1 ratio. Galaxies hosting extremely radio bright AGNs, which may significantly influence the measurements of radio flux density, are marked with a thick black circle, while those with radio bright AGNs, which are less likely to strongly affect the radio flux measurements, are marked with a thin black circle. These AGNs are labelled as ‘ERB’ and ‘RB,’ respectively, in the last column of Table 1 in Li et al. (2016a). |
3.2. CO line ratios and physical conditions of molecular gas
In this section, we present the measured 12CO/13CO J = 1 − 0 and 12CO J = 2 − 1/J = 1 − 0 line ratios (Fig. 5), and we derive some physical parameters based on them. Additionally, we compare the derived line ratios and physical parameters between the nuclear and disc regions.
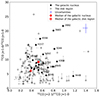 |
Fig. 5. Comparison of the 12CO/13CO J = 1 − 0 and 12CO J = 2 − 1/J = 1 − 0 line ratios for 23 galaxies in our sample. The disc regions and galactic nuclei are represented with open and filled symbols, respectively. The blue lines show the mean error for points without upper or lower limits. The red symbols represent the median value for the sample. |
The 12CO/13CO J = 1 − 0 ratio can be affected by both the optical depth and the isotopic abundance of the molecular cloud. In regions with active star formation, the 12CO emission is enhanced in warm, diffuse clumps due to a significant decrease in the optical depth of the 12CO-rich envelopes, which allows more 12CO photons to escape. In colder molecular clouds, the abundance of 13CO increases primarily through isotope exchange reactions. Additionally, 13C can be produced during the CNO cycle in intermediate-mass stars’ envelopes (Truran 1977). These combined factors in environments with intense star formation can lead to an elevated 12CO/13CO J = 1 − 0 line ratio (e.g. Tan et al. 2011; Jiménez-Donaire et al. 2017; Cormier et al. 2018). In our sample, the 12CO/13CO J = 1 − 0 ratio in the galactic nucleus is slightly higher than that in the galactic disc and also slightly higher than the ratio observed in the Milky Way’s centre (Solomon et al. 1979). This may be due to the influence of a few galaxies with particularly intense star formation activity in their nuclear regions. The median value of the 12CO/13CO J = 1 − 0 ratio for the galactic nucleus is  , with a typical range of 6–23. In contrast, the median value for the galactic disc is 6.1 ± 0.4, with a typical range of 1–19. Both single-pointing (e.g. Aalto et al. 1995; Crocker et al. 2012) and spatially resolved observations of nearby galaxies (e.g. Paglione et al. 2001; Cao et al. 2017, 2023) show a clear variation of the 12CO/13CO J = 1 − 0 ratio either between different galaxies or across individual galaxies. For normal late-type galaxies, the ratio typically varies from 5 to 15 (e.g. Meier & Turner 2004; Vila-Vilaro et al. 2015; Roman-Duval et al. 2016), which is consistent with the measurements of our sample.
The 12CO J = 2 − 1/J = 1 − 0 ratio is primarily determined by the temperature and optical depth. It reflects the structure and heating sources of the molecular clouds. Gas with a low 12CO J = 2 − 1/J = 1 − 0 ratio < 0.7 typically originates from the extended low-density envelopes of molecular clumps, while the high ratio in the range of 0.7–1 is also primarily influenced by optical depth (Hasegawa 1997) and tends to arise from highly concentrated molecular clumps characterised by steep density gradients and thin CO-emitting envelopes (e.g. Peñaloza et al. 2017). For very high 12CO J = 2 − 1/J = 1 − 0 ratios (> 1), the local environment has a significant influence, such as UV photons from young stars, shock waves from supernova explosions (Hasegawa 1997), or effective heating mechanisms in extreme starburst environments (Papadopoulos et al. 2012), including factors such as supersonic turbulence of the molecular clouds, cosmic ray ionisation rates, and the interstellar radiation field (e.g. Peñaloza et al. 2018).
As shown in Fig. 5, the median value of the 12CO J = 2 − 1/J = 1 − 0 line ratio for the galactic nucleus is  , with a typical range of 0.5–1.4. The median value of this ratio in the galactic disc is 0.39 ± 0.01 with a range of 0.2–1.5. These ranges are in general comparable to measurements of other nearby galaxies (e.g. Leroy et al. 2022). Although the galactic nucleus is often expected to have a higher 12CO J = 2 − 1/J = 1 − 0 than the galactic discs (e.g. Leroy et al. 2009; den Brok et al. 2021; Yajima et al. 2021), this difference is not very significant for our sample, except for a few extreme cases. This indicates the low star forming activity of most of our sample galaxies.
Under LTE conditions and some assumptions in Sect. 2.2, the distributions of τ13CO and TK are presented in Fig. 6. The equations used are the same as in Paper I and are given by
![$$ \begin{aligned} \tau \left(\mathrm ^{13}CO\right)=-\ln \left[1-\frac{I_{^{13}\mathrm{CO}~(J=1{-}0)}}{I_{^{12}\mathrm{CO}~(J=1{-}0)}}\right], \end{aligned} $$](/articles/aa/full_html/2025/02/aa52596-24/aa52596-24-eq148.gif)
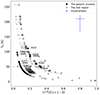 |
Fig. 6. Kinetic temperature (TK) shown as a function of the optical depth of 13CO (τ13CO), both derived from the nuclear and disc regions of the molecular gas under the assumption of LTE. The blue lines indicate the mean error. |
where the I12CO and I13CO are the integrated intensity of emission lines, and
![$$ \begin{aligned} \frac{N_{\rm H_2}}{\mathrm{cm}^{-2}}=2.25\times 10^{20}\left[\frac{\tau _{ ^{13}\mathrm{CO}}}{1-e^{-\tau _{^{13}\mathrm{CO}}}}\right]\frac{I_{^{13}\mathrm{CO}~J=1{-}0}}{1-e^{-5.29/T_{\rm ex}}}, \end{aligned} $$](/articles/aa/full_html/2025/02/aa52596-24/aa52596-24-eq149.gif)
where the excitation temperature (Tex), under LTE, can be approximated as the kinetic temperature (TK). The τ13CO in the nuclear regions of our sample galaxies is typically < 0.25 and has a median value of 0.09 ± 0.01. This value is generally higher than the τ13CO of nuclear starburst galaxies such as M82 (e.g. τ13CO ∼ 0.07; Tan et al. 2011). The median value of the TK in the nuclear region is  K, with a typical range of 3–256. In a few galaxies with nuclear activities (e.g. NGC 2992 and NGC 3448), this value can be as high as ∼100 K. In the nuclear region of these galaxies, the 12CO J = 2 − 1/J = 1 − 0 ratio is often ≳1, further suggesting the possibility of additional heating from the AGN.
4. Discussion
In this section, we compare our measured molecular gas properties and the atomic gas properties collected from archive to other galaxy properties in order to understand the role of cold gas in galaxy evolution. In the follow-up correlation analysis, we use Spearman’s rank order coefficient (rs; by definition −1 < rs < 1) to describe the tightness of the correlation. We consider a tight correlation with |rs| > 0.6, a weak correlation with 0.6 > |rs| > 0.3, and no correlation with |rs| < 0.3 (e.g. Li & Wang 2013a,b). Since there is no firm detection of CO J = 1 − 0 in NGC 5084, this galaxy has been excluded from subsequent analyses and is only shown in Fig. 7.
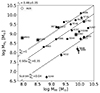 |
Fig. 7.
|


4.1. Molecular to atomic gas mass ratio
4.1.1. Molecular and atomic gas content of the sample galaxies
There are many H I surveys of nearby galaxies reaching different detection limits and angular resolutions. For example, the THINGS survey conducted with the VLA reaches a typical H I column density detection limit of NHI ∼ 1019 cm−2 and an angular resolution of 30″ (e.g. Walter et al. 2008). The HALOGAS survey conducted with the Westerbork Synthesis Radio Telescope (WSRT), typically with ∼17 times the exposure time of THINGS, reaches a detection limit of NHI ∼ 1019 cm−2 and an angular resolution of 20″–30″ (e.g. Heald et al. 2011). The FEASTS survey conducted with the single-dish Five-hundred-meter Aperture Spherical Telescope (FAST), without missing flux, reaches a typical detection limit of NHI ∼ 1017.7 cm−2 and an angular resolution of 3.2′ (e.g. Wang et al. 2023, 2024). We considered that the contribution from the low column density H I is not significant for our analysis, as the primary focus is on higher column densities that dominate the gas content in galaxies.
In this paper, since we only need the total H I gas mass within the galactic disc, we directly collected the atomic gas mass (MHI) of our sample galaxies from different literatures, as summarised in Table 1. The MHI of 14 galaxies was obtained from the CHANG-ES VLA C-configuration H I observations presented in Zheng et al. (2022). For the other galaxies, we typically only obtained the H I flux measured with different telescopes (Table 1) and converted them to MHI using the following relation:
where SHI is the integrated H I line flux and d is the distance to the galaxy (taken from Vargas et al. 2019). The derived MHI is also summarised in Table 1.
The mass fraction of molecular and atomic gas and the transformation between them are crucial in the study of galaxy formation and evolution. Previous works (e.g. Young & Knezek 1989; Saintonge et al. 2011; Catinella et al. 2018; Lisenfeld et al. 2019) suggest a weak correlation between the mass of molecular and atomic gases in nearby galaxies. This weak correlation is also evident in our sample, as shown in Fig. 7 (rs ≈ 0.49). Despite the weak correlation, the scatter of  at a given MHI is up to more than one order of magnitude, indicating a wide range of the molecular to atomic gas mass ratio, regardless of the non-uniformity of MHI measurements in the literature. The
  -MHI relation, or the
  /MHI ratio, could potentially be affected by the AGN activity and the morphological type of the galaxies, as suggested in many previous works (e.g. Young & Knezek 1989; Casoli et al. 1998; Lisenfeld et al. 2011), or by some special cases. For example, there are two significant outliers in Fig. 7. NGC 4845, which has a very active AGN (Irwin et al. 2015), does not show a deficiency in molecular gas mass compared to other galaxies but rather has the lowest atomic gas content in our sample. NGC 4244 is a low surface brightness galaxy and is one of the latest-type galaxies in the CHANG-ES sample; the low molecular gas content may be consistent with its low stellar mass and SFR (both are lowest in the sample; Li et al. 2016a). However, we do not find a significant trend showing such a dependence in Fig. 7. This is possibly because the CHANG-ES sample is selected without extreme AGN activities, and all the galaxies are spiral in a relatively narrow morphological type range.
4.1.2. Gas mass ratio and stellar mass
In this subsection, we further investigate the dependence of the molecular to atomic gas mass ratio ( /MHI) on other galaxy parameters, such as the stellar mass (M⋆). Figure 8 shows that
  /MHI is strongly correlated with M⋆ (rs ≈ 0.63) in our sample, which is consistent with previous studies from extensive samples (e.g. Leroy et al. 2005; Saintonge et al. 2011; Lisenfeld et al. 2011; Bothwell et al. 2014; Catinella et al. 2018). We fit this correlation with
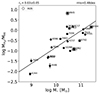 |
Fig. 8. Distribution of |

where M⋆ is derived from the K-band luminosity and the mass-to-light ratio, as presented in Li et al. (2016a). This relation is primarily affected by the efficiency of atomic-to-molecular gas conversion, which depends on two main factors: metallicity and pressure. The increase of M⋆ leads to a higher metallicity and/or dust in the ISM, which shields the molecular gas from dissociation by the radiation field (e.g. Elmegreen 1993; Fu et al. 2010; Krumholz et al. 2009). Under hydrostatic equilibrium, stronger gravitational potential wells lead to higher pressures, compressing gas and increasing the column density of the gas, thereby enhancing the efficiency of atomic-to-molecular gas conversion (e.g. Elmegreen 1989, 1993; Wong & Blitz 2002; Leroy et al. 2008). The gravitational potential in galaxies can be dominated either by stars or by the self-gravity of gas, depending on the specific environment.
Galaxies with lower stellar masses, located in the lower left of Fig. 8, also appear in the lower right of Fig. 7, where their molecular gas masses are an order of magnitude lower than the atomic gas mass. The primary reason is their relatively low stellar masses, which cause a shallow potential well, lower pressure, and lower gas surface density, hindering the conversion of atomic gas into molecular gas, especially in the lowest-mass galaxy NGC 4244. Additionally, galaxies with shallow potential wells may struggle to retain their metallicity (e.g. Tremonti et al. 2004). The increase in the  /MHI ratio for NGC 4845 is mainly due to a deficiency in MHI.
4.2. Star formation law
The cold atomic and molecular gas provide fuel to continue star formation, with the latter directly connected to the current star forming processes. The Kennicutt–Schmidt SFL describes the relationship between the surface density of the cold gas and the surface density of the SFR measured with different tracers (e.g. Kennicutt 1998; Kennicutt & Evans 2012). With spatially resolved measurements of the molecular gas distribution on the galactic disc, our sample is optimised to examine the SFL. We compared our sample to the well-calibrated SFL based on similarly spatially resolved cold gas and SFR observations of nearby galaxies from Bigiel et al. (2008) in Fig. 9. We also adopted the gas depletion time scale to describe how active the star formation is in the galaxy. This time scale is defined as the time required to consume the star forming fuel at the current SFR, or the inverse of the star formation efficiency:  .
.
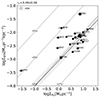 |
Fig. 9.
|

In Fig. 9, the SFL is presented in the form of ΣSFR − ΣH2, where we calculated  based on the total measured molecular gas mass
  and the star formation diameter of the galaxy measured with the 22 μm data (obtained from Wiegert et al. 2015 and listed in Table 1). We directly adopted the disc-average SFR surface density ΣSFR computed based on the spatially resolved 22 μm and Hα data (Vargas et al. 2019). In Fig. 9, we also plot the ΣSFR − ΣH2 relationships corresponding to different gas depletion time scales. Our sample mostly falls on the best-fit relation from Bigiel et al. (2008), which corresponds to a depletion time scale of
  . This is consistent with some moderately star forming galaxies (e.g. Bigiel et al. 2011; Leroy et al. 2013; Lisenfeld et al. 2019) but could be one order of magnitude larger than extreme starburst galaxies, such as luminous infrared galaxies and ultraluminous infrared galaxies, which are known to have higher star formation efficiencies and a shorter gas depletion time scale (e.g. Saintonge et al. 2011).
As presented in Fig. 9, our sample shows a relatively large scatter compared to the usually tight correlation between ΣSFR and ΣH2 (e.g. Kennicutt & Evans 2012). This is mainly because of the relatively small dynamical range of both parameters in our sample, which mainly represent inactive or normal star forming galaxies. Furthermore, there are a few significant outliers from the SFL that enlarge this scatter. For example, NGC 4244 is a dwarf galaxy with a small gas content and weak star formation, and the IR and Hα emissions used to calculate the SFR may be contaminated by the contributions from some old stellar components (e.g. Vargas et al. 2018, 2019). The real uncertainty of the measured ΣSFR and ΣH2 should be larger than those presented in Fig. 9, which include only statistical errors. NGC 2992 has an extremely active AGN and a relatively small angular size. The SFR determined largely from the WISE 22 μm data should be largely overestimated, with contributions from the strong AGN emissions. Xu et al. (2024) analysed the stellar population in NGC 2992 and revealed that AGN outflows have a suppressed star formation in the nuclear region (< 1 kpc) but trigger increased star forming activity outside the nucleus. NGC 3448 also has an IR bright core, which may represent a weak AGN and cause the overestimation of the SFR, although high-resolution radio continuum observations suggest the peak of the radio emission may be off-nucleus (Irwin et al. 2019). NGC 3432 has a warped disc that is possibly impacted by the gravitational tidal force of the dwarf companions UGC 5983 and [KMK2013] LV J1052+3639. The galaxy may be in a stage where the tidal interaction helps trigger star formation on the galactic disc (e.g. Renaud et al. 2014; Pan et al. 2018). NGC 3003 exhibits an unusually large scale heights derived from H I, Hα, and radio data compared to other CHANG-ES galaxies, which may be influenced by the tidal interaction (e.g. Krause et al. 2018; Lu et al. 2023).
4.3. Gas baryon budget
The fraction of baryons of a galaxy stored in different forms varies at different galaxy masses, and the gas in different phases could take a significant fraction of a galaxy’s total baryon budget (e.g. Werk et al. 2014; Li et al. 2017, 2018; Bregman et al. 2018, 2022). The baryonic Tully-Fisher relation is an empirical scaling relation between the baryonic mass Mb and the gravitation of the galaxy characterised with the rotation velocity Vrot (e.g. McGaugh et al. 2000). In Fig. 10, we plot our sample galaxies against the well-defined baryonic Tully-Fisher relation from McGaugh (2005) using the sum of stellar mass and total gas (H2 + H I) masses along with the rotation velocity obtained from the literature (e.g. Li et al. 2016a). In follow-up papers, we will further discuss the rotation curve of our sample galaxies measured based on both our CO data (Li et al. 2019; Jiang et al. 2024) and some multi-wavelength data tracing different gas phases (e.g. Zheng et al. 2022; Li et al. 2024).
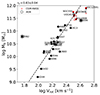 |
Fig. 10. Rotational velocity shown as a function of the baryonic mass of galaxies. The AGN symbol is the same as in Fig. 4. The dashed line is the best fit of baryonic Tully-Fisher relation from McGaugh (2005). The red box symbols represent galaxies from the CGM-MASS sample, with lighter red boxes indicating those that only include stellar mass and darker red boxes adding the hot gas mass of the galaxy, both of which were obtained from Li et al. (2017). The mass variations for each galaxy, considering whether hot gas mass is included or not, are indicated by black arrows. |
As expected, our sample galaxies are distributed tightly around the best-fit baryonic Tully-Fisher relation from McGaugh (2005). The most significant outlier is NGC 2992, where there is a strong AGN with broadened double-peaked emission lines from the nuclear region (see an example from our CO observations in Fig. 2) and a highly warped disc. The measured Vrot could be largely biased and not related to the gravitation of the galaxy. The second largest outlier is NGC 4594, which is an early-type disc galaxy (Jiang et al. 2024) with significantly lower stellar+cold gas mass than expected from the baryonic Tully-Fisher relation. NGC 4594 is also the most massive galaxy in our sample. In order to double check if there is a systematic bias of massive disc galaxies from the baryonic Tully-Fisher relation in the high-mass end, we further compared our sample to the Circum-Galactic Medium of MASsive Spirals (CGM-MASS) sample including the most massive spiral galaxies in the local Universe (Fig. 10; Li et al. 2016b, 2017, 2018). In these massive galaxies, the cold gas is poor, constituting approximately 10% of the stellar mass (Lisenfeld et al. 2023). In Fig. 10, the light red symbols represent galaxies where only the stellar mass is considered; they indeed show a systematic bias to lower baryonic mass from the baryonic Tully-Fisher relation. Even when cold gas mass is included, this bias cannot be fully corrected, indicating either a larger halo mass (e.g. expected from the turn over of the stellar mass-halo mass relation; Behroozi et al. 2010) or a lower fraction of baryonic mass converted to stars. However, these massive galaxies have a higher virial temperature (T > 106 K), so the gravitation potential is deep enough to heat the gas to a temperature above the peak of the radiative cooling curve, converting it to X-ray emitting hot gas (e.g. Li et al. 2018). The CGM-MASS sample has high-quality XMM-Newton observations that could be used to measure the properties of the hot circumgalactic medium. With the mass of this extended hot gas component included, these massive spirals fall closer to the baryonic Tully-Fisher relation (Fig. 10).
As discussed above, the multi-phase gas could account for a significant fraction of the total baryon budget of a galaxy. We further examined the dependence of the cold (molecular plus atomic) gas to the total baryon mass ratio ( ) on the gravitational potential of a galaxy traced by Vrot in Fig. 11. Excluding NGC 2992, whose Vrot may not be a good tracer of the gravitational potential, the other galaxies show a fairly good anti-correction between
  and Vrot. This indicates that more massive spiral galaxies tend to be poorer in cold gas, resulting in their quiescence in star formation (e.g. Salim et al. 2007). However, these galaxies are not necessarily gas poor, as a significant fraction of the gas could be heated to an X-ray emitting temperature, resulting in an overall positive correlation between the hot gas mass fraction and the gravitational potential (e.g. Li et al. 2014, 2017, 2018). The radiative cooling of the hot circumgalactic medium may also partially compensate for the gas consumed in star formation, especially for relatively quiescent and massive galaxies (e.g. Li et al. 2014, 2017). In conclusion, although most of our sample galaxies fall within the well-defined baryonic Tully-Fisher relation, some of the most massive spirals appear depleted in cold gas. The depletion could at least be partially explained by the fact that a significant fraction of the gas in the halo has been heated to an X-ray emitting temperature above the peak of the radiative cooling curve.
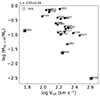 |
Fig. 11. Rotational velocity shown as a function of the total cold gas mass to baryonic mass ratio of galaxies. The AGN symbol is the same as in Fig. 4. |
5. Summary and conclusion
We have presented IRAM 30 m observations of the 12CO J = 1 − 0, 13CO J = 1 − 0, and 12CO J = 2 − 1 lines along the disc of 23 nearby spiral galaxies selected from the CHANG-ES sample. We calculated the ratios between different CO lines and derived the temperature and optical depth of the molecular gas. We further examined the dependence of the gas properties on other galaxy properties. Our main results and conclusions are summarised as follows:
• The 12CO J = 1 − 0, 13CO J = 1 − 0, and 12CO J = 2 − 1 lines are detected in 77%, 40%, and 73% of the observed positions along the galactic discs and in 96%, 78%, and 96% of the nuclear regions of the galaxies.
• Using the WISE 22 μm image, we rescaled the molecular gas mass measured from our CO line observations of individual regions to the total molecular gas mass of each galaxy. For most galaxies, the molecular gas mass derived from 13CO J = 1 − 0 is tightly correlated with the mass derived from 13CO J = 1 − 0, but it is systematically lower than that from 12CO J = 1 − 0, possibly due to the uncertainties of the X factor and the lower detection rate of the weaker 13CO J = 1 − 0 line in the galaxy disc.
• After correcting for the beam dilution, the median values of the 12CO/13CO J = 1 − 0 and 12CO J = 2 − 1/J = 1 − 0 ratios in the nucleus/disc of galaxies are ≈8.6/6.1 and 0.53/0.39, respectively. The median values of the derived kinetic temperature and optical depth under the LTE assumption in the galaxy are ≈41 K and 0.1, respectively. These values are all typical for non-starburst spiral galaxies.
• There is a weak correlation between the total molecular and atomic gas masses of our sample galaxies, but the molecular to atomic gas mass ratio  shows a large scatter of more than one order of magnitude. The
  ratio could be affected by many factors. One of the most important appears to be the stellar mass of the galaxy, which shows a tight, nearly linear relation with
  . This correlation indicates that in galaxies with higher stellar masses, increased metallicity and stronger gravitational potential accelerate the conversion of atomic gas into molecular gas, leading to a higher
  ratio. In our sample, galaxies with lower stellar masses also exhibit reduced
  ratios, with the molecular gas masses in these galaxies being an order of magnitude lower than the atomic gas masses.
• Most of our sample galaxies fall close to the Kennicutt–Schmidt SFL, with a median gas depletion time scale of ∼1 Gyr. Some galaxies show significantly shorter gas depletion time scales of ∼0.1 Gyr and could be affected by various measurement uncertainties as well as some special processes prompting the star formation efficiency.
• Most of our sample galaxies fall within the baryonic Tully-Fisher relation, except for a few of the most massive galaxies, which have a systematically lower baryonic mass at a given rotation velocity. The missing baryonic mass of these massive spirals is largely recovered by the inclusion of the extended hot circumgalactic medium. The cold gas fraction of the total baryon mass decreases with increasing gravitational potential because the gas is either consumed early in star formation or heated to the hot phase.
This study represents the first statistical analysis of molecular gas properties in the CO-CHANGES project, where we examined the SFL of these galaxies and discussed them in conjunction with atomic gas masses derived from earlier studies. Subsequent studies will focus on the radial distribution of molecular gas and its dynamics within galaxies, as well as comparative analyses of their multiphase gas properties. Furthermore, a comprehensive understanding of the baryonic Tully-Fisher relation will require additional observations of massive galaxy samples, particularly to investigate the interplay between the gas components in the circumgalactic medium and the galaxy disc.
Data availability
Tables 2 and 3 are only available in electronic form at the CDS via anonymous ftp to cdsarc.cds.unistra.fr (130.79.128.5) or via https://cdsarc.cds.unistra.fr/viz-bin/cat/J/A+A/694/A235
Figures in the same format as Fig. 3 for all galaxies, as well as the spectra for all positions, can be accessed at https://zenodo.org/records/14504655.
Acknowledgments
The authors would like to commemorate the late Prof. Yu Gao and express their deep gratitude for his invaluable guidance in observations and learning. The authors also acknowledge Dr. Zhi-Yu Zhang and Dr. Jian Fu for helpful discussions. J.T.L. acknowledges the financial support from the National Science Foundation of China (NSFC) through the grants 12273111, and also the science research grants from the China Manned Space Project. Q.H.T. acknowledges the support by the NSFC grant No. 12033004. X.J.J. acknowledges the support by the NSFC grant No. 12373026 and the Leading Innovation and Entrepreneurship Team of Zhejiang Province of China (2023R01008).
References
- Aalto, S., Booth, R. S., Black, J. H., & Johansson, L. E. B. 1995, A&A, 300, 369 [NASA ADS] [Google Scholar]
- Aniano, G., Draine, B. T., Gordon, K. D., & Sandstrom, K. 2011, PASP, 123, 1218 [Google Scholar]
- Behroozi, P. S., Conroy, C., & Wechsler, R. H. 2010, ApJ, 717, 379 [Google Scholar]
- Bigiel, F., Leroy, A., Walter, F., et al. 2008, AJ, 136, 2846 [NASA ADS] [CrossRef] [Google Scholar]
- Bigiel, F., Leroy, A. K., Walter, F., et al. 2011, ApJ, 730, L13 [NASA ADS] [CrossRef] [Google Scholar]
- Bolatto, A. D., Wolfire, M., & Leroy, A. K. 2013, ARA&A, 51, 207 [CrossRef] [Google Scholar]
- Boselli, A., Cortese, L., Boquien, M., et al. 2014, A&A, 564, A66 [NASA ADS] [CrossRef] [EDP Sciences] [Google Scholar]
- Bothwell, M. S., Wagg, J., Cicone, C., et al. 2014, MNRAS, 445, 2599 [NASA ADS] [CrossRef] [Google Scholar]
- Bregman, J. N., Anderson, M. E., Miller, M. J., et al. 2018, ApJ, 862, 3 [NASA ADS] [CrossRef] [Google Scholar]
- Bregman, J. N., Hodges-Kluck, E., Qu, Z., et al. 2022, ApJ, 928, 14 [NASA ADS] [CrossRef] [Google Scholar]
- Cao, Y., Wong, T., Xue, R., et al. 2017, ApJ, 847, 33 [NASA ADS] [CrossRef] [Google Scholar]
- Cao, Y., Wong, T., Bolatto, A. D., et al. 2023, ApJS, 268, 3 [NASA ADS] [CrossRef] [Google Scholar]
- Carter, M., Lazareff, B., Maier, D., et al. 2012, A&A, 538, A89 [NASA ADS] [CrossRef] [EDP Sciences] [Google Scholar]
- Casoli, F., Sauty, S., Gerin, M., et al. 1998, A&A, 331, 451 [NASA ADS] [Google Scholar]
- Catinella, B., Saintonge, A., Janowiecki, S., et al. 2018, MNRAS, 476, 875 [NASA ADS] [CrossRef] [Google Scholar]
- Chaves, T. A., & Irwin, J. A. 2001, ApJ, 557, 646 [NASA ADS] [CrossRef] [Google Scholar]
- Cicone, C., Bothwell, M., Wagg, J., et al. 2017, A&A, 604, A53 [NASA ADS] [CrossRef] [EDP Sciences] [Google Scholar]
- Cormier, D., Bigiel, F., Jiménez-Donaire, M. J., et al. 2018, MNRAS, 475, 3909 [NASA ADS] [CrossRef] [Google Scholar]
- Courtois, H. M., & Tully, R. B. 2015, MNRAS, 447, 1531 [NASA ADS] [CrossRef] [Google Scholar]
- Crocker, A., Krips, M., Bureau, M., et al. 2012, MNRAS, 421, 1298 [NASA ADS] [CrossRef] [Google Scholar]
- Dame, T. M., Hartmann, D., & Thaddeus, P. 2001, ApJ, 547, 792 [Google Scholar]
- Davis, L. E., & Seaquist, E. R. 1983, ApJS, 53, 269 [NASA ADS] [CrossRef] [Google Scholar]
- de Vaucouleurs, G., de Vaucouleurs, A., Corwin, H. G. J., et al. 1991, Third Reference Catalogue of Bright Galaxies (New York: Springer) [Google Scholar]
- den Brok, J. S., Chatzigiannakis, D., Bigiel, F., et al. 2021, MNRAS, 504, 3221 [NASA ADS] [CrossRef] [Google Scholar]
- Elmegreen, B. G. 1989, ApJ, 338, 178 [NASA ADS] [CrossRef] [Google Scholar]
- Elmegreen, B. G. 1993, ApJ, 411, 170 [NASA ADS] [CrossRef] [Google Scholar]
- Evans, N. J., I. 1999, ARA&A, 37, 311 [NASA ADS] [CrossRef] [Google Scholar]
- Frerking, M. A., Langer, W. D., & Wilson, R. W. 1982, ApJ, 262, 590 [Google Scholar]
- Fu, J., Guo, Q., Kauffmann, G., & Krumholz, M. R. 2010, MNRAS, 409, 515 [Google Scholar]
- Gilli, R., Maiolino, R., Marconi, A., et al. 2000, A&A, 355, 485 [NASA ADS] [Google Scholar]
- Goldsmith, P. F., Heyer, M., Narayanan, G., et al. 2008, ApJ, 680, 428 [Google Scholar]
- Hasegawa, T. 1997, IAU Symp., 170, 39 [NASA ADS] [Google Scholar]
- Heald, G., Józsa, G., Serra, P., et al. 2011, A&A, 526, A118 [NASA ADS] [CrossRef] [EDP Sciences] [Google Scholar]
- Henry, R. B. C., & Worthey, G. 1999, PASP, 111, 919 [NASA ADS] [CrossRef] [Google Scholar]
- Hollenbach, D. J., & Thronson, H. A., Jr., eds. 1987, Interstellar Processes, Astrophys. Space Sci. Lib., 134 [CrossRef] [Google Scholar]
- Huchra, J. P., Macri, L. M., Masters, K. L., et al. 2012, ApJS, 199, 26 [Google Scholar]
- Huchtmeier, W. K. 1982, A&A, 110, 121 [NASA ADS] [Google Scholar]
- Irwin, J. A., & Sofue, Y. 1992, ApJ, 396, L75 [NASA ADS] [CrossRef] [Google Scholar]
- Irwin, J., Beck, R., Benjamin, R. A., et al. 2012, AJ, 144, 43 [Google Scholar]
- Irwin, J. A., Henriksen, R. N., Krause, M., et al. 2015, ApJ, 809, 172 [NASA ADS] [CrossRef] [Google Scholar]
- Irwin, J. A., Schmidt, P., Damas-Segovia, A., et al. 2017, MNRAS, 464, 1333 [NASA ADS] [CrossRef] [Google Scholar]
- Irwin, J., Wiegert, T., Merritt, A., et al. 2019, AJ, 158, 21 [NASA ADS] [CrossRef] [Google Scholar]
- Irwin, J., Beck, R., Cook, T., et al. 2024, Galaxies, 12, 22 [NASA ADS] [CrossRef] [Google Scholar]
- Israel, F. P. 2009a, A&A, 506, 689 [NASA ADS] [CrossRef] [EDP Sciences] [Google Scholar]
- Israel, F. P. 2009b, A&A, 493, 525 [NASA ADS] [CrossRef] [EDP Sciences] [Google Scholar]
- Jiang, Y., Li, J.-T., Gao, Y., et al. 2024, MNRAS, 528, 4160 [NASA ADS] [CrossRef] [Google Scholar]
- Jiménez-Donaire, M. J., Cormier, D., Bigiel, F., et al. 2017, ApJ, 836, L29 [Google Scholar]
- Kennicutt, R. C., Jr. 1998, ApJ, 498, 541 [Google Scholar]
- Kennicutt, R. C., & Evans, N. J. 2012, ARA&A, 50, 531 [NASA ADS] [CrossRef] [Google Scholar]
- Krause, M., Irwin, J., Wiegert, T., et al. 2018, A&A, 611, A72 [NASA ADS] [CrossRef] [EDP Sciences] [Google Scholar]
- Krumholz, M. R., McKee, C. F., & Tumlinson, J. 2009, ApJ, 693, 216 [NASA ADS] [CrossRef] [Google Scholar]
- Leroy, A., Bolatto, A. D., Simon, J. D., & Blitz, L. 2005, ApJ, 625, 763 [NASA ADS] [CrossRef] [Google Scholar]
- Leroy, A. K., Walter, F., Brinks, E., et al. 2008, AJ, 136, 2782 [Google Scholar]
- Leroy, A. K., Walter, F., Bigiel, F., et al. 2009, AJ, 137, 4670 [Google Scholar]
- Leroy, A. K., Walter, F., Sandstrom, K., et al. 2013, AJ, 146, 19 [Google Scholar]
- Leroy, A. K., Rosolowsky, E., Usero, A., et al. 2022, ApJ, 927, 149 [NASA ADS] [CrossRef] [Google Scholar]
- Li, J.-T., & Wang, Q. D. 2013a, MNRAS, 428, 2085 [NASA ADS] [CrossRef] [Google Scholar]
- Li, J.-T., & Wang, Q. D. 2013b, MNRAS, 435, 3071 [NASA ADS] [CrossRef] [Google Scholar]
- Li, J.-T., Crain, R. A., & Wang, Q. D. 2014, MNRAS, 440, 859 [CrossRef] [Google Scholar]
- Li, J.-T., Beck, R., Dettmar, R.-J., et al. 2016a, MNRAS, 456, 1723 [NASA ADS] [CrossRef] [Google Scholar]
- Li, J.-T., Bregman, J. N., Wang, Q. D., Crain, R. A., & Anderson, M. E. 2016b, ApJ, 830, 134 [NASA ADS] [CrossRef] [Google Scholar]
- Li, J.-T., Bregman, J. N., Wang, Q. D., et al. 2017, ApJS, 233, 20 [NASA ADS] [CrossRef] [Google Scholar]
- Li, J.-T., Bregman, J. N., Wang, Q. D., Crain, R. A., & Anderson, M. E. 2018, ApJ, 855, L24 [NASA ADS] [CrossRef] [Google Scholar]
- Li, J.-T., Zhou, P., Jiang, X., Bregman, J. N., & Gao, Y. 2019, ApJ, 877, 3 [NASA ADS] [CrossRef] [Google Scholar]
- Li, J.-T., Lu, L.-Y., Qu, Z., et al. 2024, ApJ, 967, 78 [NASA ADS] [CrossRef] [Google Scholar]
- Lisenfeld, U., Espada, D., Verdes-Montenegro, L., et al. 2011, A&A, 534, A102 [NASA ADS] [CrossRef] [EDP Sciences] [Google Scholar]
- Lisenfeld, U., Xu, C. K., Gao, Y., et al. 2019, A&A, 627, A107 [NASA ADS] [CrossRef] [EDP Sciences] [Google Scholar]
- Lisenfeld, U., Ogle, P. M., Appleton, P. N., Jarrett, T. H., & Moncada-Cuadri, B. M. 2023, A&A, 673, A87 [NASA ADS] [CrossRef] [EDP Sciences] [Google Scholar]
- Lu, L.-Y., Li, J.-T., Vargas, C. J., et al. 2023, MNRAS, 519, 6098 [NASA ADS] [CrossRef] [Google Scholar]
- Lu, L.-Y., Li, J.-T., Vargas, C. J., et al. 2024, A&A, 691, A217 [NASA ADS] [CrossRef] [EDP Sciences] [Google Scholar]
- Makarov, D., Prugniel, P., Terekhova, N., Courtois, H., & Vauglin, I. 2014, A&A, 570, A13 [NASA ADS] [CrossRef] [EDP Sciences] [Google Scholar]
- McGaugh, S. S. 2005, ApJ, 632, 859 [Google Scholar]
- McGaugh, S. S., Schombert, J. M., Bothun, G. D., & de Blok, W. J. G. 2000, ApJ, 533, L99 [Google Scholar]
- Meier, D. S., & Turner, J. L. 2004, AJ, 127, 2069 [CrossRef] [Google Scholar]
- Paglione, T. A. D., Wall, W. F., Young, J. S., et al. 2001, ApJS, 135, 183 [NASA ADS] [CrossRef] [Google Scholar]
- Pan, H.-A., Lin, L., Hsieh, B.-C., et al. 2018, ApJ, 868, 132 [Google Scholar]
- Papadopoulos, P. P., & Seaquist, E. R. 1999, ApJ, 516, 114 [NASA ADS] [CrossRef] [Google Scholar]
- Papadopoulos, P. P., van der Werf, P. P., Xilouris, E. M., et al. 2012, MNRAS, 426, 2601 [NASA ADS] [CrossRef] [Google Scholar]
- Peñaloza, C. H., Clark, P. C., Glover, S. C. O., Shetty, R., & Klessen, R. S. 2017, MNRAS, 465, 2277 [CrossRef] [Google Scholar]
- Peñaloza, C. H., Clark, P. C., Glover, S. C. O., & Klessen, R. S. 2018, MNRAS, 475, 1508 [CrossRef] [Google Scholar]
- Renaud, F., Bournaud, F., Kraljic, K., & Duc, P. A. 2014, MNRAS, 442, L33 [NASA ADS] [CrossRef] [Google Scholar]
- Roman-Duval, J., Heyer, M., Brunt, C. M., et al. 2016, ApJ, 818, 144 [NASA ADS] [CrossRef] [Google Scholar]
- Rosolowsky, E., & Leroy, A. 2006, PASP, 118, 590 [NASA ADS] [CrossRef] [Google Scholar]
- Saintonge, A., & Catinella, B. 2022, ARA&A, 60, 319 [NASA ADS] [CrossRef] [Google Scholar]
- Saintonge, A., Kauffmann, G., Wang, J., et al. 2011, MNRAS, 415, 61 [NASA ADS] [CrossRef] [Google Scholar]
- Saintonge, A., Catinella, B., Tacconi, L. J., et al. 2017, ApJS, 233, 22 [Google Scholar]
- Salim, S., Rich, R. M., Charlot, S., et al. 2007, ApJS, 173, 267 [NASA ADS] [CrossRef] [Google Scholar]
- Sandstrom, K. M., Leroy, A. K., Walter, F., et al. 2013, ApJ, 777, 5 [Google Scholar]
- Schmidt, M. 1959, ApJ, 129, 243 [NASA ADS] [CrossRef] [Google Scholar]
- Shetty, R., Glover, S. C., Dullemond, C. P., et al. 2011, MNRAS, 415, 3253 [NASA ADS] [CrossRef] [Google Scholar]
- Skrutskie, M. F., Cutri, R. M., Stiening, R., et al. 2006, AJ, 131, 1163 [NASA ADS] [CrossRef] [Google Scholar]
- Solomon, P. M., Scoville, N. Z., & Sanders, D. B. 1979, ApJ, 232, L89 [NASA ADS] [CrossRef] [Google Scholar]
- Solomon, P. M., Rivolo, A. R., Barrett, J., & Yahil, A. 1987, ApJ, 319, 730 [Google Scholar]
- Strong, A. W., & Mattox, J. R. 1996, A&A, 308, L21 [NASA ADS] [Google Scholar]
- Sutter, J., & Fadda, D. 2022, ApJ, 941, 47 [NASA ADS] [CrossRef] [Google Scholar]
- Tacconi, L. J., Genzel, R., & Sternberg, A. 2020, ARA&A, 58, 157 [NASA ADS] [CrossRef] [Google Scholar]
- Tan, Q.-H., Gao, Y., Zhang, Z.-Y., & Xia, X.-Y. 2011, Res. Astron. Astrophys., 11, 787 [CrossRef] [Google Scholar]
- Tremonti, C. A., Heckman, T. M., Kauffmann, G., et al. 2004, ApJ, 613, 898 [Google Scholar]
- Truran, J. W. 1977, in CNO Isotopes in Astrophysics, ed. J. Audouze, Astrophys. Space Sci. Lib., 67, 145 [NASA ADS] [CrossRef] [Google Scholar]
- Vargas, C. J., Mora-Partiarroyo, S. C., Schmidt, P., et al. 2018, ApJ, 853, 128 [NASA ADS] [CrossRef] [Google Scholar]
- Vargas, C. J., Walterbos, R. A. M., Rand, R. J., et al. 2019, ApJ, 881, 26 [NASA ADS] [CrossRef] [Google Scholar]
- Vila-Vilaro, B., Cepa, J., & Zabludoff, A. 2015, ApJS, 218, 28 [NASA ADS] [CrossRef] [Google Scholar]
- Walter, F., Brinks, E., de Blok, W. J. G., et al. 2008, AJ, 136, 2563 [Google Scholar]
- Wang, J., Yang, D., Oh, S. H., et al. 2023, ApJ, 944, 102 [NASA ADS] [CrossRef] [Google Scholar]
- Wang, J., Lin, X., Yang, D., et al. 2024, ApJ, 968, 48 [NASA ADS] [CrossRef] [Google Scholar]
- Werk, J. K., Prochaska, J. X., Tumlinson, J., et al. 2014, ApJ, 792, 8 [NASA ADS] [CrossRef] [Google Scholar]
- Wiegert, T., Irwin, J., Miskolczi, A., et al. 2015, AJ, 150, 81 [Google Scholar]
- Wilson, T. L., Rohlfs, K., & Hüttemeister, S. 2013, Tools of Radio Astronomy (Berlin, Heidelberg: Springer) [Google Scholar]
- Wong, T., & Blitz, L. 2002, ApJ, 569, 157 [CrossRef] [Google Scholar]
- Xu, X., Wang, J., Li, Z., & Chen, Y. 2024, ApJ, 971, 165 [NASA ADS] [CrossRef] [Google Scholar]
- Yajima, Y., Sorai, K., Miyamoto, Y., et al. 2021, PASJ, 73, 257 [NASA ADS] [CrossRef] [Google Scholar]
- Yao, L., Seaquist, E. R., Kuno, N., & Dunne, L. 2003, ApJ, 588, 771 [NASA ADS] [CrossRef] [Google Scholar]
- Yim, K., Wong, T., Howk, J. C., & van der Hulst, J. M. 2011, AJ, 141, 48 [NASA ADS] [CrossRef] [Google Scholar]
- Young, J. S., & Knezek, P. M. 1989, ApJ, 347, L55 [NASA ADS] [CrossRef] [Google Scholar]
- Zanchettin, M. V., Feruglio, C., Massardi, M., et al. 2023, A&A, 679, A88 [NASA ADS] [CrossRef] [EDP Sciences] [Google Scholar]
- Zheng, Y., Wang, J., Irwin, J., et al. 2022, MNRAS, 513, 1329 [NASA ADS] [CrossRef] [Google Scholar]
All Tables
All Figures
|
Fig. 1. NGC 2613 spectra: 12CO J = 1 − 0 (left), 13CO J = 1 − 0 (middle), and 12CO J = 2 − 1 (right). Each row represents a different location, as shown in Fig. 3. In the upper half of each panel, the y-axis is the main beam temperature after correcting for the main beam forward efficiency. The lower half of each panel shows the residual of the best fit. The lower x-axis for all galaxies shows the same velocity range within ±1000 km s−1. The top x-axis indicates the frequency range for the three different molecular lines of each galaxy, set according to the zero velocity, which is defined by the galaxy’s systematic velocity (Irwin et al. 2012). All spectra are binned to a velocity resolution of 10 km s−1. The green curves represent the best-fit Gaussian lines, and the red line is the baseline. The blue curve represents the fitted RFI, as detailed in Sect. 2.2. The black box indicates the velocity range (ΔW) determined by the 12CO J = 1 − 0 line width, which is used as the fitting range. This range is also displayed on the 13CO J = 1 − 0 and 12CO J = 2 − 1 spectra to show the position of the 12CO emission line. If there is a deviation, the red box highlights the adjusted velocity range used for fitting the other lines. The blue boxes mask some low-significance features that could be artificial and may slightly affect the fitting. These features are masked from the fitting and the calculation of the rms. |
| In the text | |
|
Fig. 2. Spectra of 12CO J = 1 − 0 (left panel) and 12CO J = 2 − 1 (right panel) for NGC 2992 presented in the same format as in Fig. 1. |
| In the text | |
|
Fig. 3. The observational positions and the radial CO line profiles of NGC 2613. Leftpanel: Pan − STARRSg-band image displaying an 11′×11′ area centered on NGC 2613. The solid circles indicate the location of IRAM 30 m beams with a ≈21.4″ diameter for the 12CO J = 1 − 0 spectral band. The dashed circles represent the background location for the PSW observations. The overlay contours are from a convolved 22 μm image from the WISE archive. For most galaxies, contour levels include 3σ, 10σ, and 50σ, with additional levels at 100σ and 150σ for those with more pronounced flux peaks, where 3σ corresponds to a median flux of 0.01 mJy. UGC 10288 is an exception, where the contour levels are 3σ and 10σ. Rightpanel: Integrated intensities of the 12CO J = 1 − 0 (top row), 13CO J = 1 − 0 (middle row), and 12CO J = 2 − 1 (bottom row) lines along the galaxy disc. The lines correspond to the numbered positions in the left panel. The filled diamond indicates the galaxy nucleus. The x-axis represents the projected distance to the minor axis as listed in Table 3. The right y-axes of the top two panels show the molecular gas column density NH2 derived from the corresponding line. |
| In the text | |
|
Fig. 4. Comparison of the total molecular gas mass derived from the 12CO J = 1 − 0 and 13CO J = 1 − 0 lines for 23 galaxies in our sample. The dashed line represents the 1:1 ratio. Galaxies hosting extremely radio bright AGNs, which may significantly influence the measurements of radio flux density, are marked with a thick black circle, while those with radio bright AGNs, which are less likely to strongly affect the radio flux measurements, are marked with a thin black circle. These AGNs are labelled as ‘ERB’ and ‘RB,’ respectively, in the last column of Table 1 in Li et al. (2016a). |
| In the text | |
|
Fig. 5. Comparison of the 12CO/13CO J = 1 − 0 and 12CO J = 2 − 1/J = 1 − 0 line ratios for 23 galaxies in our sample. The disc regions and galactic nuclei are represented with open and filled symbols, respectively. The blue lines show the mean error for points without upper or lower limits. The red symbols represent the median value for the sample. |
| In the text | |
|
Fig. 6. Kinetic temperature (TK) shown as a function of the optical depth of 13CO (τ13CO), both derived from the nuclear and disc regions of the molecular gas under the assumption of LTE. The blue lines indicate the mean error. |
| In the text | |
|
Fig. 7.
|
| In the text | |
|
Fig. 8. Distribution of |
| In the text | |
|
Fig. 9.
|
| In the text | |
|
Fig. 10. Rotational velocity shown as a function of the baryonic mass of galaxies. The AGN symbol is the same as in Fig. 4. The dashed line is the best fit of baryonic Tully-Fisher relation from McGaugh (2005). The red box symbols represent galaxies from the CGM-MASS sample, with lighter red boxes indicating those that only include stellar mass and darker red boxes adding the hot gas mass of the galaxy, both of which were obtained from Li et al. (2017). The mass variations for each galaxy, considering whether hot gas mass is included or not, are indicated by black arrows. |
| In the text | |
|
Fig. 11. Rotational velocity shown as a function of the total cold gas mass to baryonic mass ratio of galaxies. The AGN symbol is the same as in Fig. 4. |
| In the text | |
Current usage metrics show cumulative count of Article Views (full-text article views including HTML views, PDF and ePub downloads, according to the available data) and Abstracts Views on Vision4Press platform.
Data correspond to usage on the plateform after 2015. The current usage metrics is available 48-96 hours after online publication and is updated daily on week days.
Initial download of the metrics may take a while.