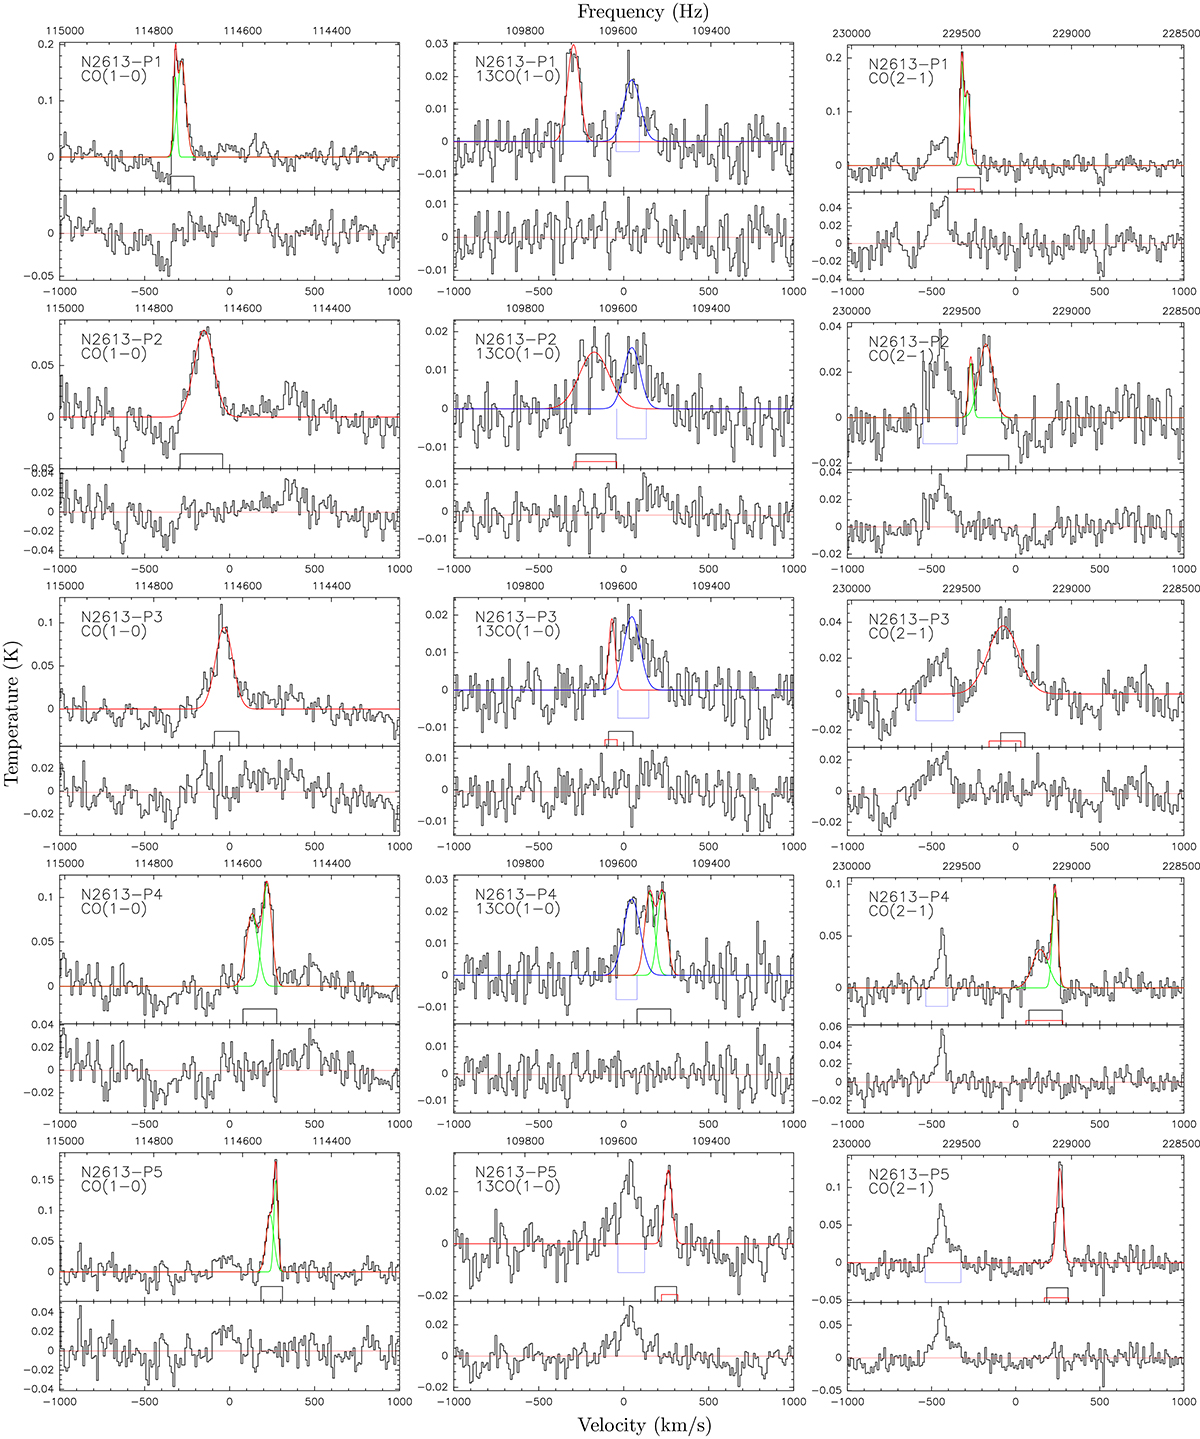
Fig. 1.
Download original image
NGC 2613 spectra: 12CO J = 1 − 0 (left), 13CO J = 1 − 0 (middle), and 12CO J = 2 − 1 (right). Each row represents a different location, as shown in Fig. 3. In the upper half of each panel, the y-axis is the main beam temperature after correcting for the main beam forward efficiency. The lower half of each panel shows the residual of the best fit. The lower x-axis for all galaxies shows the same velocity range within ±1000 km s−1. The top x-axis indicates the frequency range for the three different molecular lines of each galaxy, set according to the zero velocity, which is defined by the galaxy’s systematic velocity (Irwin et al. 2012). All spectra are binned to a velocity resolution of 10 km s−1. The green curves represent the best-fit Gaussian lines, and the red line is the baseline. The blue curve represents the fitted RFI, as detailed in Sect. 2.2. The black box indicates the velocity range (ΔW) determined by the 12CO J = 1 − 0 line width, which is used as the fitting range. This range is also displayed on the 13CO J = 1 − 0 and 12CO J = 2 − 1 spectra to show the position of the 12CO emission line. If there is a deviation, the red box highlights the adjusted velocity range used for fitting the other lines. The blue boxes mask some low-significance features that could be artificial and may slightly affect the fitting. These features are masked from the fitting and the calculation of the rms.
Current usage metrics show cumulative count of Article Views (full-text article views including HTML views, PDF and ePub downloads, according to the available data) and Abstracts Views on Vision4Press platform.
Data correspond to usage on the plateform after 2015. The current usage metrics is available 48-96 hours after online publication and is updated daily on week days.
Initial download of the metrics may take a while.