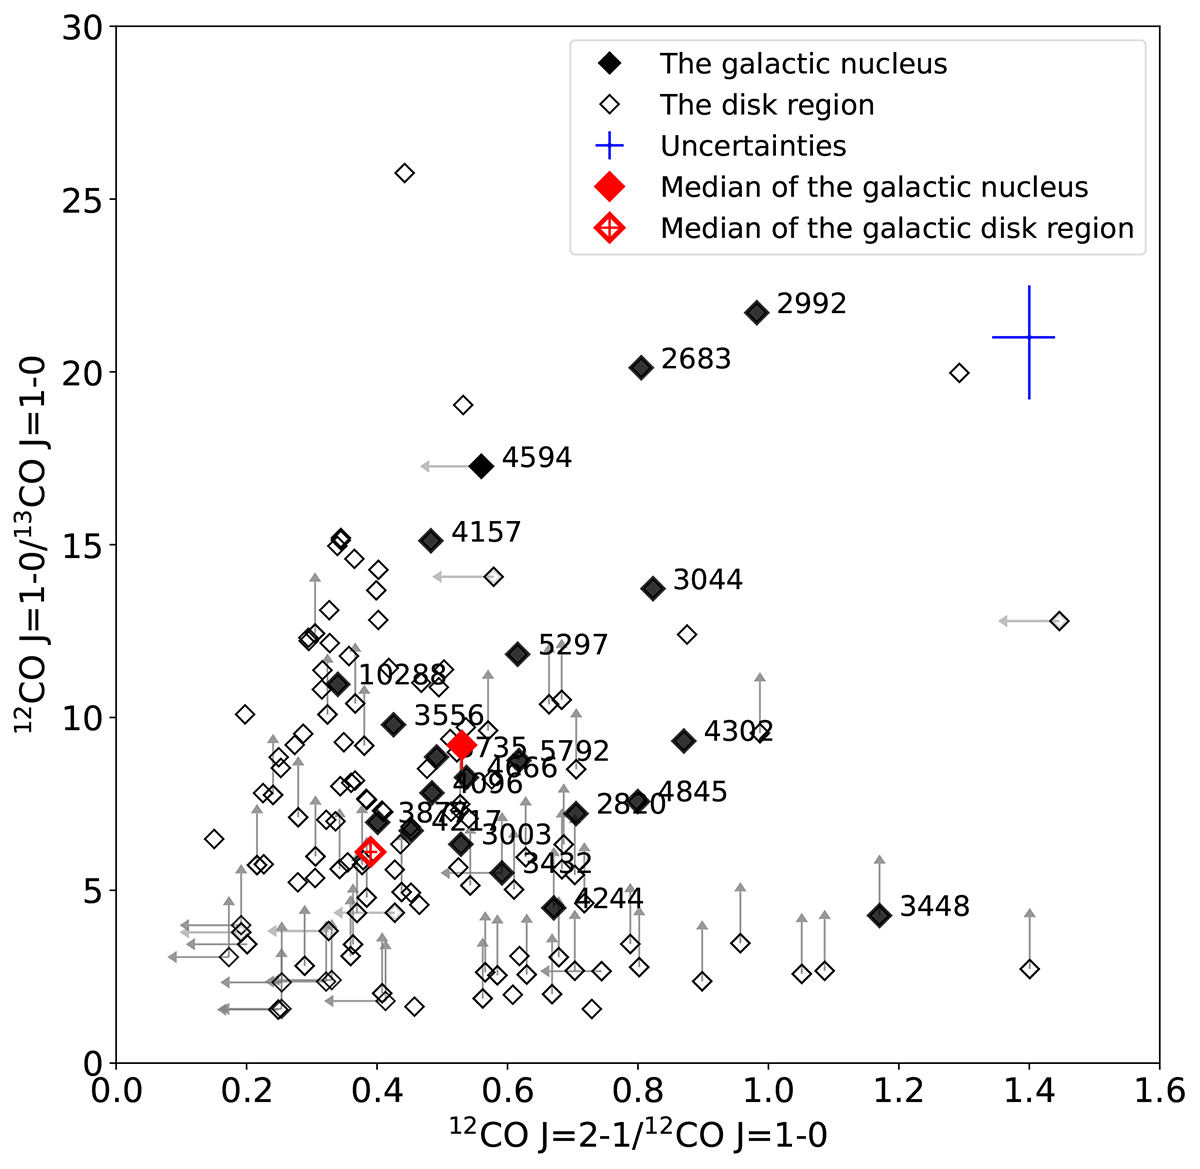
Fig. 5.
Download original image
Comparison of the 12CO/13CO J = 1 − 0 and 12CO J = 2 − 1/J = 1 − 0 line ratios for 23 galaxies in our sample. The disc regions and galactic nuclei are represented with open and filled symbols, respectively. The blue lines show the mean error for points without upper or lower limits. The red symbols represent the median value for the sample.
Current usage metrics show cumulative count of Article Views (full-text article views including HTML views, PDF and ePub downloads, according to the available data) and Abstracts Views on Vision4Press platform.
Data correspond to usage on the plateform after 2015. The current usage metrics is available 48-96 hours after online publication and is updated daily on week days.
Initial download of the metrics may take a while.