Fig. 10.
Download original image
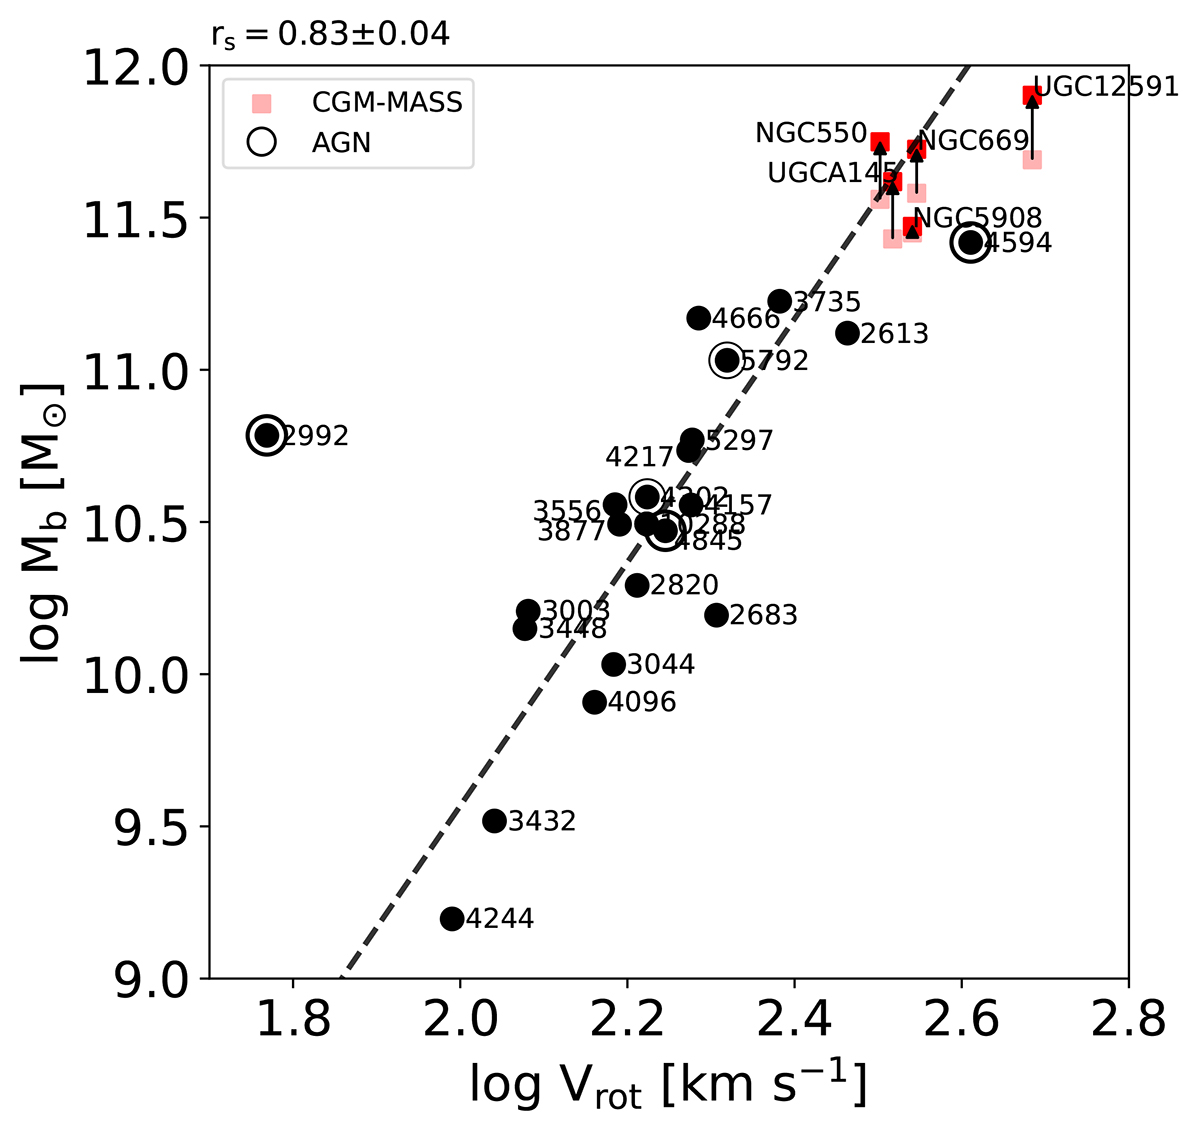
Rotational velocity shown as a function of the baryonic mass of galaxies. The AGN symbol is the same as in Fig. 4. The dashed line is the best fit of baryonic Tully-Fisher relation from McGaugh (2005). The red box symbols represent galaxies from the CGM-MASS sample, with lighter red boxes indicating those that only include stellar mass and darker red boxes adding the hot gas mass of the galaxy, both of which were obtained from Li et al. (2017). The mass variations for each galaxy, considering whether hot gas mass is included or not, are indicated by black arrows.
Current usage metrics show cumulative count of Article Views (full-text article views including HTML views, PDF and ePub downloads, according to the available data) and Abstracts Views on Vision4Press platform.
Data correspond to usage on the plateform after 2015. The current usage metrics is available 48-96 hours after online publication and is updated daily on week days.
Initial download of the metrics may take a while.