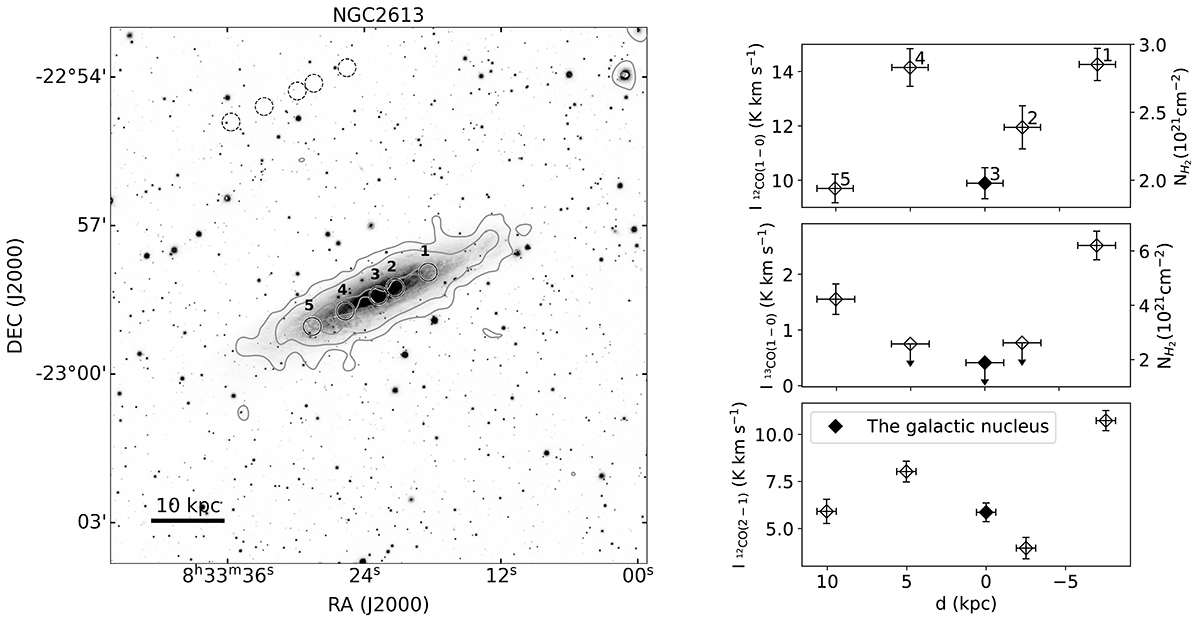
Fig. 3.
Download original image
The observational positions and the radial CO line profiles of NGC 2613. Leftpanel: Pan − STARRSg-band image displaying an 11′×11′ area centered on NGC 2613. The solid circles indicate the location of IRAM 30 m beams with a ≈21.4″ diameter for the 12CO J = 1 − 0 spectral band. The dashed circles represent the background location for the PSW observations. The overlay contours are from a convolved 22 μm image from the WISE archive. For most galaxies, contour levels include 3σ, 10σ, and 50σ, with additional levels at 100σ and 150σ for those with more pronounced flux peaks, where 3σ corresponds to a median flux of 0.01 mJy. UGC 10288 is an exception, where the contour levels are 3σ and 10σ. Rightpanel: Integrated intensities of the 12CO J = 1 − 0 (top row), 13CO J = 1 − 0 (middle row), and 12CO J = 2 − 1 (bottom row) lines along the galaxy disc. The lines correspond to the numbered positions in the left panel. The filled diamond indicates the galaxy nucleus. The x-axis represents the projected distance to the minor axis as listed in Table 3. The right y-axes of the top two panels show the molecular gas column density NH2 derived from the corresponding line.
Current usage metrics show cumulative count of Article Views (full-text article views including HTML views, PDF and ePub downloads, according to the available data) and Abstracts Views on Vision4Press platform.
Data correspond to usage on the plateform after 2015. The current usage metrics is available 48-96 hours after online publication and is updated daily on week days.
Initial download of the metrics may take a while.