| Issue |
A&A
Volume 694, February 2025
|
|
|---|---|---|
| Article Number | A213 | |
| Number of page(s) | 11 | |
| Section | Interstellar and circumstellar matter | |
| DOI | https://doi.org/10.1051/0004-6361/202452526 | |
| Published online | 14 February 2025 | |
Redistribution of ices between grain populations in protostellar envelopes
Only the coldest grains get ices
Engineering Research Institute “Ventspils International Radio Astronomy Centre” of Ventspils University of Applied Sciences,
Inženieru 101,
Ventspils,
LV-3601,
Latvia
★ Corresponding author; This email address is being protected from spambots. You need JavaScript enabled to view it.
Received:
8
October
2024
Accepted:
23
December
2024
Abstract
Context. Matter that falls onto a protoplanetary disk (PPD) from a protostellar envelope is heated before it cools again. This induces sublimation and subsequent re-adsorption of ices that accumulated during the prestellar phase.
Aims. We explore the fate of ices on multiple-sized dust grains in a parcel of infalling matter.
Methods. A comprehensive kinetic chemical model using five grain-size bins with different temperatures was applied for an infalling parcel. The parcel was heated to 150 K and then cooled over a total timescale of 20 kyr. Effects on ice loss and re-accumulation by the changed gas density, the maximum temperature, the irradiation intensity, the size-dependent grain temperature trend, and the distribution of the ice mass among the grain-size bins were investigated.
Results. A massive selective redistribution of ices exclusively onto the surface of the coldest grain-size bin occurs in all models. The redistribution starts already during the heating stage, where ices that are sublimated from warmer grains re-adsorb onto colder grains before complete sublimation. During the cooling stage, the sublimated molecules re-freeze again onto the coldest grains. In the case of full sublimation, this re-adsorption is delayed and occurs at lower temperatures because a bare grain surface has lower molecular desorption energies in our model.
Conclusions. Most protostellar envelope grains enter the PPD ice poor (bare). Ices are carried by a single coldest grain-size bin, here representing 12% of the total grain surface area. This bare ice-grain dualism can affect the rate of the grain coagulation. The ice components are stratified on the grains according to their sublimation temperatures.
Key words: astrochemistry / molecular processes / planets and satellites: formation / protoplanetary disks / stars: formation / dust, extinction
© The Authors 2025
 Open Access article, published by EDP Sciences, under the terms of the Creative Commons Attribution License (https://creativecommons.org/licenses/by/4.0), which permits unrestricted use, distribution, and reproduction in any medium, provided the original work is properly cited.
This article is published in open access under the Subscribe to Open model. This email address is being protected from spambots. You need JavaScript enabled to view it. to support open access publication.
1 Introduction
Planets around low-mass stars are formed from dust grains that consist of refractory materials and volatile ices. The grains initially reside in the interstellar medium, part of which transforms into a dense molecular cloud that contains a prestellar core (Tafalla 2018). After the protostar is born, the remainder of the core forms a protostellar envelope. Dust and gas fall from the envelope onto the protoplanetary disk (PPD). During this process, dust and gas are heated, up to a few hundred K. This can occur via two primary mechanisms. Firstly, heating is provided by a mild accretion shock at the centrifugal barrier near the outer rim of the PPD (Cassen & Moosman 1981; Sakai et al. 2014). Secondly, when the infall trajectory is near the outflow cavity, the grains are temporarily heated by protostellar radiation (Visser et al. 2009). Upon arrival on the disk, the gas and dust become shielded from protostellar and interstellar radiation and cool again. The disk material continues to experience heating events either through shocks in the disk or through flaring of the protostar (Armitage 2011).
The composition of interstellar ices can be reset during star formation before the ices are included into planets or comets (Jørgensen et al. 2020). The partial resetting of ice before it arrives in PPDs has been confirmed by astrochemical simulations (Visser et al. 2011; Drozdovskaya et al. 2014; Aota et al. 2015; Furuya et al. 2017) and in PPDs themselves (Podolak et al. 2011; Molyarova et al. 2018). These studies employed models that considered a single grain size. However, grains are expected to have a variety of sizes, shapes, and composition. Their size and material can cause differences in the dust grain temperatures Td. A proven approach in numerical simulations is to discern the grains according to their size (Acharyya et al. 2011). For the modelling, the grain-size distribution can be represented by several discrete grain-size bins. These multi-grain models show that different temperatures for the grain-size bins affect the formation rate of the icy mantles and their eventual composition (Pauly & Garrod 2016).
The temperatures experienced by a gas-dust parcel infalling from the envelope towards the PPD can exceed the sublimation temperatures of the main ice species CO, CO2, and H2O. In this case, ice species first sublimate from the hottest grain population. Kalvāns & Freimanis (2024, hereafter KF24) found that observations of complex organic molecules (hot corinos) and carbon chains (warm carbon-chain chemistry) in low-mass protostars are best explained by an assortment of temperatures of the dust grains, rather than a single Td for all grains.
The aim of this study is to explore how the rise and decrease in grain temperatures at typical infall conditions redistribute the ices between hotter and colder grain populations. In particular, we explore whether a heating-cooling cycle can induce an accumulation of ices in the coldest grain-size bin but leaves other grains ice poor. This situation briefly occurred during heating in the KF24 model. An asymmetric redistribution of ices like this can considerably affect the grain size and stickiness, which in turn affects the expected starting conditions for planet formation in PPDs. To fulfil the aim of this study, we applied the multigrain model of KF24 for a parcel of circumstellar matter infalling towards the inner region of a protostellar core. The parcel was heated before it cooled again, presumably during infall towards the inner region (PPD) of a protostellar core.
Features and parameters of the Standard model.
2 Methods
The study is based on the model of Kalvāns et al. (2024, hereinafter KKV24). The application of this model for protostellar envelope chemistry has illustrated the importance of the grain temperature distribution in circumstellar environments (KF24).
2.1 Chemical model
The recently updated multi-grain kinetic rate-equation astrochemical model ALCHEMIC-VENTA (originally introduced by Kalvāns 2015) now has an advanced treatment for molecular grain surface processes. We only include a brief description of the chemical aspects and refer to KKV24, where the chemical aspects are explained in detail and with the relevant references. Table 1 summarises the features of the code and the default values of the important physical and chemical parameters, as used in our Standard model.
A single major change was introduced in the code: The bulkice multi-layer approach for modelling the icy mantles on grains was removed. This was required for a physically correct description of rapid thermal desorption and re-adsorption of ice species onto grains. With a multi-layer approach, the rate of these processes could be artificially slowed down by the simulated transfer of molecules between the ice layers. Considering bulk ice does not substantially change the overall surface chemistry at elevated temperatures of the protostellar stage (Garrod 2013).
The surface chemistry starts with molecule adsorption onto the grain surface. Ice accumulates into five grain-size bins, and smaller grains have larger populations according to the MRN grain-size distribution, as shown in Table 2. All grains share a similar composite chemical make-up. The grains were assumed to be partially processed, as expected for a star-forming region. More precisely, the small grains were depleted onto the larger grains (Silsbee et al. 2020; Sipilä et al. 2020), whose abundance was increased by a factor of 1.25 to retain the MRN mass budget. Moreover, the surfaces of the refractory grains were assumed to be carbonaceous to account for the adsorption of polycyclic aromatic hydrocarbon molecules and polymerised organic residue that formed by the over-photoprocessing of ices during the previous star-forming activity (Hagen et al. 1979; Allamandola et al. 1988; Quirico et al. 2016). This assumed carbonaceous coating is not able to participate in strong inter-molecular hydrogen bonds with ice molecules, and this affects the chemical properties of bare grains (KKV24).
The average temperature of dust depends on its composition, on the intensity of electromagnetic radiation, and on the grain size (Li & Draine 2001; Draine 2003; Cuppen et al. 2006; Li & Mann 2012). The latter two aspects were considered here. The temperature of the grain populations was determined by the grain radius, following the equation
 (1)
(1)
where a is the radius of the refractory grain, b is the ice-mantle thickness (in µm), and Td,0.1 is the temperature of 0.1 µm grains (Krügel 2007; Pauly & Garrod 2016). The exponent y is a variable. For simplicity, Td,0.1 was assumed to be equal to Tgas (Sect. 2.2). Tgas has been shown to be similar to Td of sub-micron grains by more complex models (Gavino et al. 2021).
The surface processes include binary reactions, photodissociation of the ice species, and six desorption mechanisms. These are sublimation, photodesorption by the interstellar UV radiation field (ISRF), and cosmic-ray (CR) induced photons, chemical desorption of the products of exothermic reactions, indirect chemical desorption by the frequent H+H→H2 surface reaction, and CR-induced whole-grain heating. Out of these, sublimation primarily matters in the protostellar stage, while the other processes are mainly important for creating a feasible composition of the ice in the prestellar core that is inherited by the protostellar envelope. The rate of binary reactions and desorption is affected by the molecular desorption energy ED, which varies depending on the surroundings of the molecule, whether it is a bare grain, strongly polar (H2O), or hyper-volatile ices (CO).
As a dedicated chemical model, ALCHEMIC-VENTA has benefits for the calculation of the grain-size (ice-mantle thickness) evolution. It includes the UMIST RATE12 reaction net- work1 and considers ice photoprocessing and desorption by several mechanisms, with rate coefficients that are updated according to recent experimental and theoretical results (KKV24). The most significant chemical aspect probably is the solid-phase conversion of CO into CO2 and CH3OH, that is, the chemical production of species with increasing sublimation temperatures Tsubl, which is not easily reproduced by simplified functions (e.g., Rawlings & Williams 2021). This conversion is important because when the gas temperature Tgas rises, it allows repeated freeze-out of a major part of the C and O atoms into ice after the sublimation of the CO ice. Other chemical transformations of similar nature include N2 → NH3 and the CH4 → C2H6→ longer carbon chains (KF24).
We studied events in a protostellar envelope that inherited its ices from the dark prestellar core. Table 3 lists the elemental abundances. Therefore, the initial conditions were set to be characteristic for these cores, with Tgas ≡ Td,0.1 = 10 K, and the initial chemical composition was drawn from the prestellar stage model of KF24, using the elements of Table 3. Table 4 lists the initial abundance of the most important molecules (we used abundances relative to H (X/H), as used in the models, while in the results sections, the abundances are relative to H2, n/n(H2), as is often shown for astrochemical observations). The ISRF extinction was kept constant at AV = 10 mag. The effects of the ISRF photons are still insignificant for the Standard model. The number density of H atoms was also kept constant, with nH = 108 cm−3 as the default value.
According to Eq. (1), Td smoothly grows for all grains with increasing Td,0.1, while the difference between Td for grains in various size bins increases consistently. This may not always be the case as the incident spectrum of protostellar radiation is modified by absorption and scattering. Variations in the spectrum and intensity due to distance to the protostar and the amount of intervening material may change the relative efficiency for the heating of grains of different sizes. Furthermore, the optical properties of the grains also change when ices sublimate or refreeze onto their surfaces. These effects were not accounted for in our model and can affect the relative temperatures for grains of different sizes.
Basic data of the five grain populations.
Elemental abundances relative to hydrogen.
Initial X/H of some major species.
2.2 Model parameters
Visser et al. (2009); Drozdovskaya et al. (2014), and Furuya et al. (2017) indicated that for an infalling parcel of matter in a low-mass protostellar envelope, the rise and fall of the temperature occurs on timescales of about 20–100 kyr. We adopted the shorter timescale, divided equally between the heating (theat) and cooling (tcool) episodes, as listed in Table 1. This is a conservative assessment because longer timescales would favour sublimation of ices and thus a more complete redistribution to colder grain-size bins. Therefore, theat and tcool were not considered as variables in this study. The temperature increased from Tini = 10 K to the peak gas temperature Tmax over 10 kyr proportionally to the integration time squared t2 (Garrod et al. 2008), while the decrease from Tmax to the final temperature of Tend = 40 K followed a reverse curve. Because Tgas did not return to 10 K, the total integration time for the up-down temperature curve was 16.2 kyr, not 20 kyr. To study what happens after the heating episode, the simulations were continued for another 4 kyr with Tgas = Tend, up to a total time-span of 20 kyr.
We assumed that the parcel did not enter dense, cold, and shielded inner parts of the PPD during the simulation. Thus, AV and nH did not rise significantly, and Tend remained relatively high at 40 K in Model Standard. Possible mixing with other infalling matter (nearby parcels) was not considered. The simplified conditions with fixed AV, nH, Tmax, theat, and tcool were not intended to reflect conditions in real infalling proto- stellar gas. Instead, the fixed conditions, roughly representative of protostellar envelopes, and the simple Td dependence on the grain size allowed us to understand the transfer of volatile matter through gas between grain populations with different Td without other complex background physics. In addition to the Standard model, described above and in Table 1, a number of other simulations were carried out. A physical parameter, nH, Tmax (and Tend), the irradiation intensity factor I, the time spent at an elevated temperature tplat, y, or the initial abundance of ices, was modified in each of these models relative to Standard. Table 5 lists all the models and the changes in their parameter values. The considerations for the selection of changed parameters and their values are described below in Sect. 3, along with the modelling results.
3 Results
The gas-grain chemistry of the prestellar stage produces icy mantles that are inherited by the protostellar envelope. To study the sublimation of ices, it is convenient to classify the ice species into groups that share similar sublimation temperatures. These groups of species are primarily the hyper-volatile species N2, CO, and CH4 ices, which already sublimate at Td > 22 K, CO2 ice that sublimates at Td > 55 K, and NH3, CH3OH, and H2O ices, which start to sublimate when Td exceeds about 90 K. The latter two groups include a variety of other compounds, such as C2H2, H2S, and HCN, which sublimate together with CO2, as well as HCOOH, H2O2, and HF, which sublimate together with or after H2O ice. In what follows, the primary focus is on the total abundance of the species that constitute the groups and their chemical transformation into molecules that belong to another group.
The modelling of hundreds of species and thousands of reactions allowed us to simulate a series of chemical changes in the species and their phase transition that affect the grain-size evolution, such as the partial re-freeze of sublimated CO in the form of CO2, the re-freeze of N2 in the form of NH3, and the re-freeze of CO2 oxygen in the form of H2O. At the end of the prestel- lar stage, all grain sizes had a b of about 64…82 ice molecule monolayers (MLs; Table 2). A few percent of C and O are in many organic species that contain several heavy atoms, each with abundances relative to H2 (n/n(H2)) below 10−6.
Investigation models and their changed parameters relative to the Standard model.
3.1 Standard results
We start with the results of the Standard model. These were further used as a reference for the comparison with other simulations. The ice sublimation started with the desorption of dinitrogen N2. Half or 50% of the N2 ice relative to its initial abundance was thermally desorbed at an integration time t = 2.4 kyr and a gas temperature Tdes = 26 K. The sublimation was not momentary; 99% N2 ice disappeared in the Tgas interval between 19 and 29 K (t = 1.5…2.7 kyr), while 80% N2 ice loss was observed at 23…28 K (2.1…2.7 kyr). All ice species showed sublimation periods of several 102 yr, with a temperature rise to about 10 K. These slow sublimation processes occur because the grain temperatures are spread out and we did not use a single Td value.
The 40 K value for Tend in the Standard model is too high for N2 to re-freeze again; thus it does not have a value for its 50% re-adsorption temperature Tre. The ice molecule that experienced re-accumulation during the cooling stage in almost each simulation was carbon dioxide, CO2. In the Standard model, the temperature Tre for 50% CO2 re-adsorption (relative to its initial abundance) is Tre,CO2 = 72K at t = 13.9 kyr. Re-accumulation of CO2 ice from 10% to 90% of its initial abundance occured from 75 to 69 K (13.7… 14.1 kyr), while freeze-out from 1% to 99% of the initial abundance occured in the 80…68 K interval (13.4…14.2 kyr). These numbers show that ice re-accumulation also takes several hundred years. In the case of CO2, the ice accumulation continued and reaches 120% relative to its initial abundance because it is produced via surface reactions. Similarly to N2, carbon monoxide, CO, remained in the gas-phase at the end of model Standard. The abundance of CO slowly decreased as it was converted into CO2 ice. This change is insignificant in model Standard (only 2% of CO), but becomes a major CO sink under irradiated conditions (Sect. 3.4). Table 6 lists the Tdes and Tre values for all models, along with the initial n/n(H2) for all the major ice species N2, CO, CO2, methanol, CH3OH, ammonia, NH3, and water ice, H2O. As discussed below, Tdes and Tre are key parameters in understanding what occurred in each simulation.
Figure 1 shows that the sublimation of ices occurs sequentially. It starts in the hottest grain-size bin. After they are sublimated from a hot grain-size bin, the former icy molecules quickly re-freeze onto grains whose Td has not yet reached their thermal desorption temperature. Thus, the coolest grains accumulate most of the molecules that were sublimated from other grain-size bins, until the coolest grains are too hot and also sublimate their ices. This process is repeated for the hyper-volatile species CO, N2, and CH4 and for less volatile species, such as CO2. In the case of H2O, NH3, and CH3OH, this process occurs near Tmax, and the sublimation from the largest, coldest grains is interrupted by the start of the cooling stage. Reactive species, such as hydrogen peroxide, H2O2, and formaldehyde, H2CO, are initially produced via photoprocessing (of H2O and CH3OH ices, respectively) and are mostly destroyed at elevated temperatures even before full sublimation.
Figure 2 shows that the sequential sublimation from the five grain-size bins produces a characteristic seesaw pattern for the gas-phase abundances of the less volatile molecules CH3OH, NH3, and H2O in the heating stage of the Standard model (KF24). Table 2 lists the temperatures of the five grainsize bins when Tgas = Tmax. As the temperature drops, only H2O, NH3, CH3OH, and CO2 re-freeze before Tend = 40 K. The re-formation of icy mantles exclusively occurs onto the largest, coldest grains. For these, the ice thickness b0.232 reaches 363 MLs at the end of the simulation (t = 20 kyr), while it is below 1 ML for all the other grain-size bins.
The abundances of the re-accumulated ices are slightly changed compared to their initial values, as listed in Table 6: 106% for H2O, 102% for CH3OH, 105% for NH3, and 120% for CO2 ice. The increase arises from CO and N2, which are converted into less volatile molecules that can be stored on icy grains. Similar solid-phase final abundances were also obtained for other models, unless noted otherwise.
3.2 Gas density
The hydrogen atom number density nH has an assumed default value of 108 cm−3 in Model Standard. Practically all of the H atoms are in H2 molecules. The value of nH can reach about 1012 cm−3 during the transfer from the envelope to the disk (Visser et al. 2011). To investigate how these higher densities affect the transfer of ices between grain-size bins, we also considered nH = 1010 cm−3 in Model Dens10 and 1012 cm−3 in model Dens12. In addition, observations of complex organic molecules and warm carbon-chains in protostellar envelopes (Cazaux et al. 2003; Sakai et al. 2008) indicate that significant heating also occurs in less dense regions. For these, we used Models Dens6 and Dens7 with nH of 106 and 107 cm−3, respectively.
In the higher-density Models Dens10 and Dens12, which are relevant for PPD conditions, the Td differences for sub- µm grains are expected to be smaller than those derived with y = −1/6 (Podolak et al. 2011). To reflect a strong gas-grain thermal coupling, we assumed that y = −1/20 in these models. With this approach, the Td difference for the smallest and largest grains at Tgas = 10 K is below 0.5 K (lower than that calculated with the sophisticated model of Gavino et al. 2021) and 16 K at Tgas = 150 K. The smaller differences in Td may enable re-adsorption of gas-phase volatiles onto the surfaces of other grain-size bins, not just the coldest-grain population, because the other grain-size bins could also have sufficiently low Td.
With a higher nH, the molecules more often stick to the grains, which allows a faster growth of the icy mantles. In this way, higher nH shifts the ice sublimation to higher temperatures. With y assumed to be −1/20, the lowest Td is now higher relative to Tgas, which induces sublimation at lower Tgas. Table 6 shows that volatiles sublimate at higher Tgas in Model Dens10, where even H2O ice is sublimated, unlike in the Standard model. In Model Dens12 the rate of molecule adsorption onto grains, which is proportional to nH2, is so high that no significant degradation of the H2O ice abundance is observed. In other words, at a higher nH, a higher Td is needed for the thermal desorption rate to be higher than the rate of molecules that stick to grains. Moreover, some re-freeze near the end of the simulation at Tend = 40 K can also be experienced by the hyper-volatile molecules. This is shown by the re-accumulation of CO in Model Dens12, where the end abundance of CO ice reaches 2% of its initial abundance. In the two high-density models, a full migration of the ices to the coldest, largest 0.232 µm grains occurs, and b0.232 reaches 365 and 370MLs for Dens10 and Dens12, respectively.
In Models Dens6 and Dens7, the number density of gas and dust is lower by factors of 100 and 10 relative to the Standard model, respectively. The rate of molecules and atoms that stick to the grains is correspondingly lower by factors of 10 000 and 100. As a result, Fig. 2 shows that the coldest-grain population is unable to adsorb the volatiles before other grain-size bins become cold enough to grow their own icy mantles. In Model Dens7 most of the ice mass is still located on the large a = 0.232 µm grains with an ice thickness b0.232 = 279 MLs. The next largest bin with a = 0.146 µm has b0.46 = 96 MLs, the 0.092 µm grains have b0.092 = 14 MLs, while for the two smallest and hottest grain-size bins (0.058 and 0.037 µm) b is below 1 ML. For Model Dens6, the ice mass is evenly distributed between all grain-size bins with an ice thickness between b0.232 = 91 MLs and b0.037 = 34 MLs. Table 6 shows that the sublimation of ices and especially their re-accumulation occurs at lower temperatures for the low-density models.
Table 6 shows that there is a major difference for Tre between the Standard model on one hand and Models Dens6, Dens7, and Dens10 on the other hand. The reason for the low Tre values is that these models desorb all their ice at Tmax, exposing the bare-grain surface. The bare surfaces were assumed to be carbonaceous in our model, and did not form hydrogen bonds (KKV24). This means that the H2O, NH3, and CH3OH surface molecules sublimate above Td ≈ 80 K. A significant adsorption of these molecules is prevented until the Td of the coldest grain population allows accumulating ≈1 ML of ice. After this point, the ice accumulation is quick. An extreme case here is CH3OH, which only re-freezes to 48% of the initial abundance because the gas in Model Dens6 is destroyed. On the other hand, most CH3OH ice does not sublimate in Model Dens12 and can therefore reach an abundance of 144% relative to the initial value. The surplus abundance is reached during the first few thousand years because CO is hydrogenated on cold grains.
Gas temperatures for an ice loss of 50% relative to the initial abundances (Tdes (K)) during the heating stage and a re-adsorption of 50% (Tre (K)) during the cooling stage for six major ice species.
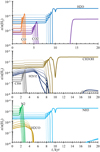 |
Fig. 1 Evolution of n/n(H2) for the major ice molecules on the surfaces of the five grain-size bins in the Standard model. The thicker lines show larger grains. |
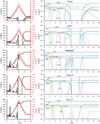 |
Fig. 2 Effects of nH on the ice sublimation and re-freeze with Models Dens6, Dens7, Standard, Dens10, and Dens12 from top to bottom. Left: ice thickness (black lines) changes with Td (red lines in the background). The thicker lines show larger grains. Right: n/n(H2) for ice (solid lines) and gas-phase (dotted lines) species. |
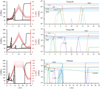 |
Fig. 3 Effects of changes related to Tmax on the ice sublimation and re-freeze with models Tmax50 (top) and Tmax100 (middle) with Tmax 50 and 100 K, respectively. The bottom plots show the results from Model Plateau with tplat = 10 kyr. Left: ice thickness (black lines) and grain temperature (red; the thicker lines show larger grains). Right: n/n(H2) of major species in gas (dotted) and ice (solid lines). This is to be compared with Model Standard in Fig. 2, where Tmax = 150 K and tplat = 0. The scale changes for the secondary y-axis (Td) in the left plots. |
3.3 Maximum temperature and its duration
Different trajectories from the envelope to the disk can have different Tmax. Our default value of 150 K is among the highest (Drozdovskaya et al. 2014; Furuya et al. 2017) and was chosen because water ice is sublimated from most grain populations at this temperature, which allows the transfer of most of the ice mass between the grain-size bins. Lower maximum gas temperatures of 50 and 100 K were considered in models Tmax50 and Tmax100, respectively, at the same theat and tcool.
Figure 3 shows that only the CO and N2 ices sublimate in Model Tmax50. Both molecules also re-freeze onto the coldest grain-size bin surface before Tend = 20 K is reached. The ice thickness for the 0.232 µm grains changes from 64 MLs initially to 276 MLs at the end of the simulation. In Model Tmax100, CO2 ice also sublimates and re-accumulates, while N2 ice does not re-freeze at Tend = 30 K, and finally, b0.232 = 251 MLs.
The Tmax50 and Tmax100 models differ in another way. The heating rate is lower by factors of 3 and 2, respectively, relative to the Standard model. This is because Tmax is lower, while theat remains constant. Table 6 shows that this change has no substantial effect on Tdes for the N2 and CO ices, while for CO2 ice, Tdes is lower by 5 K.
A third model that considered changes in the heating timescales is Plateau, where we assumed that the parcel of infalling matter spends time tplat = 10 kyr at Tmax = 150 K. This simple change allowed us to investigate the redistribution of ices when all major volatiles were sublimated from all grain-size bins. This scenario never occurs in Model Standard. The first 10 kyr of Plateau are a copy of the same period in Model Standard. However, when the Tmax plateau starts, H2O ice is depleted below the 1 ML levels already during the first 500 years. The only other major change that occurs during tplat is the destruction of CH3OH in the gas (e.g., Millar et al. 1991). Upon re-freeze, the abundance of CH3OH ice is restored to only 31% of its initial abundance (i.e. Tre,CH3OH is never reached). This decline of methanol is faster than that in the model of Garrod (2013), for example, because the CR ionization rate ζCR in our models is higher and because we used a different gas-phase chemical network.
The re-accumulation of the H2O, NH3, and CO2 ices is more complete than that of CH3 OH in Model Plateau, and similarly to the case of Standard, it exclusively occurs on the large, cold grains, where it reaches final abundances similar to those of Model Standard. The final b0.232 is 362MLs. Figure 3 shows that ice re-accumulation occurs about 2250 yr after the end of the Tmax plateau stage, when Td for the large grains is only 84 K (corresponding to the re-accumulation gas temperature Tre,H2O = 96 K). This Td is significantly below the sublimation temperature of H2O ice (Td ≈ 100 K). The ice accumulation occurs late because hydrogen bonds between ice species and bare-grain surfaces are lacking, similarly to models Dens6 and Dens7 (Sect. 3.2).
3.4 Irradiation
With I we regulated the intensity of ISRF and CRs. The value of I was assumed to be unity for the Standard model, where AV = 10 mag and ζCR = 4.1 × 10¹⁷ s−1 (Ivlev et al. 2015, KKV24). A detailed investigation of changes in radiation for infalling envelope material (see e.g. Drozdovskaya et al. 2014) is beyond the scope of this study. Our aim here was to determine the overall trend for the ice evolution under elevated irradiation. Therefore, highly irradiated conditions were represented with a single model that differed from Standard with I set to 100. This value shows significant chemical effects in the solid and gas phases, but it is not excessively destructive for the 103..104 yr long chemical timescales considered in the simulations. In the case of ISRF, I = 100 was achieved by lowering AV from 10 to 5, while a 100-fold increase in CRs is expected to mimic some effects of energetic particles from the protostar. The same increase was also attributed to CR-induced photons.
Figure 4 and Table 6 show that evolution of the amount of ice and its thickness at the end of the simulation in Model Irrad100 is generally similar, although the underlying chemical processes differ significantly. The abundance of the ice molecules is reduced by three processes: thermal desorption, photodesorption, and ice photoprocessing. The latter results in fragments of photodissociated solid-phase species that combine into new molecules, part of which is desorbed. Thus, the loss of ices in this model can no longer be described as simply ‘sublimation’. Under the strong irradiation, the chemistry of major elements and species changes, as summarised below.
Carbon and oxygen. Initially, CO ice is rapidly destroyed by photoprocesses and is already depleted at 18 K, when CO sublimation does not yet occur. H2O ice and CO gas are combined into CO2 and CH3 OH ices, which both sublimate and are mostly destroyed in the gas. During the cooling stage, only CO2 ice is restored, and at the end time of 20 kyr, the abundance of CO2 has become comparable to that of H2O ice, with n/n(H2) of 1.7 × 10⁻⁴ and 2.4 × 10⁻⁴, respectively.
Organic molecules. The synthesis of CH3OH via hydrogenation of CO becomes ineffective when Td > 24 K because atomic H, produced by H2O photodissociation or adsorbed from the gas-phase, sublimates too rapidly. CH3OH is fully desorbed and then destroyed by the gasphase chemistry, and does not re-form onto grains during the second half of the simulation. The gas-phase chemistry produces hydrocarbons, such as ethane C2H6, and those with desublimation temperatures above 40 K accumulate onto the grain surfaces.
Nitrogen. As N2 sublimates, N is slowly accumulated into the much less volatile NH3 ice (Kalvāns & Kalnin 2019). During the cooling stage and especially towards the end of the simulation, other ice species, such as HCN and HC3N, become abundant, although most N atoms still go into NH3 ice.
During the simulation end phase with constant Tend = 40 K, the ice thickness continues to rise steadily and reaches b0.232 = 356 MLs for the large grains and <25 MLs for other grain-size bins. This continued grain growth occurs because the major gasphase species CO and N2 are constantly directly destroyed by radiation or ions, such as He+, which is produced by CRs. The ionization induced by ISRF is less significant because of molecular (self-) shielding effects. Some of the resulting atoms and atomic ions recombine into less volatile molecules that stick to the grain surfaces, where they continue to increase the ice thickness.
3.5 Grain temperature trend
We adopted a default value of y = −1/6 in the Standard model, that is, small grains with a large total surface area were hotter than large grains. This trend is supported by Draine (2003); Cuppen et al. (2006), and Krügel (2007). The opposite trend (e.g., Heese et al. 2017) with y = 1/6 was considered with Model Tpow1/6. KF24 concluded that the least likely scenario is that all grains have similar temperatures because Td is affected not only by the grain size, but even more so by their material (see Sect. 1 and Woitke et al. 2024).
Figure 4 shows that the main difference in the results of Models Standard and Tpow1/6 is the early and rapid ice sublimation, followed by a late and rapid re-accumulation in Tpow1/6. This is shown quantitatively with the sublimation temperatures in Table 6. All ice is sublimated at 150 K. The first ice layer reappears on the small grains when their Td drops to 81 K (at Tgas = 95 K). Similarly to Models Dens6, Dens7, and Plateau, the ice re-accumulation is delayed by the assumed non-existence of hydrogen bonds on the bare-grain surface. After the first ice ML has formed, the small grain-size bin adsorbs all the hydrogen-bonding less volatile ices within 10 yr.
The accumulation of all the hydrogen-bonded species increases the radius of the a = 0.037 µm grains to a + b = 0.067 µm, which is higher than the second-smallest grain-size bin with a = 0.058 µm. With y > 0 and size growth, the Td of the small grains suddenly rises from 81 to 88 K before it continues to decline, as programmed in the code (Sect. 2.2). The rise delays the accumulation of the next volatile, CO2, which explains why Tre,CO2 = 63 K in Model Tpow1/6 is lower than that for Model Standard, where it is 72 K. (We recall that Tdes and Tre are gas temperatures that are indicative of the assortment for Td of the five grain-size bins.) Similarly to Model Standard, the CO and N2 ices do not re-accumulate in Model Tpow1/6.
While the temperature calculations for grains with different sizes and compositions indicate a significant spread in Td (see Sect. 2.1), we also explored Model Tpow-1/20 with a narrow Td range with y taken to be −1/20, similarly to Models Dens10 and Dens12. These similar grain temperatures may occur when all grains happen to share a similar composition and size. A narrow Td spread reduces the possibilities for a redistribution of the ice mass between the grain-size bins (Sect. 3.2). Figure 4 shows that a full ice removal occurs in Model Tpow-1/20. The Tdes and Tre values are lower than those of Model Standard because of the higher minimum Td for large grains. During the cooling stage, the recovery of H2O, NH3, and CH3OH ices occurs, and the additional delay is induced by the bare-grain surface, which does not participate in hydrogen bonds and thus has lower thermal desorption temperatures for these species (Sect. 3.2).
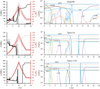 |
Fig. 4 Effects of a 100-fold increase in irradiation with Model Irrad100 (top) and the reverse grain temperature trend with Model Tpow1/6 (bottom) on ice loss and re-accumulation. Left: ice thickness (black lines) changes with Td (red). The thicker lines show larger grains. Right: ice (solid lines) and gas-phase (dotted lines) abundances of the major ice species relative to H2. This is to be compared with Model Standard in Fig. 2. |
3.6 Distribution of the ices on the grains
Interstellar ice may be unevenly distributed among grains, and some grain-size bins may have thicker ice at the expense of others (Iqbal & Wakelam 2018; Silsbee et al. 2021). In order to determine whether this phenomenon affects the distribution of ice among the grain-size bins after a heating-cooling cycle, we considered two models in which all ice was either located on the surface of the smallest 0.037 µm grains (Model Ice_small) or of the largest 0.232 µm grains (Model Ice_large). In terms of the ice distribution, these two models can be viewed as fictional illustrating cases.
Figure 5 shows that the extreme initial distribution of ices on the surface of a single grain-size bin in Models Ice_small and Ice_large does not change the end result, the ice accumulation onto the coldest grains, that we obtained with the other models. The phase transition in Model Ice_large is similar to that in a single-grain model. All ices start, sublimate, and re-adsorb onto the surfaces of the coldest grain-size bin. No appreciable ice layer ever appears on the surface of other grainsize bins, where the ice thickness does not exceed 0.4 MLs at any point in time. The overall evolution of the chemical abundances closely resembles that of Model Standard, except for the lack of the seesaw pattern in the gas phase (Sect. 3.1). Table 6 shows that the Tdes values are higher by a few degrees than those of the Standard model because no previous sublimation from warmer grains was possible in Model Ice_large. After Tmax, all information on previous ice distribution is lost, and Models Standard and Ice_large show very similar results in the cooling stage.
The initial distribution of ices in Model Ice_large resembles the final distribution in Model Standard. Moreover, the final distribution of the ices of Model Ice_large is similar to the initial distribution of this same model. In other words, Model Ice_large can be viewed as the next heating-cooling cycle of a gas parcel after the cycle of Model Standard. This second cycle again results in ice that is exclusively accumulated on the surface of the coldest grain-size bin. This statement excludes the hypervolatile species that do not accumulate because Tend = 40 K prevents their adsorption. Nevertheless, Model Tmax50 indicates that these species re-accumulate in a similar manner, but onto the coldest grains.
Model Ice_small displays a more complex evolution than Ice_large, which nevertheless arrives at the same end result. The hyper-volatile species and CO2 sublimate from the small 0.037 µm and re-freeze onto the surface of the larger, colder grains before they sublimate fully. This is similar to Model Standard, where a major part of the ice also is on the 0.037 µm grains. This process is not repeated for H2O, NH3, and CH3OH because the larger and colder grains have bare, carbonaceous surfaces by the definition of Model Ice_small. This means that ED for these species is significantly lower, and they cannot accumulate. Therefore, full ice sublimation occurs in Model Ice_small already when H2O and the associated ices disappear from the 0.037 µm grains at Tgas = 114 K and T0.037 = 134 K. This results in a delayed re-accumulation of the ices, as discussed in Sect. 3.2. The early desorption and late adsorption, compared to Model Standard, can be seen quantitatively with the Tdes and Tre values in Table 6.
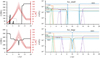 |
Fig. 5 Results of Model Ice_small, where all ice is on the surface of a = 0.037 µm grains (top) and Model Ice_large with ice on the 0.232 µm grains (bottom). Left: ice thickness (black lines) changes with Td (red). The thicker lines show larger grains. Right: ice (solid lines) and gas-phase (dotted lines) abundances of the major ice species relative to H2. This is to be compared with Model Standard in Fig. 2. |
3.7 Summary
The results of Model Standard and of most of the other models show that, first, during the heating period, the molecules that were sublimated from warmer grains re-settle into the coldest grain-size bin before full sublimation occurs. Second, during the cooling period, ice irreversibly and exclusively re-accumulates into the coldest bin. This redistribution of ice into the coldest grain-size bin is valid for gas densities from 107 cm−3, which is characteristic of dense, heated envelopes to 1012 cm−3 in PPD interior. The large 0.232 µm grains have 12% of the entire bare- grain surface area in the model. For the redistribution to occur, the majority of the heated grains must exceed the sublimation temperature of the ice species. The hyper-volatile ices N2 and CO disappear when Td exceeds ≈34 K, and they are likely redistributed for all infall trajectories. For CO2 ice, this temperature is >60 K, while for less volatile ices, such as H2O, it is ≈124K. These Td correspond to the temperature of coldest available grains, which means that Tgas will always be higher.
Under conditions of high irradiation, CO and H2O ices are converted into CO2. Therefore, more of the ice mass can sublimate and re-freeze at medium Td of ≈60 K (up to 73 K in Model Dens12). Irradiation does not change the general pattern of ice redistribution onto the coldest grains. This is also true for models with altered grain-size Td distributions, for instance, for Model Tpow1/6, where the largest grains have the highest Td and Model Tpow-1/20 with a narrow Td distribution. Unlike Model Standard, full ice sublimation occurs in both models, and the redistribution occurs when the infalling parcel of matter cools again.
A final aspect is that the re-freeze of the H2O-like ices occurs at much lower Td in cases of full ice sublimation. This is because the bare-grain surface was assumed to be carbonaceous and does not form hydrogen bonds in our model. Therefore, Tre, which is necessary for re-forming the first full ice ML, is lower by about 30…40 K than Tdes. In a real protostellar envelope, the surfaces of the refractory grains can also consist of silicates or other materials. Along with the Td differences between grain materials (KF24), this means that the grain surface material is another variable that can promote accumulation of ice onto a minority of grains with specific properties.
4 Conclusions
To summarise the results, the selective accumulation of ice onto the surface of the coldest-grain population during a heatingcooling cycle is a strong rule. It cannot be easily changed by variations in the physical or chemical conditions of matter falling onto a PPD from a protostellar envelope. This means that most grains enter the PPD ice poor, while a small minority are ice rich. This uneven ice distribution can affect the grain coagulation, which is more likely and at higher collision speeds, when the grains are covered with an ice layer (Gundlach & Blum 2015; Nietiadi et al. 2017, 2020). As far as we know, the specific case of collisions between ice-covered and bare refractory grains has not yet been investigated. The relative grain velocities can also be significantly affected by their size differences (Ormel et al. 2009; Silsbee et al. 2020), which can be exaggerated or reduced by the selective accumulation of ice.
In prestellar cores, grains grow by accumulating icy mantles (Whittet et al. 2001), while rapid further grain growth by coagulation is observed already in protostellar envelopes (Miotello et al. 2014; Testi et al. 2014). Coagulation is affected by the dual nature of icy and bare grains that are present in the same place and at the same time. Heating events affecting PPDs, such as the event observed by Burns et al. (2023), can also be expected to irreversibly produce dual grain populations (bare and ice rich), which affects the behaviour of grains in the disk, as described by Podolak et al. (2011). The spread-out snowlines in PPDs, predicted by Gavino et al. (2021), likely do not occur, as the ices always sublimate from and freeze out onto the same population of the coldest grains as in Model Ice_large.
The full sublimation of ice and its subsequent reaccumulation will result in fully stratified icy mantles with species of increasing volatility towards the surface. This aspect was not simulated in this model. This ice structure facilitates the rapid sublimation of ice components with no need to diffuse through layers of less volatile ices. Moreover, the segregation into relatively pure ices may hamper the synthesis of some complex molecules, including organics. For example, one route for CH3OH production is by photoprocessing a H2O-CO icy mixture, which cannot be expected to be active in stratified ices.
Acknowledgements
This research is funded by the Latvian Science Council grant “Desorption of icy molecules in the interstellar medium (DIMD)”, project No. lzp-2021/1-0076. I am grateful for the support of Ventspils City Council. This research has made use of NASA’s Astrophysics Data System. I thank the anonymous referee for efforts that significantly improved the paper.
References
- Acharyya, K., Hassel, G. E., & Herbst, E. 2011, ApJ, 732, 73 [NASA ADS] [CrossRef] [Google Scholar]
- Allamandola, L. J., Sandford, S. A., & Valero, G. J. 1988, Icarus, 76, 225 [Google Scholar]
- Aota, T., Inoue, T., & Aikawa, Y. 2015, ApJ, 799, 141 [NASA ADS] [CrossRef] [Google Scholar]
- Armitage, P. J. 2011, ARA&A, 49, 195 [Google Scholar]
- Burns, R. A., Uno, Y., Sakai, N., et al. 2023, Nat. Astron., 7, 557 [CrossRef] [Google Scholar]
- Cassen, P., & Moosman, A. 1981, Icarus, 48, 353 [CrossRef] [Google Scholar]
- Cazaux, S., Tielens, A. G. G. M., Ceccarelli, C., et al. 2003, ApJ, 593, L51 [CrossRef] [Google Scholar]
- Cuppen, H. M., Morata, O., & Herbst, E. 2006, MNRAS, 367, 1757 [Google Scholar]
- Draine, B. T. 2003, ARA&A, 41, 241 [NASA ADS] [CrossRef] [Google Scholar]
- Drozdovskaya, M. N., Walsh, C., Visser, R., Harsono, D., & van Dishoeck, E. F. 2014, MNRAS, 445, 913 [NASA ADS] [CrossRef] [Google Scholar]
- Furuya, K., Drozdovskaya, M. N., Visser, R., et al. 2017, A&A, 599, A40 [NASA ADS] [CrossRef] [EDP Sciences] [Google Scholar]
- Garrod, R. T. 2013, ApJ, 765, 60 [Google Scholar]
- Garrod, R. T., Weaver, S. L. W., & Herbst, E. 2008, ApJ, 682, 283 [NASA ADS] [CrossRef] [Google Scholar]
- Gavino, S., Dutrey, A., Wakelam, V., et al. 2021, A&A, 654, A65 [NASA ADS] [CrossRef] [EDP Sciences] [Google Scholar]
- Gundlach, B., & Blum, J. 2015, ApJ, 798, 34 [Google Scholar]
- Hagen, W., Allamandola, L. J., & Greenberg, J. M. 1979, Ap&SS, 65, 215 [NASA ADS] [CrossRef] [Google Scholar]
- Heese, S., Wolf, S., Dutrey, A., & Guilloteau, S. 2017, A&A, 604, A5 [NASA ADS] [CrossRef] [EDP Sciences] [Google Scholar]
- Iqbal, W., & Wakelam, V. 2018, A&A, 615, A20 [NASA ADS] [CrossRef] [EDP Sciences] [Google Scholar]
- Ivlev, A. V., Padovani, M., Galli, D., & Caselli, P. 2015, ApJ, 812, 135 [Google Scholar]
- Jørgensen, J. K., Belloche, A., & Garrod, R. T. 2020, ARA&A, 58, 727 [Google Scholar]
- Kalvans, J. 2015, ApJ, 803, 52 [CrossRef] [Google Scholar]
- Kalvans, J. & Freimanis, J. 2024, A&A, 692, A261 [NASA ADS] [CrossRef] [EDP Sciences] [Google Scholar]
- Kalvans, J., & Kalnin, J. R. 2019, MNRAS, 486, 2050 [CrossRef] [Google Scholar]
- Kalvans, J., Kalnin, a, A., & Veitners, K. 2024, A&A, 687, A296 [NASA ADS] [CrossRef] [EDP Sciences] [Google Scholar]
- Krügel, E. 2007, An Introduction to the Physics of Interstellar Dust (Taylor & Francis, CRC Press) [CrossRef] [Google Scholar]
- Li, A., & Draine, B. T. 2001, ApJ, 554, 778 [Google Scholar]
- Li, A., & Mann, I. 2012, in Astrophysics and Space Science Library, 385, Nanodust in the Solar System: Discoveries and Interpretations, eds. G. Matloff, C. Bangs, & L. Johnson, 5 [NASA ADS] [CrossRef] [Google Scholar]
- McElroy, D., Walsh, C., Markwick, A. J., et al. 2013, A&A, 550, A36 [NASA ADS] [CrossRef] [EDP Sciences] [Google Scholar]
- Millar, T. J., Herbst, E., & Charnley, S. B. 1991, ApJ, 369, 147 [Google Scholar]
- Miotello, A., Testi, L., Lodato, G., et al. 2014, A&A, 567, A32 [NASA ADS] [CrossRef] [EDP Sciences] [Google Scholar]
- Molyarova, T., Akimkin, V., Semenov, D., et al. 2018, ApJ, 866, 46 [NASA ADS] [CrossRef] [Google Scholar]
- Nietiadi, M. L., Umstätter, P., Alabd Alhafez, I., et al. 2017, Geophys. Res. Lett., 44, 10 822 [NASA ADS] [CrossRef] [Google Scholar]
- Nietiadi, M. L., Rosandi, Y., & Urbassek, H. M. 2020, Nanoscale Res. Lett., 15, 67 [NASA ADS] [CrossRef] [Google Scholar]
- Ormel, C. W., Paszun, D., Dominik, C., & Tielens, A. G. G. M. 2009, A&A, 502, 845 [NASA ADS] [CrossRef] [EDP Sciences] [Google Scholar]
- Pauly, T., & Garrod, R. T. 2016, ApJ, 817, 146 [Google Scholar]
- Podolak, M., Mayer, L., & Quinn, T. 2011, ApJ, 734, 56 [NASA ADS] [CrossRef] [Google Scholar]
- Quirico, E., Moroz, L. V., Schmitt, B., et al. 2016, Icarus, 272, 32 [CrossRef] [Google Scholar]
- Rawlings, J. M. C., & Williams, D. A. 2021, MNRAS, 500, 5117 [Google Scholar]
- Sakai, N., Sakai, T., Hirota, T., & Yamamoto, S. 2008, ApJ, 672, 371 [Google Scholar]
- Sakai, N., Sakai, T., Hirota, T., et al. 2014, Nature, 507, 78 [Google Scholar]
- Silsbee, K., Ivlev, A. V., Sipilä, O., Caselli, P., & Zhao, B. 2020, A&A, 641, A39 [NASA ADS] [CrossRef] [EDP Sciences] [Google Scholar]
- Silsbee, K., Caselli, P., & Ivlev, A. V. 2021, MNRAS, 507, 6205 [NASA ADS] [CrossRef] [Google Scholar]
- Sipilä, O., Zhao, B., & Caselli, P. 2020, A&A, 640, A94 [NASA ADS] [CrossRef] [EDP Sciences] [Google Scholar]
- Tafalla, M. 2018, Publ. Korean Astron. Soc., 33, 45 [Google Scholar]
- Testi, L., Birnstiel, T., Ricci, L., et al. 2014, in Protostars and Planets VI, eds. H. Beuther, R. S. Klessen, C. P. Dullemond, & T. Henning, 339 [Google Scholar]
- Visser, R., van Dishoeck, E. F., Doty, S. D., & Dullemond, C. P. 2009, A&A, 495, 881 [NASA ADS] [CrossRef] [EDP Sciences] [Google Scholar]
- Visser, R., Doty, S. D., & van Dishoeck, E. F. 2011, A&A, 534, A132 [NASA ADS] [CrossRef] [EDP Sciences] [Google Scholar]
- Whittet, D. C. B., Gerakines, P. A., Hough, J. H., & Shenoy, S. S. 2001, ApJ, 547, 872 [Google Scholar]
- Woitke, P., Dra?z? kowska, J., Lammer, H., Kadam, K., & Marigo, P. 2024, A&A, 687, A65 [NASA ADS] [CrossRef] [EDP Sciences] [Google Scholar]
All Tables
Investigation models and their changed parameters relative to the Standard model.
Gas temperatures for an ice loss of 50% relative to the initial abundances (Tdes (K)) during the heating stage and a re-adsorption of 50% (Tre (K)) during the cooling stage for six major ice species.
All Figures
|
Fig. 1 Evolution of n/n(H2) for the major ice molecules on the surfaces of the five grain-size bins in the Standard model. The thicker lines show larger grains. |
| In the text | |
|
Fig. 2 Effects of nH on the ice sublimation and re-freeze with Models Dens6, Dens7, Standard, Dens10, and Dens12 from top to bottom. Left: ice thickness (black lines) changes with Td (red lines in the background). The thicker lines show larger grains. Right: n/n(H2) for ice (solid lines) and gas-phase (dotted lines) species. |
| In the text | |
|
Fig. 3 Effects of changes related to Tmax on the ice sublimation and re-freeze with models Tmax50 (top) and Tmax100 (middle) with Tmax 50 and 100 K, respectively. The bottom plots show the results from Model Plateau with tplat = 10 kyr. Left: ice thickness (black lines) and grain temperature (red; the thicker lines show larger grains). Right: n/n(H2) of major species in gas (dotted) and ice (solid lines). This is to be compared with Model Standard in Fig. 2, where Tmax = 150 K and tplat = 0. The scale changes for the secondary y-axis (Td) in the left plots. |
| In the text | |
|
Fig. 4 Effects of a 100-fold increase in irradiation with Model Irrad100 (top) and the reverse grain temperature trend with Model Tpow1/6 (bottom) on ice loss and re-accumulation. Left: ice thickness (black lines) changes with Td (red). The thicker lines show larger grains. Right: ice (solid lines) and gas-phase (dotted lines) abundances of the major ice species relative to H2. This is to be compared with Model Standard in Fig. 2. |
| In the text | |
|
Fig. 5 Results of Model Ice_small, where all ice is on the surface of a = 0.037 µm grains (top) and Model Ice_large with ice on the 0.232 µm grains (bottom). Left: ice thickness (black lines) changes with Td (red). The thicker lines show larger grains. Right: ice (solid lines) and gas-phase (dotted lines) abundances of the major ice species relative to H2. This is to be compared with Model Standard in Fig. 2. |
| In the text | |
Current usage metrics show cumulative count of Article Views (full-text article views including HTML views, PDF and ePub downloads, according to the available data) and Abstracts Views on Vision4Press platform.
Data correspond to usage on the plateform after 2015. The current usage metrics is available 48-96 hours after online publication and is updated daily on week days.
Initial download of the metrics may take a while.