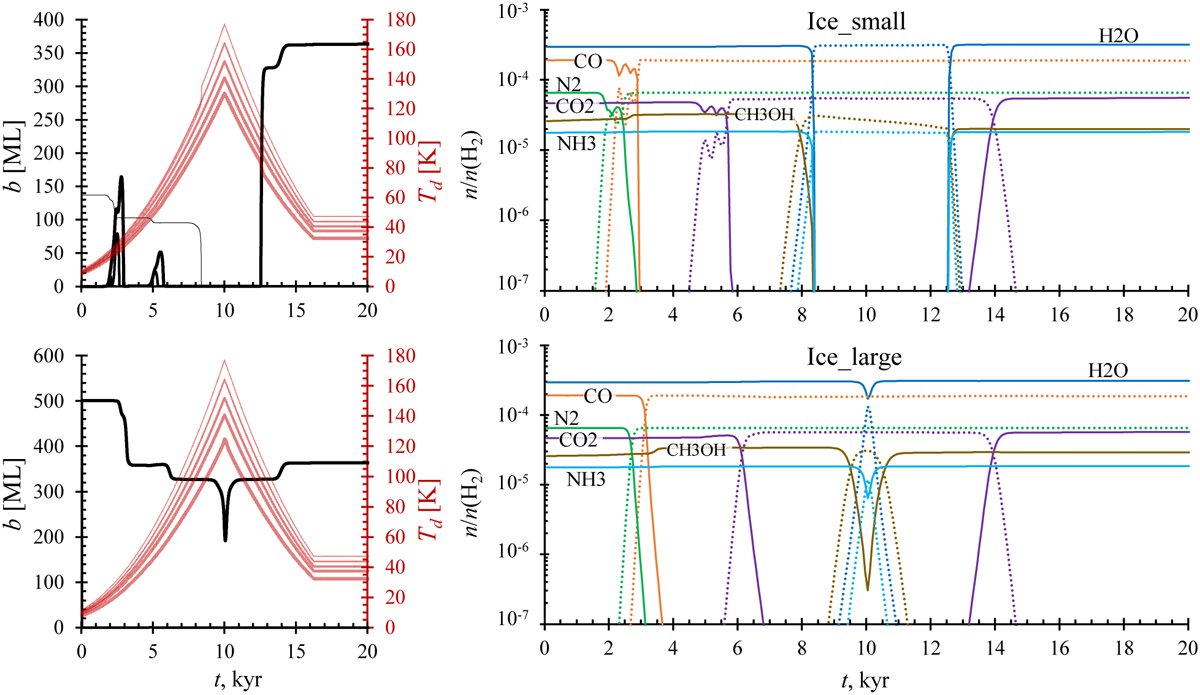
Fig. 5
Download original image
Results of Model Ice_small, where all ice is on the surface of a = 0.037 µm grains (top) and Model Ice_large with ice on the 0.232 µm grains (bottom). Left: ice thickness (black lines) changes with Td (red). The thicker lines show larger grains. Right: ice (solid lines) and gas-phase (dotted lines) abundances of the major ice species relative to H2. This is to be compared with Model Standard in Fig. 2.
Current usage metrics show cumulative count of Article Views (full-text article views including HTML views, PDF and ePub downloads, according to the available data) and Abstracts Views on Vision4Press platform.
Data correspond to usage on the plateform after 2015. The current usage metrics is available 48-96 hours after online publication and is updated daily on week days.
Initial download of the metrics may take a while.