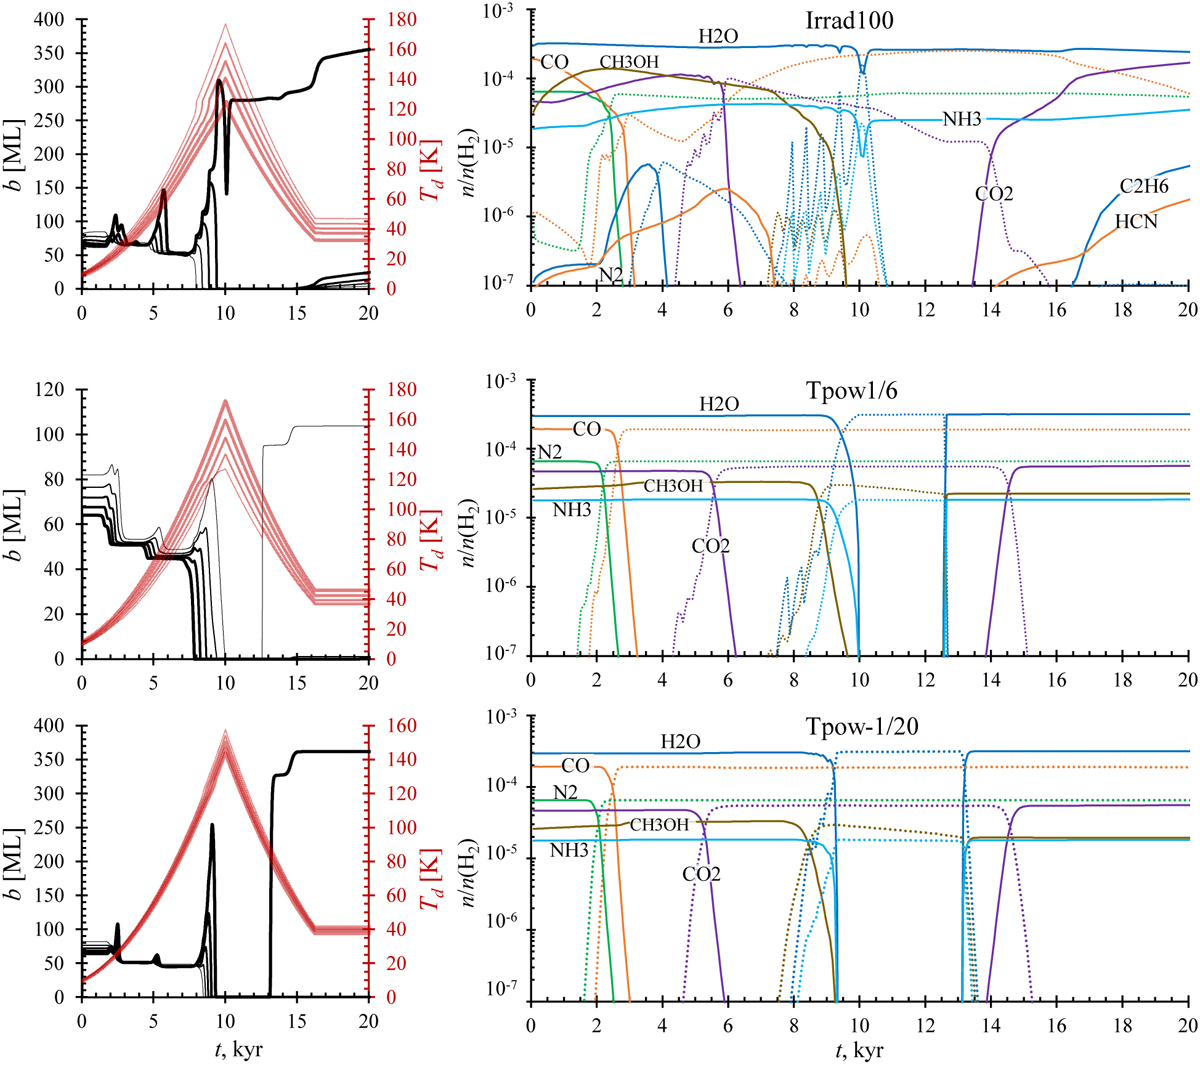
Fig. 4
Download original image
Effects of a 100-fold increase in irradiation with Model Irrad100 (top) and the reverse grain temperature trend with Model Tpow1/6 (bottom) on ice loss and re-accumulation. Left: ice thickness (black lines) changes with Td (red). The thicker lines show larger grains. Right: ice (solid lines) and gas-phase (dotted lines) abundances of the major ice species relative to H2. This is to be compared with Model Standard in Fig. 2.
Current usage metrics show cumulative count of Article Views (full-text article views including HTML views, PDF and ePub downloads, according to the available data) and Abstracts Views on Vision4Press platform.
Data correspond to usage on the plateform after 2015. The current usage metrics is available 48-96 hours after online publication and is updated daily on week days.
Initial download of the metrics may take a while.