| Issue |
A&A
Volume 694, February 2025
|
|
|---|---|---|
| Article Number | A81 | |
| Number of page(s) | 14 | |
| Section | Planets, planetary systems, and small bodies | |
| DOI | https://doi.org/10.1051/0004-6361/202452521 | |
| Published online | 04 February 2025 | |
Methane precipitation in ice giant atmospheres
1
Instituto Nacional de Técnica Aeroespacial (INTA),
Madrid,
Spain
2
GSMA, UMR 7331-GSMA, Université de Reims Champagne-Ardenne,
51687
Reims,
France
3
Department of Physics, University of Oxford,
Parks Rd,
Oxford
OX1 3PU,
UK
4
University of Leicester,
Leicester,
UK
★ Corresponding author; This email address is being protected from spambots. You need JavaScript enabled to view it.
Received:
7
October
2024
Accepted:
12
December
2024
Abstract
Context. Voyager-2 radio occultation measurements have revealed changes in the atmospheric refractivity within a 2–4 km layer near the 1.2-bar level in Uranus and the 1.6-bar level in Neptune. These changes were attributed to the presence of a methane cloud, consistent with the observation that methane concentration decreases with altitude above these levels, closely following the saturation vapor pressure. However, no clear spectral signatures of such a cloud have been detected thus far in the spectra acquired from both planets.
Aims. We examine methane cloud properties in the atmospheres of the ice giants, including vertical ice distribution, droplet radius, precipitation rates, timescales, and total opacity, employing microphysical simulations under different scenarios.
Methods. We used a one-dimensional (1D) cloud microphysical model to simulate the formation of methane clouds in the ice giants. The simulations include the processes of nucleation, condensation, coagulation, evaporation, and precipitation, with vertical mixing simulated using an eddy-diffusion profile (Keddy).
Results. Our simulations show cloud bases close to 1.24 bars in Uranus and 1.64 bars in Neptune, with droplets up to 100 µm causing high settling velocities and precipitation rates (∼370 mm per Earth year). The high settling velocities limit the total cloud opacity, yielding values at 0.8 µm of ∼0.19 for Uranus and ∼0.35 for Neptune, using Keddy = 0.5 m2 s−1 and a deep methane mole fraction (μCH4) of 0.04. In addition, lower Keddy or μCH4 values result in smaller opacities. Methane supersaturation is promptly removed by condensation, controlling the decline in μCH4 with altitude in the troposphere. However, the high settling velocities prevent the formation of a permanent thick cloud. Stratospheric hazes made of ethane or acetylene ice are expected to evaporate completely before reaching the methane condensation level. Since hazes are required for methane heterogeneous nucleation, this suggests either a change in the solid phase properties of the haze particles, inhibiting evaporation, or the presence of photochemical hazes.
Key words: planets and satellites: atmospheres
© The Authors 2025
 Open Access article, published by EDP Sciences, under the terms of the Creative Commons Attribution License (https://creativecommons.org/licenses/by/4.0), which permits unrestricted use, distribution, and reproduction in any medium, provided the original work is properly cited.
This article is published in open access under the Subscribe to Open model. This email address is being protected from spambots. You need JavaScript enabled to view it. to support open access publication.
1 Introduction
Voyager-2 radio occultation measurements of Uranus and Neptune have revealed a layer approximately 2–4 km thick, close to 1.2 and 1.6 bars, respectively, wherein the atmospheric refractivity has exhibited a slope variation (Lindal et al. 1987; Lindal 1992). These findings were interpreted to indicate that this is a region where methane gas had been undergoing condensation, forming an ice cloud centered around those pressure levels. While the formation of this putative cloud would explain the observed decrease in methane abundance at heights above ∼1.2 and ∼1.6 bars (abundances close to saturation) or the banded structure of Uranus through latitudinal variations in the opacity of this cloud, observations have not provided any direct evidence in favor of this cloud. Specifically, (i) radiative transfer models show an enhancement in the scattering opacity at pressures ∼2–6 bars, which, in principle, is more consistent with the presence of H2S ice (Irwin et al. 2018, 2019b); (ii) observations from ground-based telescopes (or from telescopes in orbit around the Earth) of discrete methane clouds indicate cloud tops near 0.4 bars or higher in both planets (Karkoschka 1998; Karkoschka & Tomasko 2009, 2011; Irwin et al. 2016, 2017), approximately a scale height above the base of the putative methane cloud.
For a complete review of the cloud activity and meteorology at cloud levels observed in both planets, we refer to Hueso & Sánchez-Lavega (2019); Sánchez-Lavega et al. (2023).
One possible explanation for the absence of observations of such a cloud is based on the expected high precipitation rates associated with a cloud formed close to 1 bar. Indeed, Carlson et al. (1988) estimated the microphysical time constants of condensation, coagulation, coalescence, and sedimentation. These authors found that on Uranus, methane cloud droplets can get sizes through condensation of up to ∼5 mm in as little as ∼100 s. Such big droplets would have high settling velocities, limiting the lifetime of the cloud. Similarly, the inhibition of convection expected at those pressures due to the difference in molecular weight between CH4 and the dry components H2 and He (Guillot 1995; Leconte et al. 2017; Irwin et al. 2022) may also limit the vertical extent of the cloud and, consequently, its total opacity.
Recently, Ge et al. (2024) conducted an analytical analysis of the heat transport and continuity equations, showing that moist convection is partly constrained by the planetary heat flux. In particular, they found that the upper limit of cloud density is determined by the planetary heat flux and that weather layer mixing is less efficient than expected. In summary, all these studies suggest various potential reasons for the low methane cloud activity observed in both planets, particularly in Uranus. However, due to the lack of a dedicated mission to these planets, their complex circulation patterns (Fletcher et al. 2020), and the absence of global circulation simulations including microphysics, it is difficult to determine the extent to which these different factors control cloud activity. The main goal of this work is to study the formation and properties of methane clouds using microphysical simulations, which (to our knowledge) are being applied for the first time to the atmospheres of the ice giants. With these simulations, we aim to investigate potential reasons for the decrease in methane abundance above the ~1 bar level and the lack of clear cloud features near that level in the spectra of these planets.
The paper is organized as follows. First, in Section 2, we briefly describe the microphysical model we used for the simulation of methane clouds. In Section 3, we present a number of simulations carried out for Uranus and Neptune atmospheres, as well as sensitivity analyses to study the impact of different model parameters on the properties of the methane clouds, such as opacity and altitude. In Section 4, we discuss the nature of the tropospheric cloud condensation nuclei (CCNs). In Section 5, we compare the cloud microphysical simulations with aerosol models derived from the radiative transfer analysis of observed reflectivity spectra of both planets. Finally, in Section 6, we compare the main methane cloud properties in the ice giants with those of Titan, the other body in our Solar System where such clouds are present. We conclude our paper with a point-by-point list of the main results obtained.
2 Microphysical model
The cloud simulations were conducted employing a onedimensional (1D) microphysical model originally developed for Titan (Cabane et al. 1992; Rannou et al. 2006) and Mars (Montmessin et al. 2002, 2004). As the model has been previously described, a brief description is given here. The model incorporates the processes of nucleation, condensation, coagulation, evaporation, and precipitation. The vertical transport of CH4 gas is parameterized using an eddy-diffusion profile (Keddy), which governs the gas supply for cloud nucleation and particle growth. As Keddy is poorly constrained, various profiles were tested in our simulations. Our baseline profile maintains a constant value of Keddy for pressures greater than 0.4 bars. Above this level, Keddy increases inversely with density towards the atmospheric top. Since this work is focused on the altitudes where methane is expected to condense, the atmospheric top is set at p=0.1 bar. From an analytical analysis, Ge et al. (2024) estimated an upper limit of Keddy as:
 (1)
(1)
where  is the planet’s emission flux, H is the scale height and the e-folding length scale of condensing species, ρ is the atmospheric density, ∆Hυ is the methane latent heat, and
  is the saturation methane mixing ratio (also referred to as mole fraction in this work). Ge et al. (2024) estimated an upper value of ~2 m2 s−1 at the pressures where methane is expected to condense and for
  , which is the value expected for Neptune’s atmosphere. Considering that
  is smaller by a factor of 10 in Uranus, we tested values of Keddy (p ≥ 0.4 bars) between 0.1 and 2 m2 s−1 in our simulations, and the impact of this parameter on the results will be discussed below. It is important to note that these Keddy profiles do not account for the mass-loading effect caused by the difference in molecular weight between CH4 and the dry components H2 and He. As demonstrated by Guillot (1995); Leconte et al. (2017); Irwin et al. (2022), the greater molecular weight of CH4 compared to H2 and He is expected to inhibit convection in the atmospheres of Uranus and Neptune. This implies a reduction in vertical mixing and, consequently, a decrease in the vertical extension of the cloud. The impact of the mass-loading effect on the cloud simulations and results is discussed below.
In the simulations, heterogeneous nucleation is assumed, with haze particles acting as CCNs. The initial haze profiles (number density and size distribution) are taken from the results reported in Toledo et al. (2019, 2020). The pressure, temperature, and gas profiles utilized in our simulations were derived from the analysis of Voyager-2 occultation measurements (Lindal et al. 1987; Lindal 1992; Sromovsky et al. 2011) (see Fig. A.1). The values or equations of the parameters necessary to compute the nucleation rates, settling velocities, and the condensation or evaporations rates are summarized in Table 1 (see e.g., Pruppacher et al. (1998); Montmessin et al. (2002); Barth & Toon (2003) for more information about the microphysics model equations). The model is run until it reaches a steady state, which occurs when there is an equilibrium between the vertical methane fluxes due to diffusion and precipitation.
3 Model results and sensitivity tests
3.1 Simulations of methane clouds in the atmospheres of the ice giants
Figures 1 and 2 display vertical profiles of methane ice concentration and opacity, mean cloud particle radius, and precipitation rates derived from the cloud microphysical model (referred to as CMM hereafter) for the atmospheres of Uranus and Neptune. In these simulations we set Keddy(p ≥ 0.4 bars) = 0.5 m2 s−1 . The model reaches a steady state after several terrestrial days and places the cloud base at approximately 1.24 bars on Uranus and approximately 1.62 bars on Neptune, very close to the pressures where changes in atmospheric refractivity were reported from Voyager-2 data (Lindal et al. 1987; Lindal 1992). However, as we explain in Section 5.2, the cloud base pressure depends on the assumed deep methane abundance. The total opacity of the methane cloud is below 1 at 0.8 µm in both planets, with higher opacities per km found near the respective cloud bases where the pressure and methane mole fraction (hereafter referred to as mixing ratio) are greater. Likewise, at cloud base, we observe the maximum size of cloud droplets, with mean radii of approximately 100 µm for both planets. The greater cloud total opacity for Neptune simulations is attributed to the altitude of the cloud base; despite a similar deep methane mixing ratio of 0.04 assumed in the simulations, the colder temperatures on Neptune result in cloud condensation occurring at greater pressures, where the methane abundance, expressed in kg m−3, is greater. However, despite this greater abundance, the mean cloud radius in both planets is similar because the haze concentration in Neptune is higher. Indeed, as we will see in Section 5.1, the concentration of haze particles (or CCNs) influences the average particle radius of the cloud (the greater the number of haze particles, the smaller the mean particle radius).
The large cloud droplets result in high precipitation rates. Near the cloud base, we obtain vertical fluxes of methane ice for Uranus due to precipitation of about 5 × 10⁻⁶ kg m−2 s−1, which is equivalent to 370 mm per Earth year (precipitation×time×1/ρs). As we will see below, this is of the same order as the values derived for the methane clouds on Titan. Below the cloud base, methane droplets evaporate in subsaturated layers. For example, in Uranus’s atmosphere, methane saturation is below 1 at pressures greater than ~1.17 bar, and methane droplets are completely evaporated at pressures greater than ~ 1.3 bar. This corresponds to distances of about 3 km or less traveled by the droplets below the cloud base. Once evaporated, the methane gas is resupplied by the eddy mixing to the altitudes where cloud nucleation takes place. Colormaps of cloud opacity derived from the CMM show that, instead of a periodic cloud, the simulations reveal an optically thin cloud deck whose opacity varies slightly over timescales of days (see Fig. B.1). This is a consequence of the short vertical distance over which methane droplets evaporate below the cloud base and the timescales required for the resupply of methane to the cloud through eddy mixing. Indeed, if the methane droplets were evaporated at deeper pressures, then the resupply of methane gas might take several days, resulting in a periodic cloud similar to the ethane clouds simulated in Barth & Toon (2003) for Titan’s atmosphere.
Similarly, the large cloud droplets result in high settling velocities that prevent the cloud from reaching high opacities (>1) and to simultaneously maintain methane abundance at levels no higher than the saturation. Figure 3 shows a comparison between the CH4 profile derived from the Voyager-2 data and the profiles simulated with CMM, both with (panel a) and without (panel b) methane condensation. In both cases, we started the model with the methane profiles shown in Fig. A.1. Here, we see that the 1D microphysical simulations reproduce the Voyager- 2 methane profile reasonably well, indicating that condensation is one of the main factors controlling the methane abundance in the troposphere. Indeed, if no condensation is included, the methane saturation can reach values close to 2 after 300 days for Keddy(p ≥ 0.4 bars)= 0.5 m2 s−1 (see Fig. 3c). For larger values of Keddy(p ≥ 0.4 bars), the saturation can reach higher values over the same period.
Finally, the simulations also indicate a vertical transport of haze particles as a result of the high droplet settling velocities.
Methane condenses rapidly onto the haze particles and once the droplets reach a certain size, they precipitate, transporting the haze from the region where nucleation occurs to lower altitudes. Fig. 4 shows the variation of haze concentration with time for the CMM simulations discussed in Fig. 1 for the Uranus atmosphere. The simulations show an accumulation of haze particles at pressures greater than approximately 1.15 bar and a haze removal at higher altitudes where methane nucleation takes place. As time progresses in the simulations, the accumulation of haze particles below the cloud base increases and extends to greater pressures in both planets. Similar results were derived for Neptune. However, because methane condensation occurs at greater pressures, the layer where haze particles accumulate is also found at greater pressures.
Microphysical model parameters.
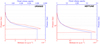 |
Fig. 1 Vertical profiles of methane ice concentration (g m−3) and cloud column opacity at 0.8 µm in the atmospheres of Uranus and Neptune simulated with the microphysical model for Keddy(p ≥ 0.4 bars)= 0.5 m2 s−1 and a deep methane ratio of 0.04. |
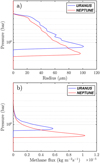 |
Fig. 2 Vertical profiles of the mean cloud particle radius (left panel) and precipitation rate (right panel) in the atmospheres of Uranus and Neptune, simulated with the microphysical model for Keddy(p ≥ 0.4 bars) = 0.5 m2 s−1 and a deep methane ratio of 0.04. |
3.2 Sensitivity to Keddy
Despites the high concentration of methane on both planets, the microphysical simulations indicate low cloud opacities for Keddy = 0.5 m2 s−1. As indicated above, Keddy controls the resupply of methane gas to the cloud in the model and, thus, variations in this parameter are expected to change the main properties of the cloud. Fig. 5 shows the impact of increasing Keddy from 0.5 to 2 m2 s−1. In general, we see that an increase in Keddy results in a proportional increase in the total cloud opacity. Similarly, we found in these simulations greater particle radii and precipitation rates by increasing Keddy. Likewise, a decrease in Keddy relative to our baseline profile leads to a proportional decrease in cloud opacity. Therefore, these simulations show that the total opacity of the clouds is significantly constrained by Keddy. It is only when this parameter reaches values greater than ~2 m2 s−1 that a thick cloud layer is produced.
Earlier in this paper, in our discussion of the microphysical model, we note that the Keddy profile used in our simulations does not take into the account the inhibition of convection due to the mass-loading effect. Indeed, the lapse rate can be significantly affected by the sudden decrease in molecular weight as air passes through a condensation cloud, resulting in superadiabatic profiles that inhibit convection (Guillot 1995; Leconte et al. 2017). Additionally, Irwin et al. (2022) computed the Brünt-Väisälä frequency, accounting for the vertical changes in the molecular weight and found a region of static stability below the 1-bar level. As a reduction in Keddy leads to a decrease in the vertical mixing, the region of static stability can be represented in our model simulations by decreasing this parameter at pressures >~1 bar.
Figure 6 shows the cloud profiles derived from the microphysical simulations when Keddy is decreased by a factor of 10 at p>1 bar. The model is run with Keddy(p ≥ 0.4 bars) = 1 m2 s−1, and once the steady state is reached, the decrease in Keddy is applied in the simulations. After 10 hours and 10 days of the decrease in Keddy , the methane ice opacity decreases by approximately 10 and 25%, respectively. After about 60 days of the Keddy decrease, the model reaches a new steady state, and the cloud opacity decreases by about 40% compared to the case with Keddy(p ≥ 0.4 bars) = 1 m2 s−1. These results indicate that the presence of a region of static stability is expected to cause a decrease in methane ice opacity. Moreover, simulations similar to those shown in Fig. 6 indicate that if the Keddy decrease occurs at a pressure lower than the p=1 bar used in the profile of Fig. 6, the reduction in cloud opacity is even greater. In Section 6, we show that when the decrease in Keddy is applied at all pressure levels, the cloud opacity can decrease by more than 80% within 1–2 hours. This is a direct consequence of the high droplet settling velocities. These results show that cloud properties respond very rapidly to variations in Keddy and that the formation of statically stable regions resulting from methane condensation is expected to affect cloud properties on timescales of several days at most. However, future works should aim to constrain Keddy in these particular cases or to couple dynamics modeling with microphysics.
We also tested the impact of stratified Keddy profiles on the cloud properties in our microphysical simulations. Using nonhydrostatic cloud-resolving simulations and assuming different CH4 abundances, Ge et al. (2024) and Clément et al. (2024) estimated various Keddy vertical profiles. These profiles revealed a stable layer, defined as the region in the troposphere, where Keddy decreases with altitude, located at altitudes below the 1-bar level. We conducted microphysical simulations similar to those shown in Fig. 1, but using the Keddy profiles derived in Ge et al. (2024) and Clément et al. (2024) for a CH4 abundance of 50×Solar. Hereafter, we refer to these microphysical simulations as GE2024 and CLEMENT2024 simulations. For consistency with those works, we used a  of 50×Solar in these new simulations, whose results are displayed in Fig. 7. Here, we see that the presence of a stable layer, as simulated using the GE2024 and CLEMENT2024 Keddy profiles, significantly limits the CH4 ice concentration. It is only at pressures where the GE2024 and CLEMENT2024 Keddy profiles approach values close to 0.5 m2 s−1 that the CH4 ice concentrations become similar across the three cases (displayed in Fig. 7). The resulting total opacities are approximately ~0.06, which is about three times smaller than the result obtained for a constant Keddy = 0.5 m2 s−1. In Fig. 7, we also observe that employing the GE2024 Keddy profile results in the formation of a detached cloud around 0.2 bar. This layer is caused by an increase in Keddy at those pressures, with values reaching ~40 m2 s−1 near 0.16 bar (see Ge et al. 2024). Thus, these simulations indicate that stratified Keddy profiles are expected to impact not only the total opacity of the methane clouds, but also its vertical structure.
Comparing the results in Fig. 7 with the cloud concentrations estimated in Ge et al. (2024) for 50×Solar, we observe some differences in the cloud densities. While the cloud base obtained from the GE2024 simulations is located at pressures similar to those found in Ge et al. (2024), the concentration at those pressures differs by approximately a factor of 10. These differences may arise because our model is 1D, with the dynamics simplified using a Keddy profile; alternatively, this could be due to the fact that the cloud microphysics in Ge et al. (2024) is approximated using a Kessler-type approach (Li & Chen 2019). Still, it is interesting to note that, similarly to the simulations in Fig. 7, the cloud profile in Ge et al. (2024) also shows the presence of a detached cloud layer at pressures between 0.2 and 0.1 bar.
Finally, it is important to note that while moist convection could be inhibited at the cloud condensation level due to the mass-loading effect, there are other mechanisms, such as gravity waves, which may still facilitate the vertical transport of methane. This would thereby provide a source of moisture for the formation of vertically extended clouds.
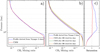 |
Fig. 3 Methane mixing ratio profiles derived from the microphysical model for Uranus atmosphere when methane condensation is included (a) and excluded (b) in the simulations. In all the simulations, we set Keddy(p ≥ 0.4 bars) = 0.5 m2 s−1. For comparison purposes, the profile derived from Voyager 2 data is also displayed. If condensation is not included in the simulations, high supersaturations occur in the troposphere, as shown in panel c, where the red line represents saturation when condensation is included in the simulations. The blue curve represents saturation when condensation is not included in the simulations. |
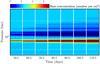 |
Fig. 4 Variation in the haze concentration with time derived from the cloud microphysics simulations for Uranus atmosphere (Keddy (p ≥ 0.4 bars)= 0.5 m2 s−1). Each panel, delimited by vertical thick white lines, represents a 1-day block. The white dashed lines indicate the 0.4, 1, and 2-bar levels. |
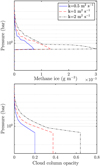 |
Fig. 5 Variation of the methane ice concentration and cloud total opacity when Keddy(p ≥ 0.4 bars) is increased from 0.5 to 2 m2 s−1. These simulations are employed for Uranus atmosphere. |
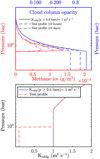 |
Fig. 6 Cloud concentration and total opacity (upper panel) in Uranus atmosphere derived from the microphysical model when Keddy is decreased by a factor of 10 at pressures greater than 1 bar (lower panel). The decrease in Keddy is applied to the steady-state simulations for Keddy (p ≥ 0.4 bars) = 1 m2 s−1 (solid lines in the upper panel). The cloud profiles after 10 hours and 10 days of this decrease are represented by the dashed and dotted lines in the upper panel. |
4 Origin of the tropospheric CCNs
For the simulations discussed in Section 3.1, we employed the haze profiles derived in Toledo et al. (2019, 2020), where haze particles act as CCNs for cloud nucleation. These profiles are computed based on the following assumptions: (i) haze formation initially occurs in the stratosphere through the condensation of hydrocarbons such as ethane, acetylene, and diacetylene (Pollack et al. 1987; Moses et al. 1992). The formation of these hydrocarbons results from a network of chemical reactions that starts with the dissociation of methane by solar ultraviolet (UV) radiation and energetic particles; (ii) haze particles reach the methane condensation level (MCL) before undergoing complete evaporation. Although photochemical simulations have shown that the abundances of these hydrocarbons in the high stratosphere may be high enough to lead to condensation and thus form ice stratospheric hazes, it remains uncertain whether these haze particles can reach the MCL before evaporating. To investigate this hypothesis, we analytically integrated the equations of condensational growth (Pruppacher & Klett 1980) and settling velocity (given by the Stokes relationship, corrected by the Cunningham slip-flow factor) for a single droplet with different initial radii:
 (2)
(2)
 (3)
(3)
where Fd and Fh are the molecular and heat diffusion terms, S is the saturation ratio, Seq is the Kelvin correction to account for the effects of particle curvature on the vapor pressure, g is the gravity, ηa is the dynamic viscosity of air, and Kn is the Knudsen number.
Figure 8 illustrates the variation in radius with pressure for a single droplet made of ethane and acetylene ice falling from the 0.1-bar level in Uranus’ atmosphere under different initial radii (r=0.2, 0.4 and 0.6 µm) and saturation conditions for these respective gases (S=0.4, 0.6 and 0.8). In these calculations, we assume that the only forces acting on the particle are gravity and drag. In all the cases, we see that haze particle evaporates before reaching the 1.2-bar level. While it is true that the actual saturation conditions for these hydrocarbons likely differ from those used in Fig. 8, these results indicate that under subsaturated tropospheric conditions, the haze particles are expected to evaporate well above the MCL This result is somehow expected considering the long distance that these particles have to travel from the top of the troposphere to the 1.2-bar level (∼60 km).
In these calculations, we did not include diacetylene due to the lack, as far as we know, of its density values in ice in the literature. If the evaporation rates of diacetylene were such that it could reach the MCL before complete evaporation, one possibility is that diacetylene condenses onto the pre-existing stratospheric ices made of ethane and acetylene to form mixed haze particles. In this scenario, the outer layer of diacetylene ice on the haze particles would prevent their evaporation before reaching the MCL. However, according to Pollack et al. (198 Moses et al. (1992), diacetylene is expected to condense at higher altitudes than ethane and acetylene, making this scenario unlikely. Moreover, ethane and acetylene are expected to be the hydrocarbons with the higher stratospheric haze production rates (Pollack et al. 1987; Moses et al. 1992).
If haze particles evaporate before reaching the MCL, it remains unclear what the source of tropospheric CCNs required for methane heterogeneous nucleation could be. As indicated above, the formation of the stratospheric hazes comes from the condensation of hydrocarbons. Moses et al. (1992) studied the nucleation of hydrocarbons in the stratosphere of Neptune and found that haze formation in the stratosphere requires the presence of CCNs or ions. Thus, it is expected that if the haze evaporates before reaching the MCL, the original core of the haze particle would remain to serve as CCN for the condensation of methane. These haze cores can be dust from meteoric dust ablation and recondensation, ions, or photochemical smog particles formed above the altitudes where the stratospheric hydrocarbons condense. However, the heterogeneous nucleation rate highly depends on the CCN size. Figure 9 shows the variation of the methane nucleation rate with CCN radius for different saturation conditions and contact parameter values. In general, the nucleation rates of at least 10−3−10−2 particles per cm−3 sec−1 are required to produce observable clouds (Moses et al. 1992). Here, we see that the smaller the CCN radius, the greater is the saturation required to start nucleation. According to Moses et al. (1992), dust oblation can provide dust particles with radii from 1 to 10 nm; Fig. 9 indicates that this would require methane saturations greater than 1.2–2 (assuming a contact parameter close to 1) to start an efficient nucleation near the MCL. At higher altitudes, the saturations needed to start nucleation are even greater.
These results suggest that if methane condensation is the primary mechanism for maintaining methane levels below saturation above the MCL, then the presence of CCNs with radii greater than 1–10 nm is necessary. Without these CCNs, methane saturation can exceed values significantly greater than 1.2–2 before condensation occurs. One possibility is that during haze formation and subsequent settling, the stratospheric ice hazes undergo changes in their solid phase due to UV light absorption, making the material less volatile and preventing it from evaporating in the troposphere. Another possibility is the formation of photochemical hazes in the upper troposphere and lower stratosphere that could serve as CCNs not only for methane condensation, but also for H2S (Irwin et al. 2018, 2019b). This may explain why the imaginary refractive index of aerosols retrieved from both planets generally differs from that of pure ices (Irwin et al. 2022). In any case, this analysis and previous works indicate complex mechanisms in the formation of the aerosols on these planets (e.g., Irwin et al. 2023b) and highlight the need for in situ radiance measurements. Specifically, in situ measurements of UV energy deposition in the troposphere, along with retrievals of the aerosol vertical distribution and optical properties conducted by a radiometer (Apéstigue et al. 2024), would allow us to identify the different regions where aerosols form or change their main optical properties.
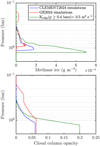 |
Fig. 7 Vertical profiles of methane ice concentration ( gm−3) and cloud column opacity in the atmospheres of Uranus, simulated with the microphysical model using the GE2024- and CLEMENT2024-Keddy profiles, and a methane abundance of 50 × Solar. The figure also displays the cloud profiles obtained using Keddy=0.5 m2 s−1 and a deep methane ratio of 0.04 (Fig. 1). |
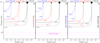 |
Fig. 8 Decrease in the radius of a haze particle made of C2H2 and C2H6 ice in Uranus atmosphere due to evaporation, for different initial radii at p=0.1 bar and saturation conditions (0.4, 0.6, and 0.8). The evaporation rates and terminal velocities are derived from the integration of Eqs. (2)–(3), considering a single particle with the initial radius shown in the upper part of the figures. In all the cases the haze particle get totally evaporated before reaching the 1.2 bar level layer. |
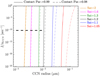 |
Fig. 9 Heterogeneous nucleation rate (J) of methane ice near the 1.2 bar level in Uranus atmosphere, as a function of the CCN particle radius and the contact parameter. The horizontal dashed line indicates the range of sizes between 1 and 10 nm. The total number of CCN per cm−3 s−1 is the product between the values illustrated in the figure and the concentration of haze particles for a given size. |
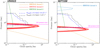 |
Fig. 10 Comparison between Aerosol-2 opacity profiles provided in IRW22 for Uranus and Neptune atmospheres, and the cloud profiles derived from the microphysical simulations for Keddy(p ≥ 0.4 bars) = 0.5 and 1 m2 s−1. The purple dashed lines indicate the pressures where changes in atmospheric refractivity were reported from Voyager 2 data. The figure also displays the Aerosol-1, Aerosol-3, and Aerosol-4 profiles for one of the solutions that fit the observations. |
5 Comparison with observations
5.1 Radiative transfer modeling
In previous works, a number of ground-based observations of Uranus and Neptune have been analyzed using radiative transfer simulations to constrain the vertical structure of aerosols and their optical and scattering properties (e.g., Sromovsky et al. 2006; Sromovsky & Fry 2008; Karkoschka & Tomasko 2011; Sromovsky et al. 2011; Irwin et al. 2017). Irwin et al. (2022, henceforth IRW22) reanalyzed combined data acquired by the Space Telescope Imaging Spectrograph (STIS) on the Hubble Space Telescope (HST), the Infrared Telescope Facility’s SpeX instrument, and the Gemini-North’s Near-Infrared Integral-Field Spectrograph in the spectral range of 0.3–2.5 µm. These authors found a common aerosol model that fits the observed reflectivity spectra of both planets. The model includes: (i) a deep aerosol layer with a base pressure greater than 5–7 bar, assumed to be composed of a mixture of H2S ice and haze; (ii) a layer of photochemical haze/ice near the 1–2 bar level with particle radii between 0.3 and 0.8 µm (referred as Aerosol-2 layer); and (iii) an extended layer of photochemical haze extending from the methane condensation level to the stratosphere. For Neptune, a thin layer of micron-sized ice particles at approximately 0.2 bar was also necessary (Aerosol-4). To assess whether the Aerosol- 2 layer from IRW22 may originate from the condensation of methane (as its altitude is close to the methane condensation level), Fig. 10 shows a comparison of the Aerosol-2 layer opacity with the results shown in Fig. 1. The figure depicts the entire family of Aerosol-2 layer solutions that provide a good fit between the observations and the simulations in IRW22. In order to show the IRW22 aerosol structure, Fig. 10 also presents an example of Aerosol-1, Aerosol-3, and Aerosol-4 profiles for one of the solutions that fit the observations analyzed in IRW22.
The radiative transfer analysis of IRW22 indicates an increase in aerosol opacity approximately 3–5 km below the methane cloud base derived from the microphysical simulations. Additionally, for the tested Keddy values, the opacity of the Aerosol-2 layer is up to an order of magnitude greater than the values obtained from CMM. In terms of particle radius, we also observe that the methane droplets simulated in Section 3.1 near the cloud base are two orders of magnitude larger than the values retrieved for Aerosol-2. Thus, while it is true that the altitude of Aerosol-2 on Neptune (compared with Uranus) decreases consistently with the change in the condensation level due to lower temperatures (see Fig. 1), the cloud retrievals appear inconsistent with the values derived from CMM. If both data and model are correct, this discrepancy may suggest that the aerosol layer close to 1–2 bars is not simply composed of condensed methane ice particles.
Figure 11a shows the variation of methane saturation with pressure in Uranus’s atmosphere. We see that below the 1.2-bar level, methane saturation decreases rapidly with pressure due to increasing temperatures. Between the 1.2-bar and 1.5-bar levels, methane saturation varies from ∼0.97 to ∼0.43. These subsaturated conditions and the high condensation and evaporation rates of methane prevent the presence of methane ice at the Aerosol-2 pressure level. As we detail in Section 4, here we can also integrate Eqs. (2)–(3) for a single particle to estimate the minimum droplet radius near the cloud base required for methane ice to exist near the Aerosol-2 pressure level. Figure 11b shows the variation of radius with pressure for droplets falling from the 1.2bar level with different initial sizes (100, 200, and 400 µm) and under the saturation conditions shown in Fig. 11a. To facilitate the comparison, IRW22 Aerosol-2 profiles are also illustrated in Fig. 11 (panel c). These results indicate that particles with sizes of 100–200 µm completely evaporate before reaching the altitude of the Aerosol-2 maximum opacity. Even though there are IRW22 Aerosol-2 profiles whose maximum is near the 1.3-bar level, we see that these profiles also present significant opacities at pressures greater than 1.5 bar. The presence of methane ice at those pressures would imply droplet radii near the cloud base of approximately 400 µm, which is inconsistent with the CMM simulations or observations. Indeed, to our knowledge, no radiative transfer analysis of ground-based observations or data from Voyager 2 has indicated the presence of particles with such sizes; however, it is equally true that constraining the size of particles much larger than the wavelength at which they are being observed is difficult. It is also important to note that the high evaporation rates and subsaturated conditions below the 1.2-bar level make the scenario of boiling rain droplets, as described in Li & Chen (2019), unlikely for methane in the atmospheres of the ice giants. Such a phenomenon may occur when methane droplets are at ambient pressures close to the saturation vapor pressure, approximately 3.5 bar on Uranus and 4.5 bar on Neptune, which correspond to much deeper atmospheric levels than the pressures of complete evaporation shown in Fig. 11.
While these results suggest that the primary composition of the Aerosol-2 layer cannot be attributed to the methane cloud simulated with our CMM, the observation that Aerosol-2 displays a lower altitude for Neptune, consistent with the lower temperatures, implies a potential association with the methane condensation. In the CMM simulations discussed in Sect. 3.1, we demonstrated that the rapid precipitation of methane leads to vertical transport of haze particles, which act as CCN. In Fig. 4 we saw an accumulation of haze particles near the 1.3bar level, where methane droplets completely evaporate. In this context, Aerosol-2 pressures may indicate an atmospheric region where methane droplets evaporate, thereby releasing and accumulating the haze particles that served as CCN for methane nucleation at higher altitudes. This scenario would explain: (i) the presence of the Aerosol-2 layer reported in IRW22; (ii) the fact that above the 1.2 and 1.6-bar levels in Uranus and Neptune, respectively, methane partial pressure closely approaches saturation; and (iii) although methane condenses in the troposphere, high precipitation rates prevent the observation of a thick cloud deck. However, as discussed in Section 3.2, this would imply a change in the properties of the stratospheric ice hazes as they fall through the lower stratosphere or high troposphere, or the presence of an additional source of haze, to be consistent with: (i) the expectation that ethane and acetylene ice particles would evaporate before reaching the methane condensation altitudes and (ii) the significantly larger particle radius of Aerosol-2 derived in IRW22, compared to the expected radius for the haze particles reported in Pollack et al. (1987); Moses et al. (1992); Toledo et al. (2019, 2020).
Another possibility is that the methane saturation conditions at altitudes near the Aerosol-2 layer differ from those used in the CMM simulations. These different saturation conditions may arise from variations in the temperature profiles compared to those used in this work (see Section 2) or from variations in the deep methane mixing ratio. However, although higher saturation conditions would allow methane droplets to travel longer vertical distances before evaporating, there would still be the problem of the differences in the particle size. The mean particle size of droplets in a given layer mainly depends on the amount of methane gas condensing there and the concentration of CCNs. On this basis, we may observe variations in the mean droplet size by employing different haze profiles from those given in Toledo et al. (2019, 2020) in the microphysical simulations. A rough estimation of how the mean droplet radius depends on the concentration of haze (or CCNs) can be derived from:
 (4)
(4)
where  is the methane mass per m3 in excess of saturation and nCCN is the concentration of CCN (number per m3). Figure 12 shows the variation of the mean radius with pressure estimated from Eq. (4) for different saturations and concentrations of CCNs. In general, we see that even with a very large concentration of CCNs and a saturation of 1.01, the methane droplets near the Aerosol-2 pressure level are still too large compared to the 0.3–0.8 µm derived in IRW22. We found that to have particle sizes around 1 µm near the 1-bar level, the concentration of CCNs must be on the order of 106 particles per cm3, which is 2–3 orders of magnitude larger than the estimated concentration of dust particles in the stratosphere (Moses et al. 1992).
Thus, these results suggest that the Aerosol-2 layer reported in IRW22 may be an accumulation of haze particles resulting from the evaporation of methane droplets formed at higher altitudes, which precipitate rapidly due to their large size. This scenario aligns with IRW22, where it is hypothesized that the Aerosol-2 layer consists of a mixture of photochemical haze and methane ice (except that our simulations show methane droplets evaporate completely at pressures greater than approximately 1.3 bar in Uranus and 1.7 bar in Neptune). This would also be consistent with the refractive index of the Aerosol-2 layer retrieved in IRW22, which is not what would be expected for methane ice droplets. Indeed, IRW22 found particles that scatter at visible wavelengths but are more absorbing at UV and longer wavelengths. Specifically, imaginary refractive index values of 3.13×10⁻³, I.I3×10−3, and l.6l×10−3 at 0.3, 0.4, and 0.5 µm, respectively, were estimated from the weighted average for all best-fitting retrieved spectra. In contrast, the imaginary refractive index of methane droplets is of the order of 10−8 at these wavelengths, with single scattering albedos ~ 1 in the wavelength range from 0.3 to 1 µm for micron-sized particles.
Finally, another possibility to reconcile the microphysical simulations and the radiative transfer retrievals is that the saturation vapor pressure of methane is affected by H2 or He.
For instance, on Titan, N2 dissolved in methane lowers the freezing point and reduces the saturation vapor pressure of methane. Thompson et al. (1992) used a thermodynamic model for vapor–liquid equilibrium in the N2 + CH4 system under Titan conditions and found a reduction in the saturation vapor pressure by about 15–20%. If a similar reduction in methane saturation pressure were present for the CH4+H2 or CH4 +H2 +He system in the ice giants, a lower cloud base (at greater pressures) would be derived from the microphysical simulations, making it more consistent with the radiative transfer retrievals. However, this hypothesis needs to be modeled for the ice giants to determine the exact impact, as the solubility of gases and their effect on vapor pressures can vary widely depending on temperature, pressure, and the specific mixture of gases involved.
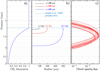 |
Fig. 11 Variation of methane saturation and particle radius with pressure. (a) Methane saturation in Uranus atmosphere obtained from CMM after several terrestrial days of simulations. (b) Distance traveled by a methane droplet falling from the 1.2-bar level with different initial radii and the saturation conditions illustrated in panel a before its complete evaporation. The distances are computed by integrating Eqs. (2)–(3) and assuming no vertical mixing. (c) Aerosol-2 profiles derived in IRW22. |
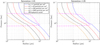 |
Fig. 12 Comparison between the mean droplet radius obtained from CMM for Uranus atmosphere and Keddy(p ≥ 0.4 bars) = 0.5 m2 s−1 and the values obtained from Eq. (4) for different CCN concentrations and a saturation of 1.05. For the estimation of the mean radius from Eq. (4), we assume all methane in excess of the saturation ends up condensing. |
5.2 Methane depletion at polar latitudes
Spectral observations of Uranus and Neptune have revealed a decrease in the deep methane abundance in the polar regions of both planets (e.g., Karkoschka & Tomasko 2009; Sromovsky et al. 2014, 2019, 2024; Toledo et al. 2018; Irwin et al. 2021; James et al. 2023). James et al. (2023) analyzed observations acquired by HST Wide-Field Camera 3 and HST/STIS from 2015 to 2021, employing the IRW22 aerosol model, and found a temporal thickening of the Aerosol-2 layer at northern polar latitudes (also see Irwin et al. 2024). Similarly, Irwin et al. (2023a) employed a slightly modified version of the IRW22 aerosol model to analyze data made by the Multi Unit Spectroscopic Explorer of the Very Large Telescope of Neptune taken in 2019 and found, to a first approximation, that the opacity and altitude of the Aerosol-2 layer were constant with latitude (except for a region near 80°S). In all these works, a reduction in the methane mixing ratio below its condensation level was found at polar latitudes. These different deep methane abundance and Aerosol-2 layer scenarios allow us to evaluate if the conclusions discussed in the previous section are consistent with the results reported in both works.
Microphysical simulations similar to those presented in Section 3.1 show higher cloud bases as the deep methane ratio decreases. A rough estimation of the cloud base altitude can be made from the intersection between the methane saturation mixing ratio, computed from the temperatures and pressure profiles derived from the Voyager-2 data and the expressions given in Fray & Schmitt (2009), and the assumed deep methane ratio (see Fig. 13). According to this approximation, a decrease in the methane mixing ratio from 0.04 to 0.02 would result in a change in the cloud base altitude from the 1.17-bar level to the 1.05-bar level on Uranus, and from the 1.61-bar level to the 1.40-bar level on Neptune. This is equivalent to an increase in altitude of about 3.5 km. Thus, if the Aerosol-2 layer were made of methane ice, then we would expect higher cloud bases and lower cloud opacities at polar latitudes. In spite of this, it is important to note that variations in the altitude of the condensation level due to the lower methane abundances may be balanced by temperature variations with latitude. In the case of Uranus, for example, a decrease of about 4 K at polar latitudes would offset the cloud base altitude variation caused by the lower deep methane abundance (see Fig. 13). However, Voyager- 2 infrared (IR) observations, along with radiative-dynamical modeling, indicate that a downwelling branch of the planet’s general circulation is expected at polar latitudes (Flasar et al. 1987; Conrath et al. 1990), resulting in adiabatic warming there. Thus, the lower methane abundance and the expected warmer temperatures should, in principle, increase the height of the condensation level and decrease the opacity of the methane ice. This suggests that based on the microphysical modeling, the primary composition of the Aerosol-2 layer is likely not methane ice, as mentioned in the previous section.
Based on this, the increase in Aerosol-2 layer opacity at polar latitudes reported in James et al. (2023) may result from an increase in haze particles transported below the condensation level by cloud scavenging (see Fig. 4). This can be caused by a higher concentration of CCNs at the altitudes where methane supersaturation occurs. Indeed, the number of methane clusters formed per unit of time with a radius greater than or equal to the critical radius, which is the radius at which a droplet becomes stable enough to grow further, directly depends on the concentration of CCNs. Thus, an increase in the concentration of CCNs is expected to reduce the supersaturation conditions required to produce clouds similar to those shown in Fig. 1. This would balance the impact of the lower deep methane abundance at polar latitudes, while simultaneously increasing the number of haze particles accumulated below the cloud condensation level at which the droplets completely evaporate.
However, additional observations and model constraints are needed to fully understand the latitudinal variations in Aerosol-2. For example, if a downwelling branch is anticipated at polar latitudes (Fletcher et al. 2020), we might expect a decrease in Keddy there. As shown in Section 3, this decrease would directly impact the vertical supply of methane and, consequently, the cloud properties. Similarly, the factors that may lead to an increase in CCNs at polar latitudes remain unclear. One possibility is a stratospheric meridional circulation, similar to a Hadley cell, with winds that transport haze particles from upwelling regions to the north pole. Roman et al. (2020) analyzed mid-IR observations of Uranus from 2018 and found greater thermal radiances at mid- and high-latitudes at wavelengths associated with acetylene emission. They interpreted these results as potential evidence of regional acetylene enrichment, likely caused by the transport and subsequent photolysis of methane in the upwelling branch of the planet general circulation. It must be verified whether an enrichment of acetylene and likely other hydrocarbons at midlatitudes can lead to an increase in the production of haze particles, which are eventually transported by the winds to polar latitudes. In this regard, Roman et al. (2020) compared the vertical velocities implied by the temperature variations and the haze settling timescales from Toledo et al. (2019) and found that downwelling may not significantly facilitate the transport of haze particles from the stratosphere to the cloud condensation level within timescales short enough to explain the seasonal changes observed at polar latitudes. This implies the need to extend these studies to include global atmospheric circulation simulations that can establish the limits on the transport of haze particles by wind advection. These simulations, along with cloud microphysics, could provide insights into the main mechanisms responsible for the observed decrease in methane abundance at polar latitudes on both planets.
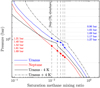 |
Fig. 13 Variation of the saturation methane mixing ratio with pressure computed from the temperature profiles derived from Voyager-2 data. The blue and red dots indicate the pressures where the saturation curves intersect the assumed deep methane abundances (pressures indicated in red and blue on the left and right sides of the figure). The black solid and dotted lines represent the saturation mixing ratio when a ∆T of ±4 K is added to Uranus’ temperature profile. |
6 Comparison with Titan methane clouds
In our solar system, aside from the ice giants, Titan is the other body where methane clouds have been observed, using ground-based telescopes (e.g., Griffith et al. 1998) and instruments onboard the Cassini mission, such as the Imaging Science Subsystem (ISS) cameras (Porco et al. 2005). A number of global circulation models (GCM) and 1D microphysical models have been employed to simulate their main properties (Barth & Toon 2004, 2006), as well as their seasonal and spatial distribution (Rannou et al. 2006). These models predict methane clouds to form on Titan at altitudes between 5 and 15 km, where the methane saturation pressure ranges from approximately 0.02 to 0.1 bar. These values are comparable to the methane partial pressures at altitudes between the 0.9 and 1.2-bar levels in Uranus’s atmosphere, allowing us to directly compare the properties of methane clouds in these atmospheres and take advantage of the larger number of observations and models available for Titan to interpret our model results.
Titan GCMs and 1D models provide methane mean particle radii between 10 and 100 µm (Rannou et al. 2006; Barth & Toon 2006) and precipitation rates of about 1.6× 10⁻⁶ kg m−2 s−1 (Tokano et al. 2001), which are within the range of values derived in this work (see Section 3). Similarly, for Keddy=0.5 m2 s−1, we obtain cloud opacities comparable to those derived in Barth & Toon (2006) for a steady-state cloud simulated using a similar Keddy . Despite this, some differences arise in the timescales of the clouds due to the differences in gravity and dynamic viscosity in these atmospheres. These parameters directly affect the settling velocities of the cloud droplets. When comparing both atmospheres, we find gice𝑔iants/gTitan ~ 7 and  . Applying Stokes’ law
  , we derive that, for equal radius, the settling velocities of the cloud droplets in the ice giants must be roughly one order of magnitude greater than those for Titan.
The impact of this different settling velocities on the properties of the methane clouds can be directly evaluated by performing similar simulations to those discussed in Section 3.1, but multiplying the velocities computed by Eq. (3) by a factor of 0.1. Fig. 14a shows a comparison of the cloud ice concentration and column opacity derived from CMM using the baseline setup and when the settling velocities are decreased by a factor of 0.1. Here, we see that the decrease in the settling velocities results in an increase in the cloud opacity (by a factor of ~1.8). A similar comparison for the mean particle size also reveals larger particles when w is decreased. For instance, near the cloud base, particle size increases from about 100 to 200 µm. This increase in particle radius is due to the fact that cloud droplets can remain in the methane saturated layers for a longer time compared to the baseline model. However, it is important to note that although the cloud opacity increases when w is decreased, the precipitation rate in both simulations remains the same. Indeed, the increase in particle radius and ice concentration balances the effect of decreasing won the precipitation rates, maintaining the product  the same in both simulations (here we have assumed w ∝ r2). Thus, as discussed in Section 3.2, the main parameter controlling the precipitation rates is Keddy (parameter used to “mimic” the dynamics in the 1D simulations). Therefore, we see that the impact of the settling velocities on the total opacity of the cloud can be on the same order as when Keddy is changed (see Section 3.2).
The opacities of Titan methane clouds derived from the steady-state simulations are generally much smaller than those of the sporadic clouds localized in the ascending branches of the atmospheric circulation. These latter clouds are observable from direct imaging and have opacities that can reach values between 1 and 100 (Rannou et al. 2006). The bright cloud systems observed on Neptune and (less frequently) on Uranus (e.g., Karkoschka 1998; de Pater et al. 2015; Irwin et al. 2017; Molter et al. 2019), display higher cloud tops than those derived in the steady-state simulations of Section 3. These particular events can be modeled by a sudden increase in Keddy compared to the baseline run, lasting only for a given period of time. The possible factors leading to the increase in Keddy , such as convective instability or waves (Hueso & Sánchez-Lavega 2019), are beyond the scope of this work. However, it remains uncertain whether the bases of those cloud systems are located near the condensation levels shown in Section 3 or, conversely, at higher altitudes. In any case, the steady-state simulations reported in Section 3 explain how methane condensation above the 1.2-bar level in Uranus and above the 1.6-bar level in Neptune keeps methane abundance in the troposphere near saturation; however, a thick cloud deck is not observable in images of both planets. Indeed, as discussed above, the high droplet settling velocities and the subsaturation conditions below the cloud base prevent these clouds from reaching high opacities for Keddy < 1–2 m2 s−1.
Finally, Fig. 14b shows the variation of the total cloud opacity with time when Keddy is decreased by a factor of 100 at time = 0 hours (at this moment the cloud has a total opacity of 0.4). The blue line represents the baseline model, while the red line represents the case when the settling velocities are multiplied by a factor of 0.1 (to represent the Titan case). In these simulations, we observe that the lifetime of the cloud depends highly on the droplet settling velocities. Therefore, if the vertical mixing is suddenly decreased for a given cloud event, the timescales for complete dissipation are expected to be significantly shorter in the atmospheres of the ice giants compared to Titan.
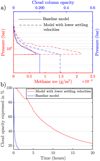 |
Fig. 14 Simulations showing the impact of the droplet setting velocities on the cloud opacity. (a) Vertical profiles of methane ice concentration and cloud column opacity on Uranus derived from CMM for Keddy (p ≥ 0.4 bars) = 0.5 m2 s−1, with droplet settling velocities decreased by a factor of 10. For comparison, the baseline simulation (left panel of Fig. 1) is also shown. (b) Variation of the cloud total opacity over time when Keddy is decreased by a factor of 100 in the simulations shown in (a). Time = 0 represents the moment when the sudden decrease in Keddy is applied in the simulations. |
7 Conclusions
In this work, we conducted a number of 1D cloud microphysics simulations to study the formation and main properties of the methane clouds in the atmospheres of the ice giants. We have reached the following main conclusions:
Cloud microphysics simulations indicate low opacities for the range of Keddy values tested in this work (from 0.1 to 2 m2 s−1 ). A major factor limiting these opacities is the high settling velocities of the droplets, which result from their large size. The maximum droplet sizes are found near the cloud bases, around the 1.24-bar level in Uranus and the 1.62-bar level in Neptune, with a mean radius of about 100 µm, assuming the haze profiles derived in Toledo et al. (2019, 2020).
The cloud properties respond very rapidly to variations in Keddy , with timescales of less than ∼1–2 hours. This is a direct consequence of the high droplet settling velocities. If a given cloud system is produced by a sudden increase in the vertical mixing of methane (simulated here with Keddy), then the cloud is expected to dissipate within timescales of ∼1 hour once Keddy returns to its nominal value.
Condensation is the main factor controlling the decrease in the methane mixing ratio with altitude observed in the troposphere of both planets. The high settling velocities of the droplets may partly explain why, despite methane condensation is occurring in the troposphere, a thick methane cloud deck is not observed in the spectral analyses of both planets.
Because of the high precipitation rates, the haze particles, assumed to be the CCNs, are transported from the altitudes where methane nucleation occurs to below the cloud base where the droplets completely evaporate. This results in the formation of an aerosol layer where haze particles accumulate over time. The formation of this haze layer seems to be consistent with the radiative transfer analysis carried out by Irwin et al. (2022), which found an aerosol layer near the 1–2 bar level with particle radii between 0.3 and 0.8 µm. However, variations in temperature and deep methane abundance can lead to changes in the altitude of the cloud base, allowing for the presence of methane ice at pressures greater than 1.24 bar on Uranus and 1.62 bar on Neptune. Similarly, more research is needed to determine if H2 or H2 dissolved in methane under the conditions of Uranus and Neptune may lower the freezing point. If that were the case, methane droplets would be present at pressures greater than 1.24 bar (on Uranus) and 1.62 bar (on Neptune).
Hazes made of ethane or acetylene ice are expected to completely evaporate before reaching the methane condensation level. The evaporation of the ice haze particles would release their cores (e.g., dust, ions, or photochemical smog particles). However, radii greater than ∼1–10 nm are necessary to achieve nucleation rates high enough to produce clouds with methane saturations lower than 2. Another possibility is a change in the solid phase of the stratospheric ice hazes (due to, e.g., UV absorption), which could prevent their evaporation before reaching the methane condensation level or the presence of another source of CCNs below the altitude where stratospheric ice hazes are expected to evaporate.
The droplet sizes derived in this work are comparable to those estimated for Titan methane clouds. This results from the similar saturation pressures at the altitudes where these clouds form. However, because of the greater gravity and lower atmospheric viscosity of the atmospheres of the ice giants with respect to Titan, the droplets settling velocities are expected to be greater by a factor of 10. This factor makes the lifetime of the methane clouds in the ice giants much shorter.
Finally, this work highlights the complexity of the cloud and haze structures in the atmospheres of Uranus and Neptune. A complete understanding of the aerosol properties is key to determining the heating sources in both planets and evaluating their impact on the dynamic and seasonal effects (Milcareck et al. 2024). In view of a Uranus Orbiter and Probe future mission (Simon et al. 2022), these factors highlight the importance of including instrumentation dedicated to studying the properties of aerosols such a radiometer (Apéstigue et al. 2024). In situ multiple radiance observations at different wavelengths, from the UV to the IR, would not only allow the determination of the vertical distribution of aerosols (sources and sinks) and their optical properties, but also establish the variation of UV energy absorption with pressure and determine its penetration in the atmosphere. Also, future work should aim to couple microphysical simulations with global circulation modeling. This is particularly important for determining if methane condensation in the ascending branches of the atmospheric circulation is the main factor controlling the decrease in methane abundance near the cloud condensation level observed at polar latitudes (Karkoschka & Tomasko 2009).
Acknowledgements
This work has been funded by the Spanish Ministry of Science and Innovation through the grant PID2022-139386OA-I00.
Appendix A Methane profiles
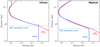 |
Fig. A.1 Methane mixing ratio and saturation mixing ratio profiles in the atmospheres of Uranus and Neptune. For Uranus’ atmosphere, the temperature and mole fraction profiles are the same as those used by Irwin et al. (2018, 2022), which are based on the ’F1’ temperature profile determined by Sromovsky et al. (2011). For Neptune, the temperature and mole fraction profiles are the same as those used in Irwin et al. (2019a, 2021), which are based on the ’N’ profile determined by Lindal (1992). The horizontal blue dashed lines indicate the pressures where Lindal et al. (1987) (L87) and Lindal (1992) (L92) reported changes in the atmospheric refractivity. The methane saturation profiles are computed using the expressions given in Fray & Schmitt (2009). |
Appendix B Colormap of methane ice opacity
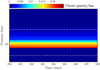 |
Fig. B.1 Contours of methane cloud opacity per km at 0.8 µm over a period of 8 Earth days in Uranus atmosphere, derived from the microphysical model as a function of time (expressed in terrestrial days) and for a constant Keddy (p ≥ 0.4 bars)= 0.5 m2 s−1. The cloud condensation starts by day 16, when saturation reaches values close to 1.08. The cloud based is localized close to 1.24 bars, and the total cloud opacity is ∼0.2 in the visible. Dashed white lines represent the 0.4, 1 and 2-bar levels. |
References
- Apéstigue, V., Toledo, D., Irwin, P., et al. 2024, Space Sci. Rev., 220, 6 [CrossRef] [Google Scholar]
- Barth, E. L., & Toon, O. B. 2003, Icarus, 162, 94 [NASA ADS] [CrossRef] [Google Scholar]
- Barth, E. L., & Toon, O. B. 2004, Geophys. Res. Lett., 31, L17S07 [NASA ADS] [Google Scholar]
- Barth, E. L., & Toon, O. B. 2006, Icarus, 182, 230 [NASA ADS] [CrossRef] [Google Scholar]
- Cabane, M., Chassefiere, E., & Israel, G. 1992, Icarus, 96, 176 [NASA ADS] [CrossRef] [Google Scholar]
- Carlson, B. E., Rossow, W. B., & Orton, G. S. 1988, J. Atmos. Sci., 45, 2066 [NASA ADS] [CrossRef] [Google Scholar]
- Clément, N., Leconte, J., Spiga, A., et al. 2024, A&A, 690, A227 [NASA ADS] [CrossRef] [EDP Sciences] [Google Scholar]
- Conrath, B. J., Gierasch, P. J., & Leroy, S. S. 1990, Icarus, 83, 255 [NASA ADS] [CrossRef] [Google Scholar]
- de Pater, I., Sromovsky, L., Fry, P., et al. 2015, Icarus, 252, 121 [NASA ADS] [CrossRef] [Google Scholar]
- Flasar, F., Conrath, B., Gierasch, P., & Pirraglia, J. 1987, J. Geophys. Res. Space Phys., 92, 15011 [NASA ADS] [CrossRef] [Google Scholar]
- Fletcher, L. N., de Pater, I., Orton, G. S., et al. 2020, Space Sci. Rev., 216, 1 [CrossRef] [Google Scholar]
- Fray, N., & Schmitt, B. 2009, Planet. Space Sci., 57, 2053 [Google Scholar]
- Ge, H., Li, C., Zhang, X., & Moeckel, C. 2024, Planet. Sci. J., 5, 101 [CrossRef] [Google Scholar]
- Griffith, C. A., Owen, T., Miller, G. A., & Geballe, T. 1998, Nature, 395, 575 [Google Scholar]
- Guillot, T. 1995, Science, 269, 1697 [CrossRef] [Google Scholar]
- Hueso, R., & Sánchez-Lavega, A. 2019, Space Sci. Rev., 215, 52 [Google Scholar]
- Irwin, P., Fletcher, L. N., Tice, D., et al. 2016, Icarus, 271, 418 [NASA ADS] [CrossRef] [Google Scholar]
- Irwin, P. G., Wong, M. H., Simon, A. A., Orton, G., & Toledo, D. 2017, Icarus, 288, 99 [NASA ADS] [CrossRef] [Google Scholar]
- Irwin, P. G., Toledo, D., Garland, R., et al. 2018, Nat. Astron., 2, 420 [CrossRef] [Google Scholar]
- Irwin, P. G., Toledo, D., Braude, A. S., et al. 2019a, Icarus, 331, 69 [CrossRef] [Google Scholar]
- Irwin, P. G., Toledo, D., Garland, R., et al. 2019b, Icarus, 321, 550 [NASA ADS] [CrossRef] [Google Scholar]
- Irwin, P. G., Dobinson, J., James, A., et al. 2021, Icarus, 357, 114277 [NASA ADS] [CrossRef] [Google Scholar]
- Irwin, P. G., Teanby, N. A., Fletcher, L. N., et al. 2022, J. Geophys. Res. Planets, 127, e2022JE007189 [NASA ADS] [CrossRef] [Google Scholar]
- Irwin, P. G., Dobinson, J., James, A., et al. 2023a, J. Geophys. Res. Planets, 128, e2023JE007980 [NASA ADS] [CrossRef] [Google Scholar]
- Irwin, P. G., Dobinson, J., James, A., et al. 2023b, Nat. Astron., 7, 1198 [CrossRef] [Google Scholar]
- Irwin, P. G., Dobinson, J., James, A., et al. 2024, MNRAS, 527, 11521 [Google Scholar]
- James, A., Irwin, P. G., Dobinson, J., et al. 2023, J. Geophys. Res. Planets, 128, e2023JE007904 [NASA ADS] [CrossRef] [Google Scholar]
- Karkoschka, E. 1998, Science, 280, 570 [NASA ADS] [CrossRef] [Google Scholar]
- Karkoschka, E., & Tomasko, M. 2009, Icarus, 202, 287 [NASA ADS] [CrossRef] [Google Scholar]
- Karkoschka, E., & Tomasko, M. G. 2011, Icarus, 211, 780 [NASA ADS] [CrossRef] [Google Scholar]
- Leconte, J., Selsis, F., Hersant, F., & Guillot, T. 2017, A&A, 598, A98 [NASA ADS] [CrossRef] [EDP Sciences] [Google Scholar]
- Li, C., & Chen, X. 2019, ApJS, 240, 37 [NASA ADS] [CrossRef] [Google Scholar]
- Lindal, G. F. 1992, AJ, 103, 967 [Google Scholar]
- Lindal, G. F., Lyons, J., Sweetnam, D., et al. 1987, J. Geophys. Res., 92, 14987 [NASA ADS] [CrossRef] [Google Scholar]
- Milcareck, G., Guerlet, S., Montmessin, F., et al. 2024, A&A, 686, A303 [NASA ADS] [CrossRef] [EDP Sciences] [Google Scholar]
- Molter, E., de Pater, I., Luszcz-Cook, S., et al. 2019, Icarus, 321, 324 [NASA ADS] [CrossRef] [Google Scholar]
- Montmessin, F., Rannou, P., & Cabane, M. 2002, J. Geophys. Res. Planets, 107, 4 [CrossRef] [Google Scholar]
- Montmessin, F., Forget, F., Rannou, P., Cabane, M., & Haberle, R. 2004, J. Geophys. Res. Planets, 109, E10 [CrossRef] [Google Scholar]
- Moses, J. I., Allen, M., & Yung, Y. L. 1992, Icarus, 99, 318 [NASA ADS] [CrossRef] [Google Scholar]
- Pollack, J. B., Rages, K., Pope, S. K., et al. 1987, J. Geophys. Res. Space Phys., 92, 15037 [NASA ADS] [CrossRef] [Google Scholar]
- Porco, C. C., Baker, E., Barbara, J., et al. 2005, Nature, 434, 159 [NASA ADS] [CrossRef] [Google Scholar]
- Pruppacher, H. R., & Klett, J. D. 1980, Nature, 284, 88 [CrossRef] [Google Scholar]
- Pruppacher, H. R., Klett, J. D., & Wang, P. K. 1998, Microphysics of Clouds and Precipitation (Berlin: Springer) [Google Scholar]
- Rannou, P., Montmessin, F., Hourdin, F., & Lebonnois, S. 2006, Science, 311, 201 [NASA ADS] [CrossRef] [Google Scholar]
- Rannou, P., Curtis, D., & Tolbert, M. 2019, A&A, 631, A151 [NASA ADS] [CrossRef] [EDP Sciences] [Google Scholar]
- Reid, R. C., Prausnitz, J. M., & Poling, B. E. 1987 The properties of gases and liquids (New York, NY: McGraw Hill Book Co.) [Google Scholar]
- Roman, M. T., Fletcher, L. N., Orton, G. S., Rowe-Gurney, N., & Irwin, P. G. 2020, Astron. J., 159, 45 [NASA ADS] [CrossRef] [Google Scholar]
- Sánchez-Lavega, A., Irwin, P., & García Muñoz, A. 2023, Astron. Astrophys. Rev., 31, 5 [CrossRef] [Google Scholar]
- Simon, A., Nimmo, F., Anderson, R., et al. 2022, Journey to an Ice Giant System: Uranus Orbiter & Probe. Planetary Mission Concept Study for the 2023-2032 Decadal Survey [Google Scholar]
- Sromovsky, L., & Fry, P. 2008, Icarus, 193, 252 [CrossRef] [Google Scholar]
- Sromovsky, L., Irwin, P., & Fry, P. 2006, Icarus, 182, 577 [CrossRef] [Google Scholar]
- Sromovsky, L., Fry, P., & Kim, J. H. 2011, Icarus, 215, 292 [NASA ADS] [CrossRef] [Google Scholar]
- Sromovsky, L., Karkoschka, E., Fry, P., et al. 2014, Icarus, 238, 137 [NASA ADS] [CrossRef] [Google Scholar]
- Sromovsky, L. A., Karkoschka, E., Fry, P. M., de Pater, I., & Hammel, H. B. 2019, Icarus, 317, 266 [NASA ADS] [CrossRef] [Google Scholar]
- Sromovsky, L. A., Fry, P. M., de Pater, I., & Hammel, H. B. 2024, Icarus, 420, 116186 [NASA ADS] [CrossRef] [Google Scholar]
- Thompson, W. R., Zollweg, J. A., & Gabis, D. H. 1992, Icarus, 97, 187 [NASA ADS] [CrossRef] [Google Scholar]
- Tokano, T., Neubauer, F. M., Laube, M., & McKay, C. P. 2001, Icarus, 153, 130 [NASA ADS] [CrossRef] [Google Scholar]
- Toledo, D., Irwin, P. G., Teanby, N. A., et al. 2018, Geophys. Res. Lett., 45, 5329 [NASA ADS] [CrossRef] [Google Scholar]
- Toledo, D., Irwin, P. G., Rannou, P., et al. 2019, Icarus, 333, 1 [NASA ADS] [CrossRef] [Google Scholar]
- Toledo, D., Irwin, P. G., Rannou, P., et al. 2020, Icarus, 350, 113808 [NASA ADS] [CrossRef] [Google Scholar]
- Yarnall, Y. Y., & Hudson, R. L. 2022, Icarus, 373, 114799 [CrossRef] [Google Scholar]
All Tables
All Figures
|
Fig. 1 Vertical profiles of methane ice concentration (g m−3) and cloud column opacity at 0.8 µm in the atmospheres of Uranus and Neptune simulated with the microphysical model for Keddy(p ≥ 0.4 bars)= 0.5 m2 s−1 and a deep methane ratio of 0.04. |
| In the text | |
|
Fig. 2 Vertical profiles of the mean cloud particle radius (left panel) and precipitation rate (right panel) in the atmospheres of Uranus and Neptune, simulated with the microphysical model for Keddy(p ≥ 0.4 bars) = 0.5 m2 s−1 and a deep methane ratio of 0.04. |
| In the text | |
|
Fig. 3 Methane mixing ratio profiles derived from the microphysical model for Uranus atmosphere when methane condensation is included (a) and excluded (b) in the simulations. In all the simulations, we set Keddy(p ≥ 0.4 bars) = 0.5 m2 s−1. For comparison purposes, the profile derived from Voyager 2 data is also displayed. If condensation is not included in the simulations, high supersaturations occur in the troposphere, as shown in panel c, where the red line represents saturation when condensation is included in the simulations. The blue curve represents saturation when condensation is not included in the simulations. |
| In the text | |
|
Fig. 4 Variation in the haze concentration with time derived from the cloud microphysics simulations for Uranus atmosphere (Keddy (p ≥ 0.4 bars)= 0.5 m2 s−1). Each panel, delimited by vertical thick white lines, represents a 1-day block. The white dashed lines indicate the 0.4, 1, and 2-bar levels. |
| In the text | |
|
Fig. 5 Variation of the methane ice concentration and cloud total opacity when Keddy(p ≥ 0.4 bars) is increased from 0.5 to 2 m2 s−1. These simulations are employed for Uranus atmosphere. |
| In the text | |
|
Fig. 6 Cloud concentration and total opacity (upper panel) in Uranus atmosphere derived from the microphysical model when Keddy is decreased by a factor of 10 at pressures greater than 1 bar (lower panel). The decrease in Keddy is applied to the steady-state simulations for Keddy (p ≥ 0.4 bars) = 1 m2 s−1 (solid lines in the upper panel). The cloud profiles after 10 hours and 10 days of this decrease are represented by the dashed and dotted lines in the upper panel. |
| In the text | |
|
Fig. 7 Vertical profiles of methane ice concentration ( gm−3) and cloud column opacity in the atmospheres of Uranus, simulated with the microphysical model using the GE2024- and CLEMENT2024-Keddy profiles, and a methane abundance of 50 × Solar. The figure also displays the cloud profiles obtained using Keddy=0.5 m2 s−1 and a deep methane ratio of 0.04 (Fig. 1). |
| In the text | |
|
Fig. 8 Decrease in the radius of a haze particle made of C2H2 and C2H6 ice in Uranus atmosphere due to evaporation, for different initial radii at p=0.1 bar and saturation conditions (0.4, 0.6, and 0.8). The evaporation rates and terminal velocities are derived from the integration of Eqs. (2)–(3), considering a single particle with the initial radius shown in the upper part of the figures. In all the cases the haze particle get totally evaporated before reaching the 1.2 bar level layer. |
| In the text | |
|
Fig. 9 Heterogeneous nucleation rate (J) of methane ice near the 1.2 bar level in Uranus atmosphere, as a function of the CCN particle radius and the contact parameter. The horizontal dashed line indicates the range of sizes between 1 and 10 nm. The total number of CCN per cm−3 s−1 is the product between the values illustrated in the figure and the concentration of haze particles for a given size. |
| In the text | |
|
Fig. 10 Comparison between Aerosol-2 opacity profiles provided in IRW22 for Uranus and Neptune atmospheres, and the cloud profiles derived from the microphysical simulations for Keddy(p ≥ 0.4 bars) = 0.5 and 1 m2 s−1. The purple dashed lines indicate the pressures where changes in atmospheric refractivity were reported from Voyager 2 data. The figure also displays the Aerosol-1, Aerosol-3, and Aerosol-4 profiles for one of the solutions that fit the observations. |
| In the text | |
|
Fig. 11 Variation of methane saturation and particle radius with pressure. (a) Methane saturation in Uranus atmosphere obtained from CMM after several terrestrial days of simulations. (b) Distance traveled by a methane droplet falling from the 1.2-bar level with different initial radii and the saturation conditions illustrated in panel a before its complete evaporation. The distances are computed by integrating Eqs. (2)–(3) and assuming no vertical mixing. (c) Aerosol-2 profiles derived in IRW22. |
| In the text | |
|
Fig. 12 Comparison between the mean droplet radius obtained from CMM for Uranus atmosphere and Keddy(p ≥ 0.4 bars) = 0.5 m2 s−1 and the values obtained from Eq. (4) for different CCN concentrations and a saturation of 1.05. For the estimation of the mean radius from Eq. (4), we assume all methane in excess of the saturation ends up condensing. |
| In the text | |
|
Fig. 13 Variation of the saturation methane mixing ratio with pressure computed from the temperature profiles derived from Voyager-2 data. The blue and red dots indicate the pressures where the saturation curves intersect the assumed deep methane abundances (pressures indicated in red and blue on the left and right sides of the figure). The black solid and dotted lines represent the saturation mixing ratio when a ∆T of ±4 K is added to Uranus’ temperature profile. |
| In the text | |
|
Fig. 14 Simulations showing the impact of the droplet setting velocities on the cloud opacity. (a) Vertical profiles of methane ice concentration and cloud column opacity on Uranus derived from CMM for Keddy (p ≥ 0.4 bars) = 0.5 m2 s−1, with droplet settling velocities decreased by a factor of 10. For comparison, the baseline simulation (left panel of Fig. 1) is also shown. (b) Variation of the cloud total opacity over time when Keddy is decreased by a factor of 100 in the simulations shown in (a). Time = 0 represents the moment when the sudden decrease in Keddy is applied in the simulations. |
| In the text | |
|
Fig. A.1 Methane mixing ratio and saturation mixing ratio profiles in the atmospheres of Uranus and Neptune. For Uranus’ atmosphere, the temperature and mole fraction profiles are the same as those used by Irwin et al. (2018, 2022), which are based on the ’F1’ temperature profile determined by Sromovsky et al. (2011). For Neptune, the temperature and mole fraction profiles are the same as those used in Irwin et al. (2019a, 2021), which are based on the ’N’ profile determined by Lindal (1992). The horizontal blue dashed lines indicate the pressures where Lindal et al. (1987) (L87) and Lindal (1992) (L92) reported changes in the atmospheric refractivity. The methane saturation profiles are computed using the expressions given in Fray & Schmitt (2009). |
| In the text | |
|
Fig. B.1 Contours of methane cloud opacity per km at 0.8 µm over a period of 8 Earth days in Uranus atmosphere, derived from the microphysical model as a function of time (expressed in terrestrial days) and for a constant Keddy (p ≥ 0.4 bars)= 0.5 m2 s−1. The cloud condensation starts by day 16, when saturation reaches values close to 1.08. The cloud based is localized close to 1.24 bars, and the total cloud opacity is ∼0.2 in the visible. Dashed white lines represent the 0.4, 1 and 2-bar levels. |
| In the text | |
Current usage metrics show cumulative count of Article Views (full-text article views including HTML views, PDF and ePub downloads, according to the available data) and Abstracts Views on Vision4Press platform.
Data correspond to usage on the plateform after 2015. The current usage metrics is available 48-96 hours after online publication and is updated daily on week days.
Initial download of the metrics may take a while.