Fig. 10
Download original image
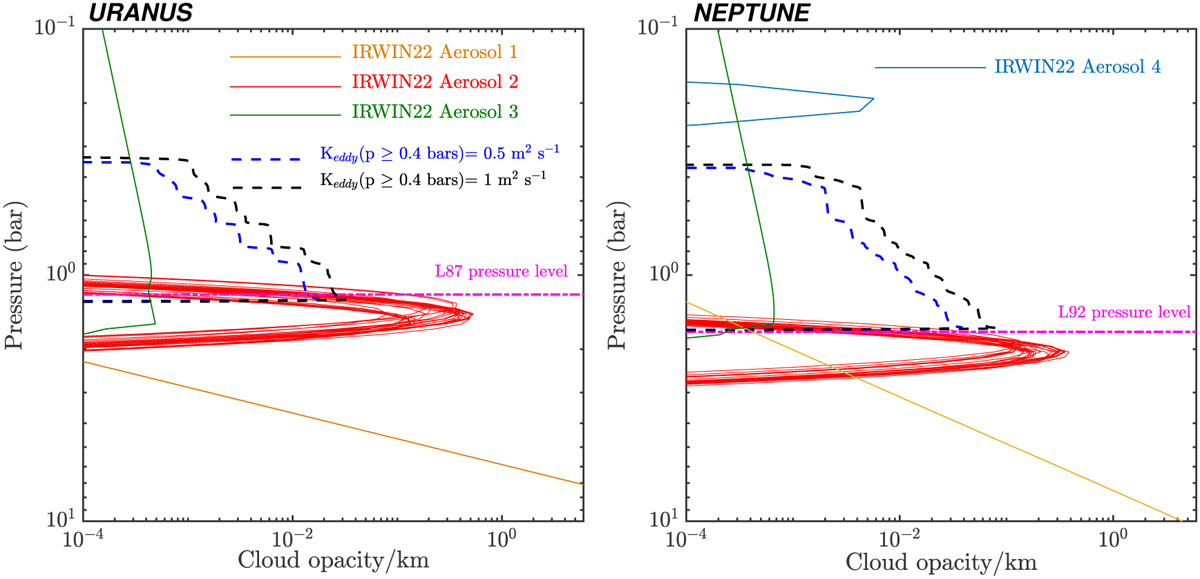
Comparison between Aerosol-2 opacity profiles provided in IRW22 for Uranus and Neptune atmospheres, and the cloud profiles derived from the microphysical simulations for Keddy(p ≥ 0.4 bars) = 0.5 and 1 m2 s−1. The purple dashed lines indicate the pressures where changes in atmospheric refractivity were reported from Voyager 2 data. The figure also displays the Aerosol-1, Aerosol-3, and Aerosol-4 profiles for one of the solutions that fit the observations.
Current usage metrics show cumulative count of Article Views (full-text article views including HTML views, PDF and ePub downloads, according to the available data) and Abstracts Views on Vision4Press platform.
Data correspond to usage on the plateform after 2015. The current usage metrics is available 48-96 hours after online publication and is updated daily on week days.
Initial download of the metrics may take a while.