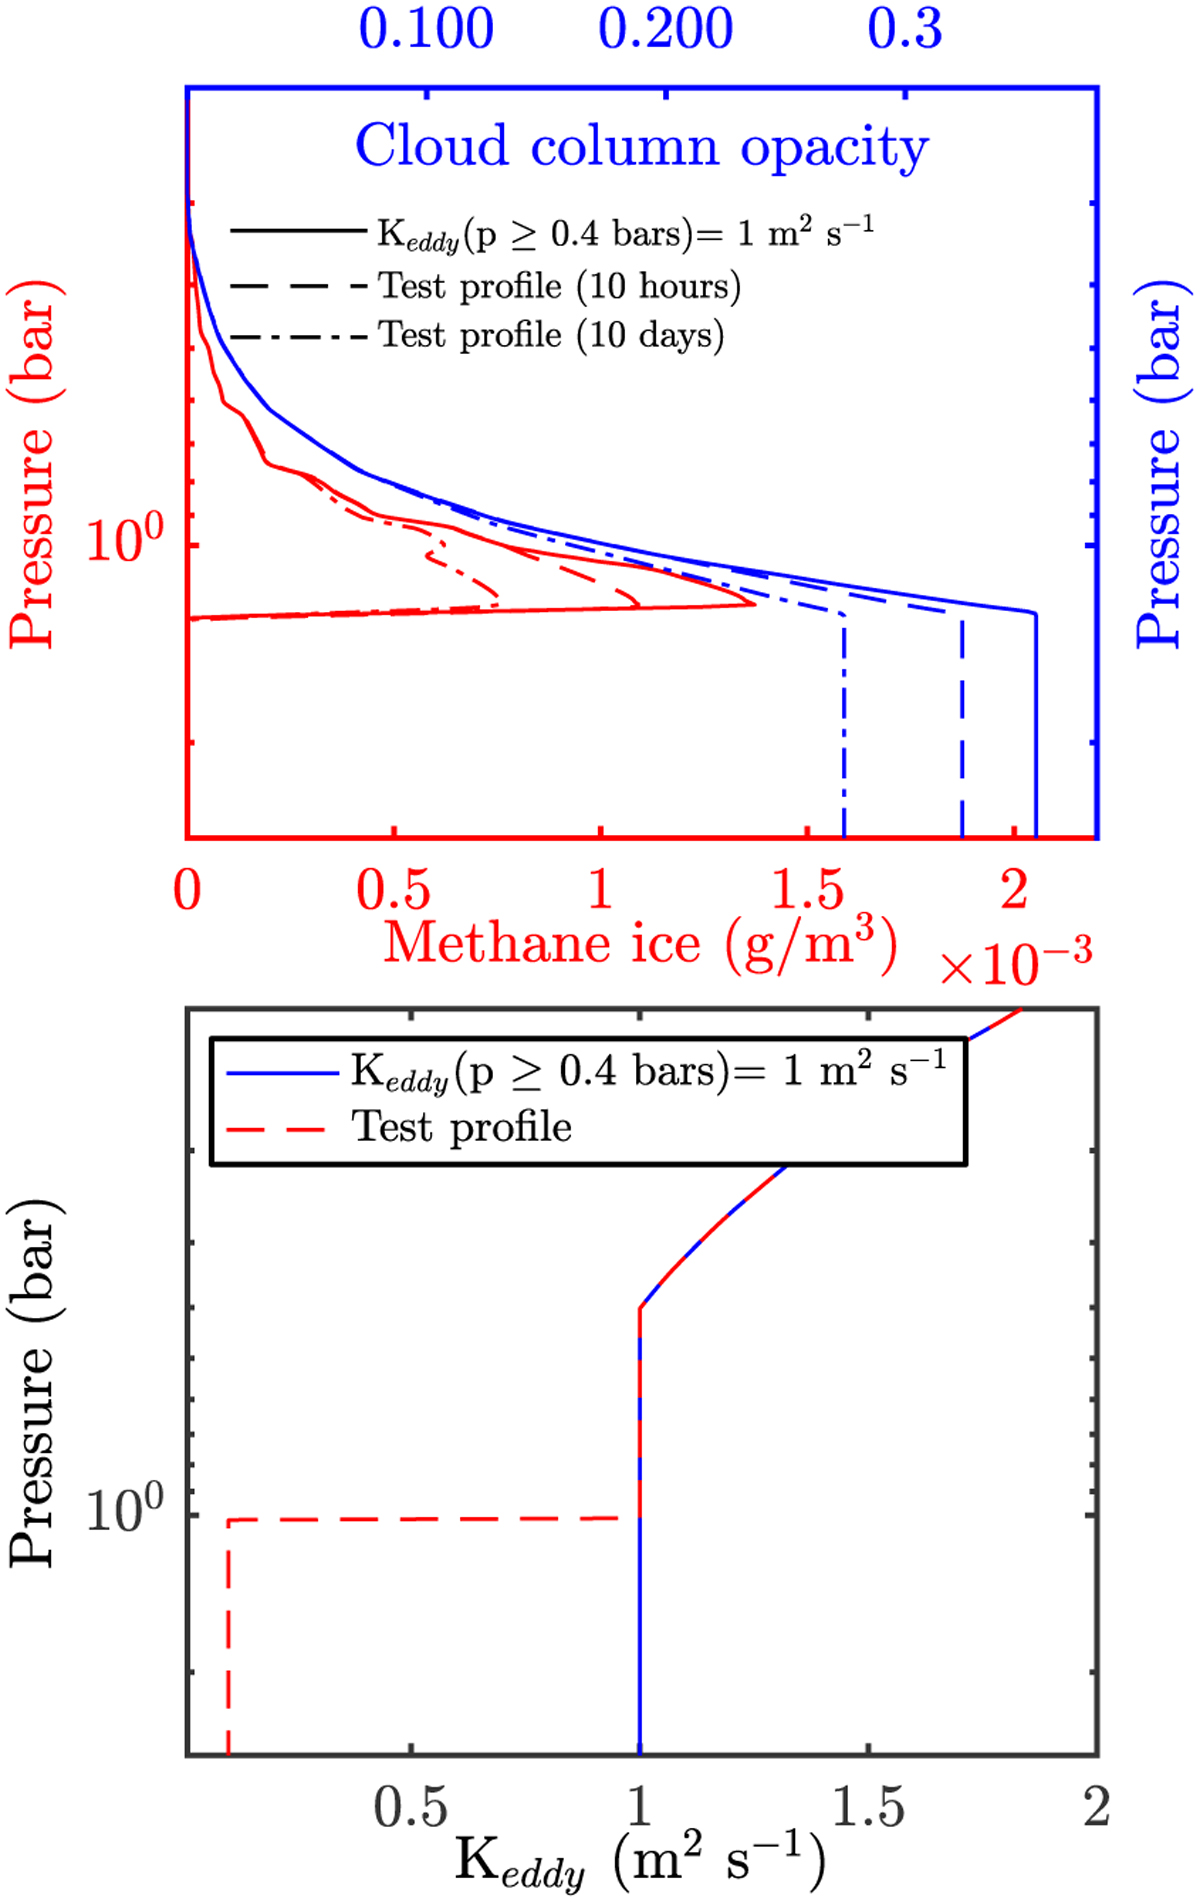
Fig. 6
Download original image
Cloud concentration and total opacity (upper panel) in Uranus atmosphere derived from the microphysical model when Keddy is decreased by a factor of 10 at pressures greater than 1 bar (lower panel). The decrease in Keddy is applied to the steady-state simulations for Keddy (p ≥ 0.4 bars) = 1 m2 s−1 (solid lines in the upper panel). The cloud profiles after 10 hours and 10 days of this decrease are represented by the dashed and dotted lines in the upper panel.
Current usage metrics show cumulative count of Article Views (full-text article views including HTML views, PDF and ePub downloads, according to the available data) and Abstracts Views on Vision4Press platform.
Data correspond to usage on the plateform after 2015. The current usage metrics is available 48-96 hours after online publication and is updated daily on week days.
Initial download of the metrics may take a while.