Fig. 3
Download original image
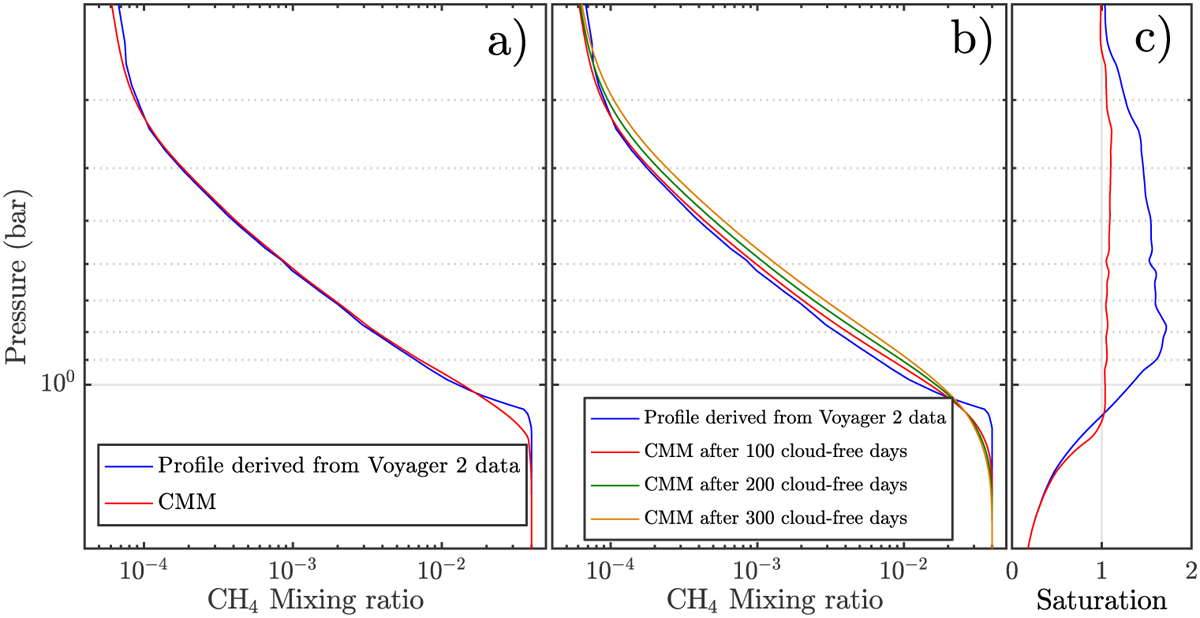
Methane mixing ratio profiles derived from the microphysical model for Uranus atmosphere when methane condensation is included (a) and excluded (b) in the simulations. In all the simulations, we set Keddy(p ≥ 0.4 bars) = 0.5 m2 s−1. For comparison purposes, the profile derived from Voyager 2 data is also displayed. If condensation is not included in the simulations, high supersaturations occur in the troposphere, as shown in panel c, where the red line represents saturation when condensation is included in the simulations. The blue curve represents saturation when condensation is not included in the simulations.
Current usage metrics show cumulative count of Article Views (full-text article views including HTML views, PDF and ePub downloads, according to the available data) and Abstracts Views on Vision4Press platform.
Data correspond to usage on the plateform after 2015. The current usage metrics is available 48-96 hours after online publication and is updated daily on week days.
Initial download of the metrics may take a while.