Fig. 14
Download original image
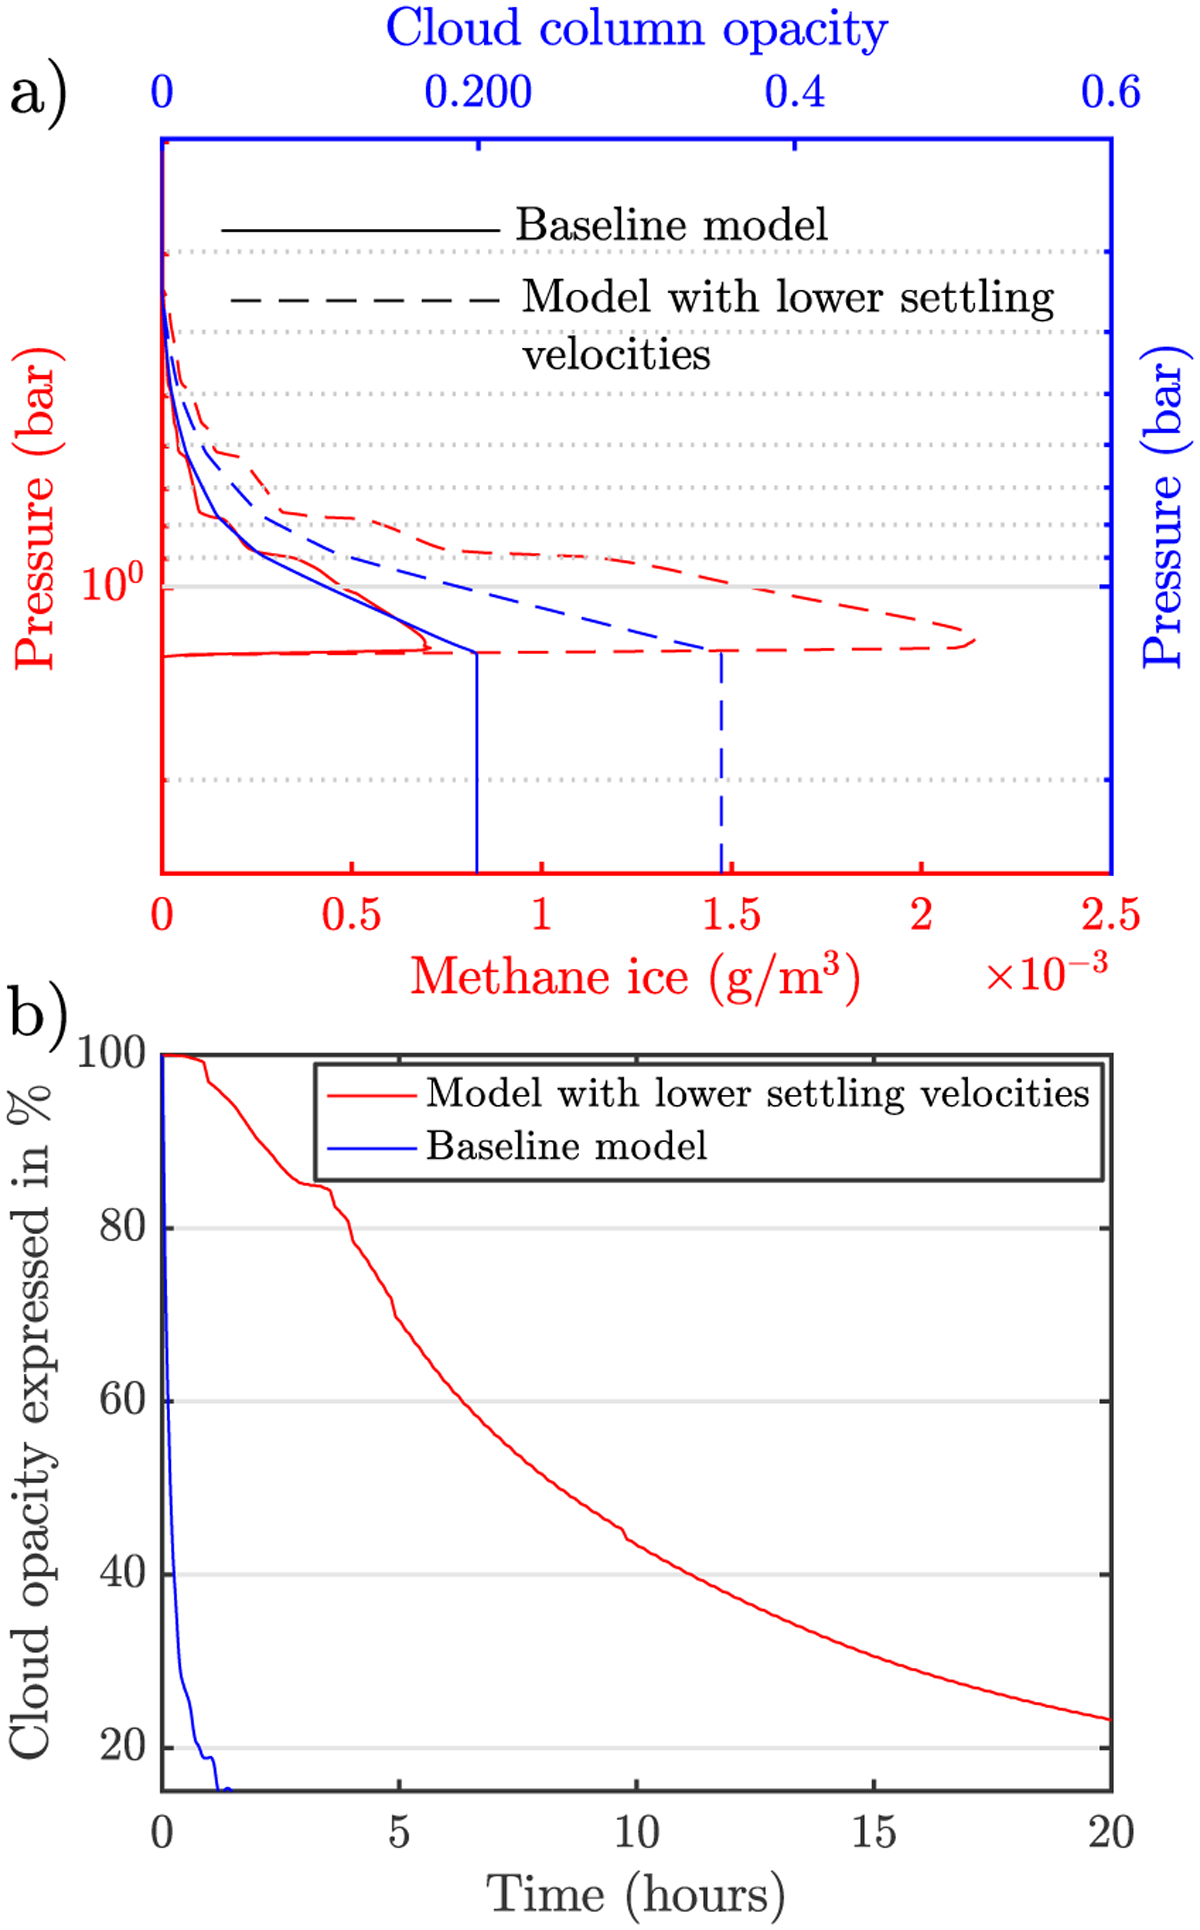
Simulations showing the impact of the droplet setting velocities on the cloud opacity. (a) Vertical profiles of methane ice concentration and cloud column opacity on Uranus derived from CMM for Keddy (p ≥ 0.4 bars) = 0.5 m2 s−1, with droplet settling velocities decreased by a factor of 10. For comparison, the baseline simulation (left panel of Fig. 1) is also shown. (b) Variation of the cloud total opacity over time when Keddy is decreased by a factor of 100 in the simulations shown in (a). Time = 0 represents the moment when the sudden decrease in Keddy is applied in the simulations.
Current usage metrics show cumulative count of Article Views (full-text article views including HTML views, PDF and ePub downloads, according to the available data) and Abstracts Views on Vision4Press platform.
Data correspond to usage on the plateform after 2015. The current usage metrics is available 48-96 hours after online publication and is updated daily on week days.
Initial download of the metrics may take a while.