Fig. 13
Download original image
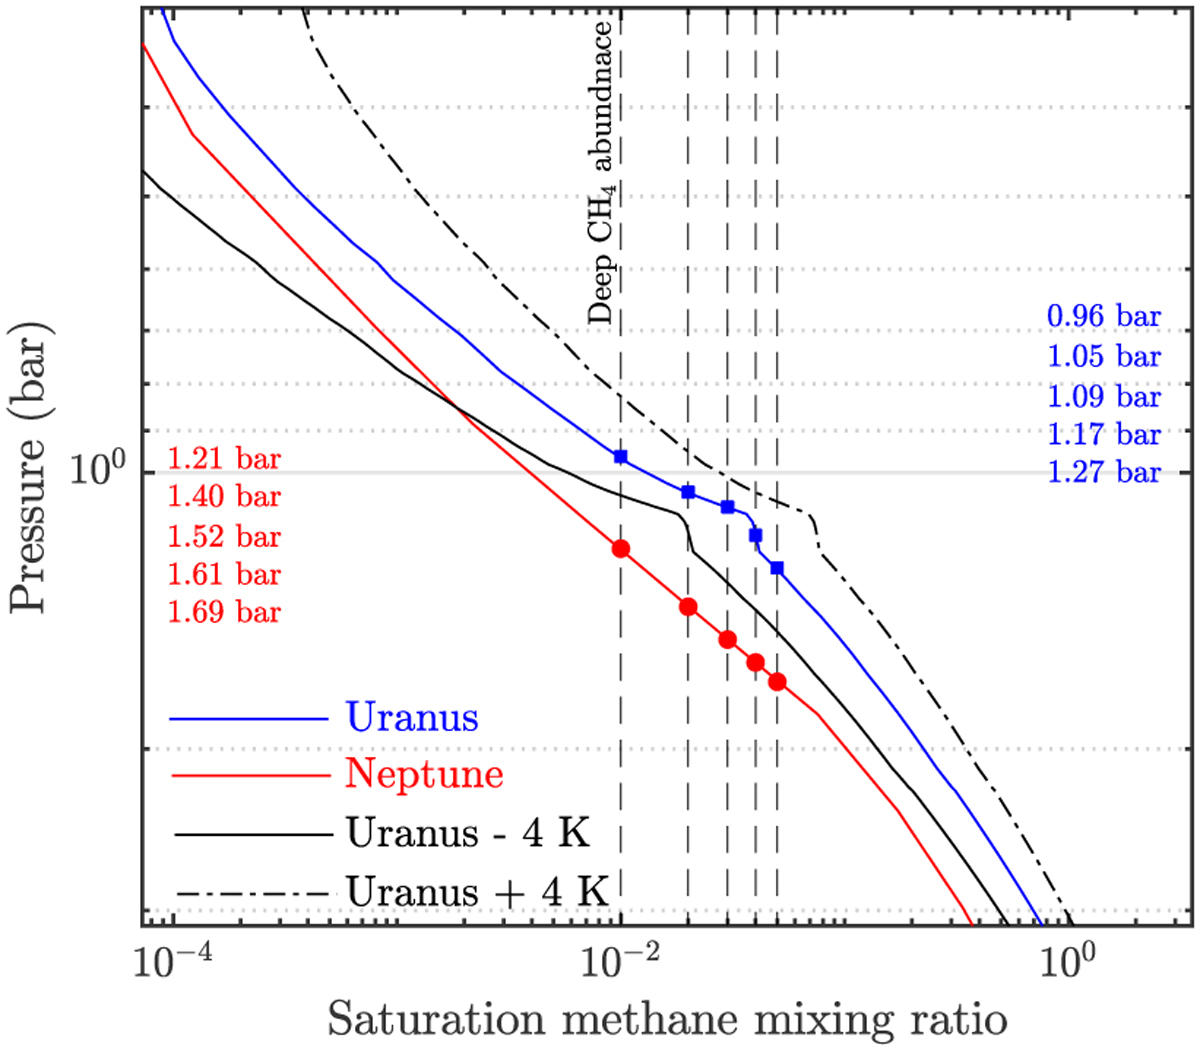
Variation of the saturation methane mixing ratio with pressure computed from the temperature profiles derived from Voyager-2 data. The blue and red dots indicate the pressures where the saturation curves intersect the assumed deep methane abundances (pressures indicated in red and blue on the left and right sides of the figure). The black solid and dotted lines represent the saturation mixing ratio when a ∆T of ±4 K is added to Uranus’ temperature profile.
Current usage metrics show cumulative count of Article Views (full-text article views including HTML views, PDF and ePub downloads, according to the available data) and Abstracts Views on Vision4Press platform.
Data correspond to usage on the plateform after 2015. The current usage metrics is available 48-96 hours after online publication and is updated daily on week days.
Initial download of the metrics may take a while.