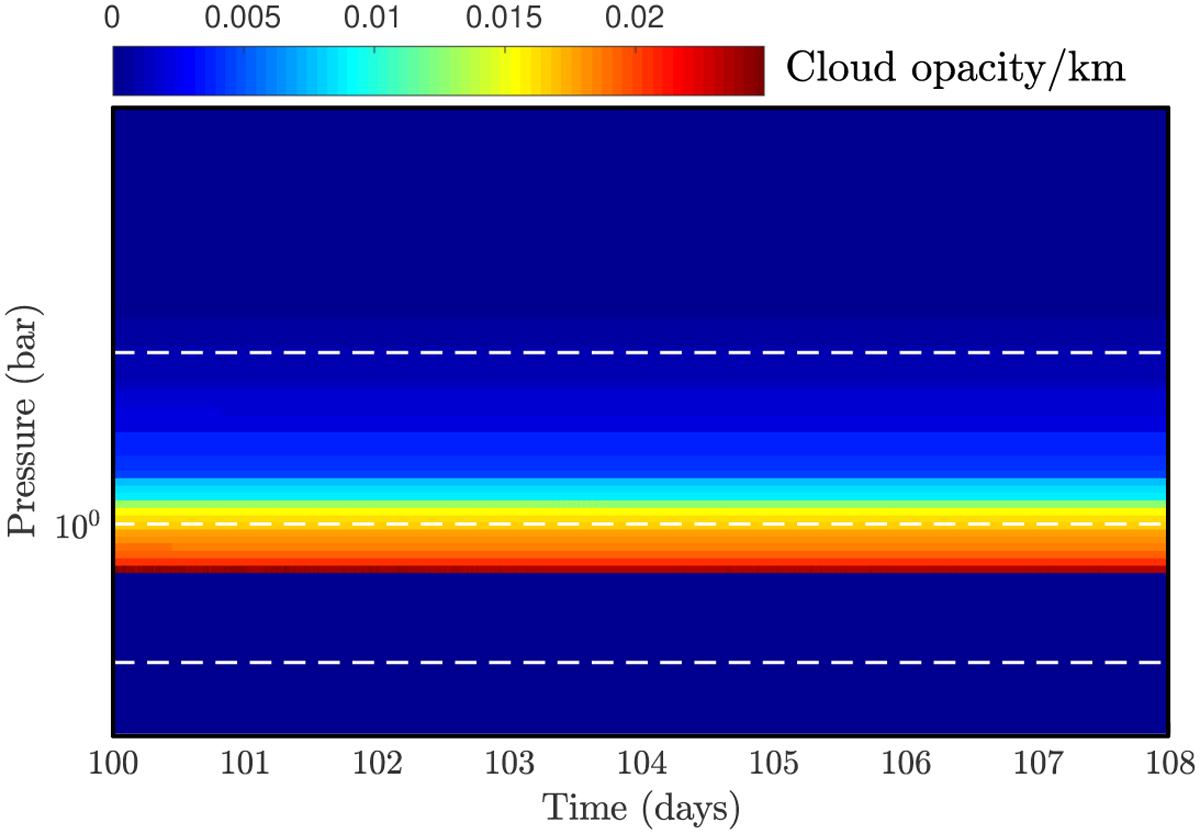
Fig. B.1
Download original image
Contours of methane cloud opacity per km at 0.8 µm over a period of 8 Earth days in Uranus atmosphere, derived from the microphysical model as a function of time (expressed in terrestrial days) and for a constant Keddy (p ≥ 0.4 bars)= 0.5 m2 s−1. The cloud condensation starts by day 16, when saturation reaches values close to 1.08. The cloud based is localized close to 1.24 bars, and the total cloud opacity is ∼0.2 in the visible. Dashed white lines represent the 0.4, 1 and 2-bar levels.
Current usage metrics show cumulative count of Article Views (full-text article views including HTML views, PDF and ePub downloads, according to the available data) and Abstracts Views on Vision4Press platform.
Data correspond to usage on the plateform after 2015. The current usage metrics is available 48-96 hours after online publication and is updated daily on week days.
Initial download of the metrics may take a while.