| Issue |
A&A
Volume 694, February 2025
|
|
|---|---|---|
| Article Number | A26 | |
| Number of page(s) | 10 | |
| Section | Interstellar and circumstellar matter | |
| DOI | https://doi.org/10.1051/0004-6361/202452078 | |
| Published online | 30 January 2025 | |
Dynamic massive star formation: Radio flux variability in UC H II regions
1
National Astronomical Observatories, Chinese Academy of Sciences,
Beijing
100101,
China
2
Key Laboratory of Radio Astronomy and Technology, Chinese Academy of Sciences,
A20 Datun Road, Chaoyang District,
Beijing,
100101,
PR
China
3
School of Physics and Astronomy, University of Leeds,
Leeds
LS2 9JT,
UK
4
Centre for Astrophysics and Planetary Science, University of Kent,
Canterbury
CT2 7NH,
UK
5
Max-Planck-Institut für Radioastronomie (MPIfR),
Auf dem Hügel 69,
53121
Bonn,
Germany
6
Purple Mountain Observatory, and Key Laboratory of Radio Astronomy, Chinese Academy of Sciences,
10 Yuanhua Road,
Nanjing
210023,
China
7
Institute for Frontiers in Astronomy and Astrophysics, Beijing Normal University,
Beijing
102206,
China
8
Department of Astronomy, Tsinghua Univerisity,
30 Shuangqing Road,
Beijing
100084,
China
9
National Radio Astronomy Observatory,
520 Edgemont Road,
Charlottesville,
VA
22903,
USA
★ Corresponding authors; This email address is being protected from spambots. You need JavaScript enabled to view it.
; This email address is being protected from spambots. You need JavaScript enabled to view it.
; This email address is being protected from spambots. You need JavaScript enabled to view it.
Received:
1
September
2024
Accepted:
22
October
2024
Abstract
Context. Theoretical models of early accretion during the formation process of massive stars have predicted that H II regions exhibit radio variability on timescales of decades. However, large-scale searches for such temporal variations with sufficient sensitivity have not yet been carried out.
Aims. Our aim is to identify H II regions with variable radio wavelength fluxes and to investigate the properties of the identified objects, especially those with the highest level of variability.
Methods. We compared the peak flux densities of 86 ultracompact H II (UC H II) regions measured by the GLOSTAR and CORNISH surveys and identified variables that show flux variations higher than 30% over the ~8 yr timespan between these surveys.
Results. We found a sample of 38 variable UC H II regions, which is the largest sample identified to date. The overall occurrence of variability is 44±5%, suggesting that variation in UC H II regions is significantly more common than prediction. The variable UC H II regions are found to be younger than nonvariable UC H II regions, all of them meeting the size criterion of hypercompact (HC) H II regions. We studied the seven UC H II regions that show the highest variability (the “Top7”) with variations >100%. The Top7 variable UC H II regions are optically thick at 4–8 GHz and compact, suggesting they are in a very early evolutionary stage of HC H II or UC H II regions. There is a significant correlation between variability and the spectral index of the radio emission. No dependence is observed between the variations and the properties of the sources’ natal clumps traced by submillimeter continuum emission from dust, although variable H II regions are found in clumps at an earlier evolutionary stage.
Key words: instrumentation: interferometers / stars: formation / HII regions / radio continuum: general
© The Authors 2024
 Open Access article, published by EDP Sciences, under the terms of the Creative Commons Attribution License (https://creativecommons.org/licenses/by/4.0), which permits unrestricted use, distribution, and reproduction in any medium, provided the original work is properly cited.
This article is published in open access under the Subscribe to Open model.
Open Access funding provided by Max Planck Society.
1 Introduction
The canonical picture of the evolution of volumes of gas ionised by massive stars, known as H II regions, is one of smooth expansion of overpressured ionised gas into a quiescent and largely static ambient interstellar medium (e.g., Strömgren 1939; Savedoff & Greene 1955; Krumholz et al. 2009; Churchwell 2002). While this is likely an accurate description for the late stages of H II region expansion, much younger H II regions must contend with dynamic, high pressure and high density surroundings, coupled with high accretion rate flows that are likely to be gravitationally unstable. Recent models of the early stages of H II region formation have shown that these phenomena can have dramatic time variable effects on the ionization of the H II regions, and consequently their radio brightness (e.g., Krumholz et al. 2009; Peters et al. 2010a,b; Klassen et al. 2012; Meyer et al. 2017). Galván-Madrid et al. (2011) calculated the variability of ultracompact (UC) H II regions from the models presented by Peters et al. (2010a) and showed that the radio brightness of around 10% of UC H II regions were expected to vary by more than 10% over a time frame of ten years. An interesting result of the Galvan-Madrid model is that negative variations are possible (i.e. the brightness of an UC H II region may decrease), although positive variations are statistically more likely.
Observational evidence for radio variability of H II regions has been accumulating over the last two decades, beginning from the measurement of the expansion rate of the archetypal UC H II region W3(OH) (Kawamura & Masson 1998) and of G5.89–0.39 (Acord et al. 1998) to several observational studies of individual hypercompact (HC) and UC H II regions (van der Tak et al. 2005; Galván-Madrid et al. 2008; De Pree et al. 2015, 2018). Variability in the widths of radio recombination lines has recently been observed in HC H II regions within W49A (De Pree et al. 2020). Both positive and negative variability have been observed (Galván-Madrid et al. 2008; De Pree et al. 2018). Radio variability seems to be an inherently rare process, with only a handful of confirmed variables; however only a very small fraction of the >1200 known UC or HC H II regions (Urquhart et al. 2022) have been studied for variability and most of these occur in the most extreme star-forming regions in the Galaxy such as Sgr B2 or W49A. We currently do not have samples of sufficient statistical power to test the hypotheses of Galván-Madrid et al. (2011) and fully understand the complex early accretion processes within massive star-forming regions.
In this paper, we present the first statistically significant study of variability in UC H II regions based on the data from two recent 5 GHz radio continuum Galactic Plane surveys, the Coordinated Radio and Infrared Survey for High-Mass Star Formation (The CORNISH survey) (Hoare et al. 2012) and the GLOSTAR survey (Brunthaler et al. 2021). Both of these surveys cover the 10° ≤ l ≤ 60° region of the Galactic Plane, which contains an estimated ~300 UC H II regions (Kalcheva et al. 2018; Yang et al. 2023). CORNISH and GLOSTAR data were acquired in similar configurations with the classic the Very Large Array (VLA) and the extended Karl G. Jansky Very Large Array (JVLA)1, respectively, giving them similar angular resolution, a roughly common central frequency, and the same flux calibration scale. The CORNISH data were taken between 2006 and 2008 and the GLOSTAR B-array data were taken between 2013 and 2016 (see Sect. 2). Thus, these data are well suited to UC H II region variability studies as there is an up eight year baseline between them. Moreover, the higher sensitivity of GLOSTAR allows a more precise recovery of the CORNISH detections.
We describe the CORNISH and GLOSTAR surveys and their respective samples of UC H II regions in Section 2. Our methodology for identifying variable UC H II regions between the two surveys is detailed in Section 3, and the sample of identified variable UC H II regions is presented in Section 4. We discuss the implications of our findings, particularly in the context of the predictions posed by Galván-Madrid et al. (2011), in Section 5 and summarize our conclusions in Section 6.
2 The UC H II region sample
Both GLOSTAR and CORNISH observations were made in the C-band (4–8 GHz) in the B and BnA configurations of the classic VLA (or the upgraded JVLA in the case of GLOSTAR), so the two surveys can be used for a comprehensive comparison of flux densities2. The two flux calibrators 3C286 and 3C48 used in the CORNISH survey (Purcell et al. 2013) and in the GLOSTAR surveys (Brunthaler et al. 2021) are stable with flux density variations below 5%, as shown in Figure 8 in Purcell et al. (2013). The CORNISH survey has baseline lengths ranging from approximately 300 kλ (i.e., ![Mathematical equation: $\[1^{\prime \prime}_\cdot 5\]$](/articles/aa/full_html/2025/02/aa52078-24/aa52078-24-eq1.png) ) to 2kλ (i.e., 2′) in VLA B and BnA arrays and the survey is optimized to detect emission on size scales up to 14″ (Purcell et al. 2013). However, the GLOSTAR survey tapered the uv coverage to have baselines larger than 50 kλ (i.e., detecting emissions with angular size scales up to 4″), resulting in a poorer sampling for extended emission compared to the CORNISH survey. Due to the differences in spatial filtering, angular resolution, and uv coverage, the comparison of the GLOSTAR and CORNISH radio flux densities is only valid for compact sources defined in the two surveys, as addressed by this study.
) to 2kλ (i.e., 2′) in VLA B and BnA arrays and the survey is optimized to detect emission on size scales up to 14″ (Purcell et al. 2013). However, the GLOSTAR survey tapered the uv coverage to have baselines larger than 50 kλ (i.e., detecting emissions with angular size scales up to 4″), resulting in a poorer sampling for extended emission compared to the CORNISH survey. Due to the differences in spatial filtering, angular resolution, and uv coverage, the comparison of the GLOSTAR and CORNISH radio flux densities is only valid for compact sources defined in the two surveys, as addressed by this study.
The GLOSTAR and CORNISH surveys have a considerable overlap across Quadrant I of the Galactic Plane, although the two survey areas are not identical. CORNISH observed a region of the Plane in longitude 10° ≤ ℓ ≤ 65° (Hoare et al. 2012) in its B-configuration, while GLOSTAR observed the longitude range from −2° ≤ ℓ ≤ 60° plus the Cygnus X region, from which the longitude ranges of 2°−40° and 56°−60° are published (Yang et al. 2023; Dzib et al. 2023). Both surveys observed an identical range in latitude (|b| < 1°), and were imaged at similar central frequencies (5 GHz for CORNISH and 5.8 GHz for GLOSTAR), with similar angular resolutions of ![Mathematical equation: $\[1^{\prime \prime}_\cdot 5\]$](/articles/aa/full_html/2025/02/aa52078-24/aa52078-24-eq2.png) for CORNISH and
for CORNISH and ![Mathematical equation: $\[1^{\prime \prime}_\cdot 0\]$](/articles/aa/full_html/2025/02/aa52078-24/aa52078-24-eq3.png) for GLOSTAR. The observed noise levels of GLOSTAR survey are lower, with a median r.m.s. of ~0.08 mJy beam−1, compared to ~0.4 mJy beam−1 for the CORNISH data. In terms of the temporal baseline between the two surveys, CORNISH was observed between 2006 July 12 and 2008 February 4. The GLOSTAR data used in this study were taken between 2013 September 29 and 2016 October 28. The mean separation between the two surveys is approximately eight years.
for GLOSTAR. The observed noise levels of GLOSTAR survey are lower, with a median r.m.s. of ~0.08 mJy beam−1, compared to ~0.4 mJy beam−1 for the CORNISH data. In terms of the temporal baseline between the two surveys, CORNISH was observed between 2006 July 12 and 2008 February 4. The GLOSTAR data used in this study were taken between 2013 September 29 and 2016 October 28. The mean separation between the two surveys is approximately eight years.
Within the overlap region of the published GLOSTAR B-configuration data and the CORNISH coverage, 219 H II regions were detected in the high-reliability catalog (S/N>7σ), including 184 UC H II regions (Purcell et al. 2013; Kalcheva et al. 2018). Among the CORNISH UC H II regions, 56 UC H II regions are compact (defined as sources with angular sizes ≤1.8″ in Purcell et al. 2013) and not associated with over-resolved emission structures. In the overlap region, GLOSTAR detected 353 H II regions due to the better sensitivity, and 227 of them are compact (i.e., UC H II regions), defined as sources with Yfactor < 2 in GLOSTAR (Dzib et al. 2023; Yang et al. 2023), where the Yfactor is defined as the numerical ratio between integrated flux density (or flux) and peak flux density (or brightness). The identification process of variable H II regions is based on comparing peak flux densities in the two UC H II region samples. The peak flux densities are used for comparison for the following reasons. First, the integrated flux densities of UC H II regions are affected by different configurations and uv coverage of VLA. This is because the UC H II regions are not perfectly unresolved and have a hierarchical structure of ionized gas in complex environments and their observed angular sizes are thus always similar to the beam sizes under different beams, as seen in Yang et al. (2019b, 2021). The flux density of compact sources with sizes comparable to the beam size would be affected by the uv coverage, as seen in Figure 15 of Plunkett et al. (2023). Additionally, the peak flux averaged over the beam rather than the entire source is commonly used for the measurements of UC H II regions in complex regions (e.g., Wood & Churchwell 1989). In addition, many UC H II regions are detected by GLOSTAR above 7σ, but are not detected by CORNISH above 7σ, which makes it difficult to accurately measure their integrated flux densities from CORNISH, as outlined in Sect. 3.
3 Identification of Variable H II Regions
We defined a sample of variable UC H II regions based on the ratios of peak flux densities measured in the GLOSTAR and CORNISH surveys that are not over-resolved in complex emission regions. To allow a meaningful comparison of the peak flux densities of compact sources, the GLOSTAR images were smoothed to match the CORNISH beam size of ![Mathematical equation: $\[1^{\prime \prime}_\cdot 5\]$](/articles/aa/full_html/2025/02/aa52078-24/aa52078-24-eq4.png) . The slight differences in observational parameters between the two surveys result in differences in the Fourier-space sampling (Perley et al. 1989), and the center frequencies. We conservatively estimate that any flux changes under the 10% level might be questionable, as discussed by Galván-Madrid et al. (2011). To ensure that we only consider true variability in the sample, we define an UC H II region as a variable if its peak flux densities measured in the data from the two surveys have a greater than 30% variation fraction (defined below).
. The slight differences in observational parameters between the two surveys result in differences in the Fourier-space sampling (Perley et al. 1989), and the center frequencies. We conservatively estimate that any flux changes under the 10% level might be questionable, as discussed by Galván-Madrid et al. (2011). To ensure that we only consider true variability in the sample, we define an UC H II region as a variable if its peak flux densities measured in the data from the two surveys have a greater than 30% variation fraction (defined below).
A UC H II region is considered to be variable if it satisfies any of the following criteria:
- (1)
The peak flux densities between GLOSTAR (S peakG) and CORNISH (S peakC) exhibit a variation fraction |fvar| greater than 30%, where fvar = (S peakG − S peakC)/S peakC, or the flux ratio S peakG/S peakC higher than 1.3 or lower than 0.7.
- (2)
A source is detected in CORNISH above 7σ, but is not detected by GLOSTAR at the 7σ level; σ is the local r.m.s. noise level, with |fvar| > 30%.
- (3)
A source is detected in GLOSTAR above 7σ, but is not detected by CORNISH at 7σ, and the GLOSTAR peak S peakG is higher than the local CORNISH detection limit (i.e., 3σ), with |fvar| > 30%.
Among the 227 UC H II regions in GLOSTAR (see Section 2), 56 of them are detected by CORNISH above 7σ. Criterion (1) results in 22 (39.2%, 22/56) variable UC H II regions detected by GLOSTAR and CORNISH above 7σ, as shown in the top panel of Figure 1. As all compact CORNISH UC H II regions are detected in the GLOSTAR B-configuration images (Dzib et al. 2023; Yang et al. 2023), no source meets criterion (2). From 171 UC H II regions detected by GLOSTAR above 7σ but not detected by CORNISH above 7σ, we cannot determine the flux variations for 141 sources (82%, 141/171) using the two surveys as these sources are below the 3σ local detection level of CORNISH (σ is the local r.m.s. of CORNISH) and their flux densities in CORNISH cannot be estimated. This leaves a sample of 30 UC H II regions higher than the 3σ local detection level of CORNISH that can be used to measure fvar in criterion (3). To calculate the variations of compact H II regions meeting criterion (3), we measured their peak flux densities and local r.m.s. noise level (σ) from the CORNISH images at the position of each source. If the local peak flux density value is less than or equal to 3σ, the 3σ is used as the upper limit of the CORNISH peak, as illustrated in panel b of Figure 1. If the local peak value is greater than 3σ, the local peak value is considered the CORNISH peak, as illustrated in panel c and panel d of Figure 1. The determined CORNISH peak was used to estimate the flux density variation fvar. This results in 16 out of the 30 sources in criterion (3) that have variation fractions |fvar| > 30%.
4 Results
From the criteria outlined in the previous section, we obtained a sample of 38 UC H II regions with variation fraction |fvar| > 30%, including 22 sources from criterion (1) and 16 sources from criterion (3). Figure 2 shows the distribution of flux ratios between GLOSTAR and CORNISH for all 86 sources (white) that can be assessed using the three criteria and the 38 variable UC H II regions (gray shaded) identified by this study. We display the GLOSTAR and CORNISH images at 5 GHz for the 38 variable sources in Figure 7.
Table 1 lists the physical properties of the seven most variable H II regions, and the full table for the 38 variable sources is available at the CDS. The source angular size θS given in Column 8 was derived from the geometric mean of the major and minor axes ![Mathematical equation: $\[\sqrt{\theta_{major} \times \theta_{minor}}\]$](/articles/aa/full_html/2025/02/aa52078-24/aa52078-24-eq5.png) . The GLOSTAR peaks SpeakG, and the major (θmajor) and minor (θminor) axes were measured from the GLOSTAR smoothed images by 2D Gaussian fit using AEGEAN (Hancock et al. 2012), and the deconvolved sizes
. The GLOSTAR peaks SpeakG, and the major (θmajor) and minor (θminor) axes were measured from the GLOSTAR smoothed images by 2D Gaussian fit using AEGEAN (Hancock et al. 2012), and the deconvolved sizes ![Mathematical equation: $\[\theta_{dcon}=\sqrt{\theta_{S}^{2}-beam^{2}}\]$](/articles/aa/full_html/2025/02/aa52078-24/aa52078-24-eq6.png) were determined by the strategy used in previous studies for compact and young H II regions (e.g., Purcell et al. 2013; Yang et al. 2021; Patel et al. 2023, 2024). The distances of natal clumps in Table 1, together with their bolometric temperature, luminosity, and mass, were measured by the 870 μm APEX Telescope Large Area Survey of the Galaxy (ATLASGAL Schuller et al. 2009) by Urquhart et al. (2018, 2022) and Hi-GAL (Elia et al. 2021). The remaining properties in Table 1 are from GLOSTAR (e.g., Brunthaler et al. 2021; Dzib et al. 2023; Yang et al. 2023) and CORNISH (Hoare et al. 2012; Purcell et al. 2013; Kalcheva et al. 2018).
were determined by the strategy used in previous studies for compact and young H II regions (e.g., Purcell et al. 2013; Yang et al. 2021; Patel et al. 2023, 2024). The distances of natal clumps in Table 1, together with their bolometric temperature, luminosity, and mass, were measured by the 870 μm APEX Telescope Large Area Survey of the Galaxy (ATLASGAL Schuller et al. 2009) by Urquhart et al. (2018, 2022) and Hi-GAL (Elia et al. 2021). The remaining properties in Table 1 are from GLOSTAR (e.g., Brunthaler et al. 2021; Dzib et al. 2023; Yang et al. 2023) and CORNISH (Hoare et al. 2012; Purcell et al. 2013; Kalcheva et al. 2018).
4.1 The variable sample
Among the 38 variables, 22 sources show a variation fraction >50%. Nine sources exhibit the highest variability, with a variation fraction of ≥100%, indicating a peak flux density ratio between GLOSTAR and CORNISH greater than 2.0 or less than 0.5.
Kalcheva et al. (2018) compared images from CORNISH and 6 cm data compiled by White et al. (2005) from various VLA survey efforts, and found a total of nine variable UC H II regions. We identified three of these sources, namely G011.978600.0973, G014.5987+00.0198, and G025.7156+00.0487, as variable sources. The flux density ratios by Kalcheva et al. (2018) for these three sources are roughly twice as large as the values we find. This is expected since the time baseline in Kalcheva et al. (2018) is 15 years compared to 8 years in this work. We discarded three other sources, G16.3913-00.1382, G30.7579+00.2042, and G30.7661-00.0348, because they are extended. For the remaining three sources, namely G11.0328+00.0274, G23.4553-00.2010, and G37.7347-00.1128, we find no significant changes between the CORNISH and GLOSTAR observations, even though the latter two are reported with very large changes in Kalcheva et al. (2018). However, these three sources were not detected in the earlier 6 cm data from White et al. (2005), and the variability estimates were based on upper limits. Since the CORNISH and GLOSTAR observations are much more similar than the earlier 6 cm observations with a lower spatial resolution, we do not consider these three sources as variable. Furthermore, we note that our sample of variables comprises 8 out of the 13 variable H II regions reported by Dzib et al. (2023) and Yang et al. (2023) with 5 variable sources were excluded because they are over-resolved in complex emission structures, as outlined in Section 2.
The spectral indices between 4 GHz and 8 GHz for the 38 variables were measured by the GLOSTAR survey (Yang et al. 2023). In Figure 3, we can see that the 38 variables show a wide range of spectral indices from −1.8 to +1.6. It is evident that all sources with a spectral index above α4–8 GHz ≳ −0.1 (i.e., consistent with optically thin or thick free-free emission), rise in flux density in the eight years between the CORNISH and GLOSTAR observations. On the other hand, the flux densities of sources with spectral indices below −0.1 can be increasing or decreasing. Because of their spectral index, these sources are likely to contain significant nonthermal emission (e.g., from a variable radio jet) as discussed in Yang et al. (2023). Considering the larger uncertainty in the spectral index in GLOSTAR for weak sources (Yang et al. 2023), additional multi-band observations are required to accurately determine their spectra. However, such analysis is beyond the scope of the current study.
Among the most variable sources with flux density ratios below 0.5 or above 2, two sources showed a decrease in flux density between the CORNISH and GLOSTAR observations. However, these two sources (G023.1974-00.0005 and G028.4518+00.0029) also have a negative spectral index α4–8 GHz < −0.5 as shown in Figure 3 and thus are likely to be contaminated by radio jets in the star-forming regions, as discussed in Yang et al. (2023). The nonthermal radio jets with negative spectral index are reported in Anglada et al. (2018), and Obonyo et al. (2024) found 50% of radio jets from massive protostars emit nonthermal radiation based on the data from the SARAO MeerKAT Galactic Plane Survey (Goedhart et al. 2024). The remaining seven variables exhibiting the highest variability (hereafter Top7) show positive spectra and have a flux density increase from CORNISH to GLOSTAR, as shown in Figure 3.
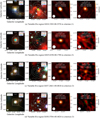 |
Fig. 1 Examples of multi-band images of variable H II regions identified by criteria (1)–(3) in Sect. 3. We found that no source meets criterion (2). From top to bottom: (a) Example of a variable H II region that meets criterion (1); (b–d) Examples of variable H II regions that meet criterion (3): (b) using 3σ as the upper limit of the CORNISH peaks to estimate the variation if 3σ is higher than the local peak; (c) and (d) using the local peak of the source to estimate the variation if the local peak is higher than 3σ; From left to right: Three-colors composition image of Hi-GAL (red = 250 μm, green = 160 μm, blue = 70 μm), GLIMPSE (red = 8.0 μm, green = 4.5 μm, blue = 3.6 μm), radio image of GLOSTAR and CORNISH at 5 GHz. The noise level of CORNISH is 0.33 mJy beam−1. The white circles in the lower left corner of each image show the FWHM beams of Hi–GAL (12″ at 160 μm), GLIMPSE (2″), GLOSTAR (its B-configuration smoothed to 1.5″) and CORNISH (1.5″). The gray contours in the left two panels show the ATLASGAL emissions at 870 μm. The lime contours in the middle and right panels show the radio emission of GLOSTAR. The image size is indicated at the top of each figure centered at the coordinates of each H II region. The GLOSTAR images have been smoothed to match the beam size of 1.5″ in CORNISH. |
Variables observed in the GLOSTAR and CORNISH for 10° < ℓ < 40° and 56° < ℓ < 60° with |b| < 1°.
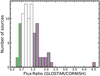 |
Fig. 2 Distribution of flux ratio between GLOSTAR and CORNISH for the 86 UC H II regions (white shaded) that can be assessed using criteria (1)–(3). This gives 38 variable UC H II regions (gray shaded) with flux variation fraction |fvar| > 30%, which includes the purple area for those with flux ratio > 1.3 (or fvar > 30%) and the green area for those with flux ratio <0.7 (or fvar < −30%). The bin size is 0.15. |
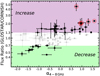 |
Fig. 3 Flux ratio between GLOSTAR and CORNISH as a function of the GLOSTAR spectral index at 4–8 GHz of the 86 sources, including 38 variables (black dots) with |fvar| > 30% and the remaining 48 sources (gray dots) with |fvar| < 30%, as defined in Sect. 3. The purple shaded area includes the variables with flux increase and the green shaded area includes the variables with flux decrease, as outlined in Figure 2. The red circles display the Top7 variable UC H II region (see Sect. 4.1 for details), six of which have reliable spectral indices listed in Table 1. |
4.2 The occurrence of variability in UC H II regions
Out of the 227 UC H II regions detected in the GLOSTAR survey, 86 sources are suitable for analyzing variability based on criteria (1)–(3), resulting in 38 variable sources. This gives an overall occurrence of variability in our UC H II region sample of 44±5% (38/86). The uncertainties of the fractions are calculated from the standard error of binomial distribution of fraction f, (i.e., ![Mathematical equation: $\[\sqrt{f *(1-f /(num))}\]$](/articles/aa/full_html/2025/02/aa52078-24/aa52078-24-eq8.png) , where num is the sample size of 86 in this study). Taking into account the uncertainty, the fraction of UC H II regions with radio continuum flux variations appears to be somewhat consistent with the fraction of infrared continuum variability of 32.5% observed in the sample of 2230 star-forming clumps studied by Lu et al. (2024) based on the NEOWISE database (Mainzer et al. 2011). The observed fraction of 44% is larger than the predicted ~10% of observed Hir regions that should have detectable flux variations on timescales of ~10 yr in Galván-Madrid et al. (2011). In the simulation of radio continuum flux variation of UC H II regions in Galván-Madrid et al. (2011) for Run A with a single sink, they predicted that 16.7±2.9%, 6.8±1.9%, and 4.7±1.6% are expected to have flux increments larger than 10%, 50%, and 90%, respectively, for two observations separated by 10 yr. The more realistic Run B for a single sink with additional collapse events and cluster formation in Galván-Madrid et al. (2011) predicts a smaller fraction of variable UC H II regions compared to Run A: 6.9±1.6%, 0.3±0.3%, and 0.0% of them are expected to have flux increments larger than 10%, 50%, and 90%, respectively. In this study we found much higher fractions of 50.0±5%, 23.3± 4%, and 8.1±3%, showing flux increments exceeding 10%, 50%, and 90%. Therefore, variable UC H II regions could be significantly more common than predicted. Given that the models used in Galván-Madrid et al. (2011) to simulate the radio flux variation of UC H II regions do not include the effect of radio jets, the higher fraction of variable UC H II regions found in this work support that the variable sample is contaminated by radio jets in star-forming regions, as discussed above. It is important to note that the difference in wavelengths between simulations (2 cm) in Galván-Madrid et al. (2011) and observations (6 cm) in this study may contribute to the inconsistency in variation fractions. This is because the origin of observed variations could be due to the density structures of young H II regions and their intermediate to large optical depths, as mentioned in Peters et al. (2010a,b) and Galván-Madrid et al. (2011). The young H II regions are more optically thick with higher optical depths at the observation at 6 cm compared to the simulation at 2 cm. A comparison between simulations and observations in the same frequency is thus needed to understand the discrepancy, however, this analysis is beyond the scope of the current study.
, where num is the sample size of 86 in this study). Taking into account the uncertainty, the fraction of UC H II regions with radio continuum flux variations appears to be somewhat consistent with the fraction of infrared continuum variability of 32.5% observed in the sample of 2230 star-forming clumps studied by Lu et al. (2024) based on the NEOWISE database (Mainzer et al. 2011). The observed fraction of 44% is larger than the predicted ~10% of observed Hir regions that should have detectable flux variations on timescales of ~10 yr in Galván-Madrid et al. (2011). In the simulation of radio continuum flux variation of UC H II regions in Galván-Madrid et al. (2011) for Run A with a single sink, they predicted that 16.7±2.9%, 6.8±1.9%, and 4.7±1.6% are expected to have flux increments larger than 10%, 50%, and 90%, respectively, for two observations separated by 10 yr. The more realistic Run B for a single sink with additional collapse events and cluster formation in Galván-Madrid et al. (2011) predicts a smaller fraction of variable UC H II regions compared to Run A: 6.9±1.6%, 0.3±0.3%, and 0.0% of them are expected to have flux increments larger than 10%, 50%, and 90%, respectively. In this study we found much higher fractions of 50.0±5%, 23.3± 4%, and 8.1±3%, showing flux increments exceeding 10%, 50%, and 90%. Therefore, variable UC H II regions could be significantly more common than predicted. Given that the models used in Galván-Madrid et al. (2011) to simulate the radio flux variation of UC H II regions do not include the effect of radio jets, the higher fraction of variable UC H II regions found in this work support that the variable sample is contaminated by radio jets in star-forming regions, as discussed above. It is important to note that the difference in wavelengths between simulations (2 cm) in Galván-Madrid et al. (2011) and observations (6 cm) in this study may contribute to the inconsistency in variation fractions. This is because the origin of observed variations could be due to the density structures of young H II regions and their intermediate to large optical depths, as mentioned in Peters et al. (2010a,b) and Galván-Madrid et al. (2011). The young H II regions are more optically thick with higher optical depths at the observation at 6 cm compared to the simulation at 2 cm. A comparison between simulations and observations in the same frequency is thus needed to understand the discrepancy, however, this analysis is beyond the scope of the current study.
5 Properties of variable UC H II regions
5.1 UC H II region properties
Figure 3, shows a strong correlation between the spectral index α4–8 GHz and the flux ratio between GLOSTAR and CORNISH with a Spearman’s rank coefficient ρ = 0.6 and p-value ≪ 0.001, indicating that variable sources with steeper spectral indices (both negative and positive) have larger variations.
This trend, where steeper spectral indices are associated with higher variations, is also significant when compared against the entire sample of GLOSTAR UC H II regions with measured in-band spectral indices. In the lower panel of Figure 4, we present the cumulative distributions of the spectral indices for all GLOSTAR UC H II regions (GLOSTAR is used here as it has the measured spectral index), our variable sample, and the Top7 variable objects. A Kolmogorov–Smirnov (K–S) test allows us to reject the null hypothesis that variable UC H II regions and GLOSTAR UC H II regions are drawn from the same parent population (p-value = 0.07).
We also observe significant evidence of higher variability in smaller UC H II regions, in the top panel of Figure 4 where we plot the cumulative distributions of physical diameters diam for the whole CORNISH UC H II sample (CORNISH is used here as it has the measured physical diameters for UC H II regions), the variable UC H II regions, and our Top7 most variable sources in this work. A K–S test again allows us to reject the null hypothesis that the variable UC H II sample and the CORNISH UC H II sample are drawn from the same parent population with a p-value ≪0.001. We note that many variable UC H II regions are unresolved and have only upper limits to their diameters; however, these upper limits show that 100% of them are consistent with the expected diameters of HC H II regions (i.e., ≤0.05 pc).
The spectral index and diameter trend both support the hypothesis that variability is greater in younger UC H II regions. Positive spectrum UC H II regions are among the youngest as they evolve from optically thick to optically thin emission (e.g., HC H II regions; Yang et al. 2019a, 2021). Similarly, even though young H II regions may collapse and change brightness as they evolve (Peters et al. 2010a), the overall picture is one of expansion over time. Our variable UC H II region sample and the Top7 variable UC H II regions are among the youngest UC H II regions to be discovered. This is consistent with the theoretical picture presented by Peters et al. (2010a,b), where UC H II regions undergo frequent changes in brightness early on in their evolution as they fluctuate between gravitationally trapped and extended states. Alternatively, as young H II regions evolve, their turnover frequency between optically thick and optically thin regimes decreases (Kurtz 2005; Yang et al. 2021; Patel et al. 2023). Consequently, it is possible that the flux density at an optically thick frequency increases, resulting from an evolution transition to optically thinner conditions. However, the flux variations due to this transition of young H II regions from the classical model are tiny on such a short timescale of ~8 yr.
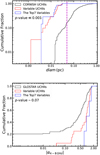 |
Fig. 4 Cumulative distributions of the physical diameter (top panel) and the spectral index α4–8 GHz (bottom panel) for the Top7 (blue) and variable UC H II regions (red) of this work, and for the UC H II regions (black) from the GLOSTAR (Yang et al. 2023) or CORNISH (Kalcheva et al. 2018). A total of 32 of the 38 variable UC H II regions have their distances measured in Urquhart et al. (2018). The magenta line indicates diam=0.05 pc, i.e., the size criterion of the HC H II regions. This indicates that 100% of variable sources in this study meet the size criterion of HC H II regions. As the uncertainty in spectral index σα is large for weak sources in GLOSTAR (Yang et al. 2023), we limit the sources with σα < 0.1 here for α comparison. |
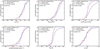 |
Fig. 5 Cumulative distributions of the clump properties such as bolometric luminosity Lbol, mass Mclump, luminosity-to-mass ratio Lbol/Mclump, surface density Σ, bolometric temperature Tbol, and clump free-fall times tff for the natal clumps of the Top7 variables (blue) and variable UC H II regions (red) from this work, as well as the GLOSTAR UC H II regions (black) and CORNISH UC H II regions. |
5.2 Clump properties
In Figs. 5 and 6, we present the distributions of the clump properties: the bolometric luminosity Lbol, clump mass Mclump, luminosity-to-mass ratio Lbol/Mclump, bolometric temperature Tbol, surface density ∑, and the clump free-fall time tff (Urquhart et al. 2018, 2022) of the natal clouds for the variable UC H II regions (red), the Top7 variable UC H II regions (blue), and the total UC H II region sample (back-grey) from CORNISH and GLOSTAR. Figure 6 suggests that the natal clumps of variable UC H II regions do not exhibit any distinctive properties. This is also supported by the cumulative distributions of the clump properties such as Lbol, Mclump, Tbol, ∑, and tff in Figure 5, with p-values ≥ 0.4 from the K–S tests between the two samples of variable UC H II regions and the total UC H II region sample. However, significant differences are found in the Lbol/Mclump and Tbol with p-value ≪0.001 between the two samples. The natal clumps of the variable UC H II regions are found to have lower values of Lbol/Mclump and Tbol, indicating that they are in earlier evolutionary stages with a lower bolometric temperature (details see the evolutionary stages of the clumps classified in König et al. 2017 and Urquhart et al. 2022), compared to the natal clumps of the whole sample of UC H II regions. This suggests that the variability observed in the UC H II regions is not related to the physical properties of clumps, but is significantly linked to the evolutionary stages of clumps, preferably occurring in the early stages of massive star formation.
Among the 38 variable UC H II regions, outflow searches were conducted in 26 of their natal clumps in Yang et al. (2018, 2022a), 15 (58%=15/26) of them are found to be associated with molecular outflows, and 45% (17/38) of them are found to be associated with methanol masers from the GLOSTAR survey (Nguyen et al. 2022).
Among the Top7 variable UC H II regions, five of their natal clumps have outflow searching, 60% (3/5) are found to be associated with molecular outflow clumps in Yang et al. (2018, 2022a), and 88% (6/7) are found to be associated with methanol maser emissions from the GLOSTAR survey (Nguyen et al. 2022). From the total GLOSTAR H II regions sample, we found a smaller percentage of ~37% (146/390) associated with methanol masers and a similar fraction of ~56% (151/272, where 272 have their natal clumps with outflow searching) associated with outflows, compared to the variable UC H II region sample in this study. Given that outflows and methanol masers are indicative of early evolutionary stages of massive star formation (e.g., Menten 1991; Chen et al. 2011; Qiu et al. 2009; Yang et al. 2022b; Luo et al. 2023; Mai et al. 2024), this provides further evidence that the variable UC H II regions sample and the Top7 are in the very early stage of UC H II regions. This is also supported by the fact that all of the variable UC H II regions in this study are found to meet the size criterion of HC H II regions, and some of which are identified as HC H II regions in Yang et al. (2021).
Additionally, all of the natal clumps exhibit no infrared variability, with one exception. The natal clump AGAL036.87800.474 displays infrared variability as observed by Lu et al. (2024) based on the NEOWISE database. A connection between the radio flux density and the natal clumps would be interesting for future exploration.
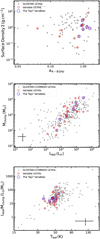 |
Fig. 6 Comparison of clump properties of the total UC H II regions and variable UC H II regions. Top panel: spectral index α4–8 GHz UC H II regions vs. the surface densities of their natal clumps for the variable sample (red circles), and the Top7 (blue circles) (6 with reliable α in Table 1), and the total UC H II regions (gray dots) from GLOSTAR (only GLOSTAR here as it has the measured spectral index). Middle panel: bolometric luminosity vs. the clump mass of the natal clumps for the variable UC H II regions, the Top7, and the total UC H II regions of CORNISH and CORNISH. Bottom panel: bolometric temperature vs. the luminosity-to-mass ratio of the natal clumps for the variable UC H II regions, the Top7 variable UC H II regions, and the GLOSTAR and CORNISH UC H II regions. The error bars in each figure correspond to a typical uncertainty of these parameters: 0.2 for α (Yang et al. 2023), 25% for Tbol, 50% for Lbol, Mclump, and Lbol/Mclump (Urquhart et al. 2018, 2022). |
5.3 The most variable UC H II region
From Figure 3, Table 1 and Figure 7, we observe that the UC H II region G010.4629+00.0299 exhibits the highest variability, with its flux increasing from 2.44 mJy in CORNISH to 11.15 mJy in GLOSTAR, giving a more than fourfold increase over a timescale of eight years. Flux changes have been reported on several HC H II regions and UC H II regions over timescales of several years (Franco-Hernández & Rodríguez 2004; van der Tak et al. 2005; Galván-Madrid et al. 2008; De Pree et al. 2015; Rivilla et al. 2015; Brogan et al. 2018; Hunter et al. 2018; De Pree et al. 2018, 2020), showing typical variations of approximately 20–50%, with no reported examples of flux variations exceeding 100%. This makes it the highest variability reported for H II regions to date over a short timescale of 8 years.
As discussed in Sect. 5.2, no extreme physical properties have been observed in the natal clump of this most variable source. However, its natal clump displays high maximum outflow velocities, with velocities twice as high as the mean value of the sample of 1192 outflow clumps, as presented in Figure 5 of Yang et al. (2022a). The most variable G010.4629+00.0299, together with the second-most variable G010.4724+00.0274 classified as an HC H II region in Yang et al. (2021), are located in the cluster environment of the complex star-forming region W31, where various molecules (Hatchell et al. 1998; Ren et al. 2014), H2O maser (Hofner & Churchwell 1996), OH masers (Braz & Sivagnanam 1987), and methanol maser (Green et al. 2010; Yang et al. 2019b; Nguyen et al. 2022) have been detected. The cluster and clumpy environment observed at submillimeter ALMA (Gieser et al. 2023), mid-infrared (Pascucci et al. 2004), and radio wavelengths (Yang et al. 2021) with angular resolutions of ≲1.0″, and the clump-scale high-velocity outflows detected by CO (López-Sepulcre et al. 2009; Yang et al. 2022a), support that the variations of UC H II regions preferably occur in young and active massive star-forming regions, which might be connected to the unstable and clumpy accretion flows.
6 Conclusion and summary
By comparing the CORNISH and GLOSTAR 5GHz surveys, we identified a sample of 38 variable UC H II regions, the largest sample of variable UC H II regions identified to date. The high angular resolution of CORNISH (Hoare et al. 2012) combined with the broadband sensitivity of GLOSTAR (Brunthaler et al. 2021) and the detailed analysis of natal molecular clumps (Urquhart et al. 2018) allowed us to examine the relationship between variability and physical properties for the first time. Our main conclusions are as follows:
Within the whole sample of 38 variable UC H II regions we see that all sources with a decrease in their 5 GHz flux density have a negative radio spectral index. We speculate that these sources may be contaminated by nonthermal radio jets. UC H II regions showing flux increases have a mix of positive and negative spectral indices;
There is a significant correlation between the spectral index and the CORNISH-GLOSTAR flux ratio. UC H II regions with steeper spectral indices (both positive and negative) show greater variability in their radio flux density. Variable UC H II regions also have significantly smaller diameters than the nonvariable sample. When considering distributions of spectral index and diameter, we are confidently able to reject the null hypothesis that variable UC H II regions are drawn from the same parent sample as nonvariable UC H II regions. We hypothesize that the most variable sources are also the youngest H II regions, with diameters and spectral indices consistent with hypercompact H II regions. This is consistent with the Peters et al. (2010a,b) models where the largest changes in brightness occur at the earliest stages;
When considering the most variable UC H II regions (the Top7 subsample), we also find that they have positive spectral indices, increase in flux density, and small diameters. This may be due to the spectral evolution of the sample as the H II regions transition from optically thick to optically thin at 5 GHz. This evolution would result in a gradual brightening of the 5 GHz flux density;
There is no significant correlation between the physical properties of the natal molecular clumps hosting the UC H II regions and their variability. However, we do find a significant difference in evolutionary indicators of the clump (Tbol and Lbol/Mclump) whereby the younger clumps host the most variable H II regions. This is consistent with our finding that younger H II regions are the most variable;
The overall occurrence of variability within our UC H II region sample (~44%) is larger than that predicted ~10% by the models in Galván-Madrid et al. (2011), suggesting that flux variation in UC H II regions is significantly more common than predictions.
With the available observational data, we were able to identify a large sample of variable UC H II regions on decade timescales and uncover significant relations between variability and the evolutionary stage of the UC H II regions and their natal molecular clumps. However, it is clear that a broadband monitoring campaign of UC H II regions is required to understand the mechanism behind their variability, uncover details of their spectral evolution, and hence constrain accretion models of the massive star formation process.
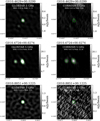 |
Fig. 7 GLOSTAR and CORNISH 5 GHz images for the 38 variable sources identified in this work. The beam size is 1.5″ for each image in the two surveys. Each figure is centered at the position of the identified H II region. Only a small portion of the sample is presented here, and the radio images for the full sample of 38 variable UC H II regions are available in electronic form at Zenodo via https://zenodo.org/records/13906200. |
Data availability
The full version of Table 1 is available at the CDS via anonymous ftp to cdsarc.cds.unistra.fr (130.79.128.5) or via https://cdsarc.cds.unistra.fr/viz-bin/cat/J/A+A/694/A26.
The full version of Figure 7 is available in electronic form at Zenodo via https://zenodo.org/records/13906200.
Acknowledgements
We thank the anonymous referee for providing useful suggestions and comments, which helped to improve the manuscript. AYY acknowledges the support from the National Key R&D Program of China No. 2023YFC2206403 and National Natural Science Foundation of China (NSFC) grants No. 12303031 and No. 11988101. DL is a New Cornerstone investigator. YG is supported by the Strategic Priority Research Program of the Chinese Academy of Sciences, Grant No. XDB0800301. CWT and DL acknowledge support from the International Partnership Program of Chinese Academy of Sciences, Program No.114A11KYSB20210010. The National Radio Astronomy Observatory is a facility of the National Science Foundation, operated under a cooperative agreement by Associated Universities, Inc. This research made use of Astropy (http://www.astropy.org), a community developed core Python package for Astronomy (Astropy Collaboration 2013, 2018). We are deeply saddened by the loss of our co-author Prof. Dr. Karl Menten, who passed away during the final proofing stage of this paper. His contributions to this work are invaluable, and he will be greatly missed.
References
- Acord, J. M., Churchwell, E., & Wood, D. O. S. 1998, ApJ, 495, L107 [NASA ADS] [CrossRef] [Google Scholar]
- Anglada, G., Rodríguez, L. F., & Carrasco-González, C. 2018, A&A Rev., 26, 3 [Google Scholar]
- Astropy Collaboration (Robitaille, T. P., et al.) 2013, A&A, 558, A33 [NASA ADS] [CrossRef] [EDP Sciences] [Google Scholar]
- Astropy Collaboration (Price-Whelan, A. M., et al.) 2018, AJ, 156, 123 [Google Scholar]
- Braz, M. A., & Sivagnanam, P. 1987, A&A, 181, 19 [NASA ADS] [Google Scholar]
- Brogan, C. L., Hunter, T. R., Cyganowski, C. J., et al. 2018, ApJ, 866, 87 [NASA ADS] [CrossRef] [Google Scholar]
- Brunthaler, A., Menten, K. M., Dzib, S. A., et al. 2021, A&A, 651, A85 [EDP Sciences] [Google Scholar]
- Chen, X., Ellingsen, S. P., Shen, Z.-Q., Titmarsh, A., & Gan, C.-G. 2011, ApJS, 196, 9 [NASA ADS] [CrossRef] [Google Scholar]
- Churchwell, E. 2002, ARA&A, 40, 27 [Google Scholar]
- De Pree, C. G., Peters, T., Mac Low, M. M., et al. 2015, ApJ, 815, 123 [Google Scholar]
- De Pree, C. G., Galván-Madrid, R., Goss, W. M., et al. 2018, ApJ, 863, L9 [NASA ADS] [CrossRef] [Google Scholar]
- De Pree, C. G., Wilner, D. J., Kristensen, L. E., et al. 2020, AJ, 160, 234 [Google Scholar]
- Dzib, S. A., Yang, A. Y., Urquhart, J. S., et al. 2023, A&A, 670, A9 [NASA ADS] [CrossRef] [EDP Sciences] [Google Scholar]
- Elia, D., Merello, M., Molinari, S., et al. 2021, MNRAS, 504, 2742 [NASA ADS] [CrossRef] [Google Scholar]
- Franco-Hernández, R., & Rodríguez, L. F. 2004, ApJ, 604, L105 [CrossRef] [Google Scholar]
- Galván-Madrid, R., Rodríguez, L. F., Ho, P. T. P., & Keto, E. 2008, ApJ, 674, L33 [CrossRef] [Google Scholar]
- Galván-Madrid, R., Peters, T., Keto, E. R., et al. 2011, MNRAS, 416, 1033 [CrossRef] [Google Scholar]
- Gieser, C., Beuther, H., Semenov, D., et al. 2023, A&A, 674, A160 [NASA ADS] [CrossRef] [EDP Sciences] [Google Scholar]
- Goedhart, S., Cotton, W. D., Camilo, F., et al. 2024, MNRAS, 531, 649 [CrossRef] [Google Scholar]
- Green, J. A., Caswell, J. L., Fuller, G. A., et al. 2010, MNRAS, 409, 913 [NASA ADS] [CrossRef] [Google Scholar]
- Hancock, P. J., Murphy, T., Gaensler, B. M., Hopkins, A., & Curran, J. R. 2012, MNRAS, 422, 1812 [Google Scholar]
- Hatchell, J., Thompson, M. A., Millar, T. J., & MacDonald, G. H. 1998, A&AS, 133, 29 [NASA ADS] [CrossRef] [EDP Sciences] [Google Scholar]
- Hoare, M. G., Purcell, C. R., Churchwell, E. B., et al. 2012, PASP, 124, 939 [Google Scholar]
- Hofner, P., & Churchwell, E. 1996, A&AS, 120, 283 [NASA ADS] [CrossRef] [EDP Sciences] [Google Scholar]
- Hunter, T. R., Brogan, C. L., MacLeod, G. C., et al. 2018, ApJ, 854, 170 [NASA ADS] [CrossRef] [Google Scholar]
- Kalcheva, I. E., Hoare, M. G., Urquhart, J. S., et al. 2018, A&A, 615, A103 [NASA ADS] [CrossRef] [EDP Sciences] [Google Scholar]
- Kawamura, J. H., & Masson, C. R. 1998, ApJ, 509, 270 [NASA ADS] [CrossRef] [Google Scholar]
- Klassen, M., Peters, T., & Pudritz, R. E. 2012, ApJ, 758, 137 [Google Scholar]
- König, C., Urquhart, J. S., Csengeri, T., et al. 2017, A&A, 599, A139 [Google Scholar]
- Krumholz, M. R., Klein, R. I., McKee, C. F., Offner, S. S. R., & Cunningham, A. J. 2009, Science, 323, 754 [Google Scholar]
- Kurtz, S. 2005, in IAU Symposium, Vol. 227, Massive Star Birth: A Crossroads of Astrophysics, eds. R. Cesaroni, M. Felli, E. Churchwell, & M. Walmsley, 111 [Google Scholar]
- López-Sepulcre, A., Codella, C., Cesaroni, R., Marcelino, N., & Walmsley, C. M. 2009, A&A, 499, 811 [NASA ADS] [CrossRef] [EDP Sciences] [Google Scholar]
- Lu, Y., Chen, X., Song, S.-M., et al. 2024, ApJS, 272, 44 [NASA ADS] [CrossRef] [Google Scholar]
- Luo, Q.-y., Liu, T., Lee, A. T., et al. 2023, ApJ, 952, L2 [NASA ADS] [CrossRef] [Google Scholar]
- Mai, X., Liu, T., Liu, X., et al. 2024, ApJ, 961, L35 [NASA ADS] [CrossRef] [Google Scholar]
- Mainzer, A., Grav, T., Bauer, J., et al. 2011, ApJ, 743, 156 [NASA ADS] [CrossRef] [Google Scholar]
- Menten, K. M. 1991, ApJ, 380, L75 [Google Scholar]
- Meyer, D. M. A., Vorobyov, E. I., Kuiper, R., & Kley, W. 2017, MNRAS, 464, L90 [Google Scholar]
- Nguyen, H., Rugel, M. R., Murugeshan, C., et al. 2022, A&A, 666, A59 [NASA ADS] [CrossRef] [EDP Sciences] [Google Scholar]
- Obonyo, W. O., Hoare, M. G., Lumsden, S. L., et al. 2024, MNRAS, 533, 3862 [NASA ADS] [CrossRef] [Google Scholar]
- Pascucci, I., Apai, D., Henning, T., Stecklum, B., & Brandl, B. 2004, A&A, 426, 523 [NASA ADS] [CrossRef] [EDP Sciences] [Google Scholar]
- Patel, A. L., Urquhart, J. S., Yang, A. Y., et al. 2023, MNRAS, 524, 4384 [NASA ADS] [CrossRef] [Google Scholar]
- Patel, A. L., Urquhart, J. S., Yang, A. Y., et al. 2024, MNRAS, 533, 2005 [NASA ADS] [CrossRef] [Google Scholar]
- Perley, R. A., Schwab, F. R., & Bridle, A. H., eds. 1989, Synthesis Imaging in Radio Astronomy: A Collection of Lectures from the Third NRAO Synthesis Imaging Summer School, Astronomical Society of the Pacific Conference Series, 6 [Google Scholar]
- Perley, R. A., Chandler, C. J., Butler, B. J., & Wrobel, J. M. 2011, ApJ, 739, L1 [Google Scholar]
- Peters, T., Banerjee, R., Klessen, R. S., et al. 2010a, ApJ, 711, 1017 [NASA ADS] [CrossRef] [Google Scholar]
- Peters, T., Klessen, R. S., Mac Low, M.-M., & Banerjee, R. 2010b, ApJ, 725, 134 [Google Scholar]
- Plunkett, A., Hacar, A., Moser-Fischer, L., et al. 2023, PASP, 135, 034501 [NASA ADS] [CrossRef] [Google Scholar]
- Purcell, C. R., Hoare, M. G., Cotton, W. D., et al. 2013, ApJS, 205, 1 [Google Scholar]
- Qiu, K., Zhang, Q., Wu, J., & Chen, H.-R. 2009, ApJ, 696, 66 [NASA ADS] [CrossRef] [Google Scholar]
- Ren, Z., Wu, Y., Liu, T., et al. 2014, A&A, 567, A40 [NASA ADS] [CrossRef] [EDP Sciences] [Google Scholar]
- Rivilla, V. M., Chandler, C. J., Sanz-Forcada, J., et al. 2015, ApJ, 808, 146 [NASA ADS] [CrossRef] [Google Scholar]
- Savedoff, M. P., & Greene, J. 1955, ApJ, 122, 477 [NASA ADS] [CrossRef] [Google Scholar]
- Schuller, F., Menten, K. M., Contreras, Y., et al. 2009, A&A, 504, 415 [NASA ADS] [CrossRef] [EDP Sciences] [Google Scholar]
- Strömgren, B. 1939, ApJ, 89, 526 [CrossRef] [Google Scholar]
- Urquhart, J. S., König, C., Giannetti, A., et al. 2018, MNRAS, 473, 1059 [Google Scholar]
- Urquhart, J. S., Wells, M. R. A., Pillai, T., et al. 2022, MNRAS, 510, 3389 [NASA ADS] [CrossRef] [Google Scholar]
- van der Tak, F. F. S., Tuthill, P. G., & Danchi, W. C. 2005, A&A, 431, 993 [NASA ADS] [CrossRef] [EDP Sciences] [Google Scholar]
- White, R. L., Becker, R. H., & Helfand, D. J. 2005, AJ, 130, 586 [NASA ADS] [CrossRef] [Google Scholar]
- Wood, D. O. S., & Churchwell, E. 1989, ApJS, 69, 831 [Google Scholar]
- Yang, A. Y., Thompson, M. A., Urquhart, J. S., & Tian, W. W. 2018, ApJS, 235, 3 [Google Scholar]
- Yang, A. Y., Thompson, M. A., Tian, W. W., et al. 2019a, MNRAS, 482, 2681 [NASA ADS] [CrossRef] [Google Scholar]
- Yang, K., Chen, X., Shen, Z.-Q., et al. 2019b, ApJS, 241, 18 [Google Scholar]
- Yang, A. Y., Urquhart, J. S., Thompson, M. A., et al. 2021, A&A, 645, A110 [EDP Sciences] [Google Scholar]
- Yang, A. Y., Urquhart, J. S., Wyrowski, F., et al. 2022a, A&A, 658, A160 [NASA ADS] [CrossRef] [EDP Sciences] [Google Scholar]
- Yang, W. J., Menten, K. M., Yang, A. Y., et al. 2022b, A&A, 658, A192 [NASA ADS] [CrossRef] [EDP Sciences] [Google Scholar]
- Yang, A. Y., Dzib, S. A., Urquhart, J. S., et al. 2023, A&A, 680, A92 [NASA ADS] [CrossRef] [EDP Sciences] [Google Scholar]
The JVLA, originally named Extended VLA, available since 2011, is an extensively upgraded version of the classic VLA, which was commissioned in 1980. Among other improvements, the JVLA’s much wider bandwidth and more sensitive receivers provide much better sensitivity and instantaneous frequency coverage (Perley et al. 2011).
GLOSTAR covered the same areas in JVLA’s B or BnA and D configurations and, to acquire zero spacing information, with the Effelsberg 100 meter radio telescope (for an overview, see Brunthaler et al. 2021). In this study, only the GLOSTAR B and BnA configuration continuum data is considered.
All Tables
Variables observed in the GLOSTAR and CORNISH for 10° < ℓ < 40° and 56° < ℓ < 60° with |b| < 1°.
All Figures
|
Fig. 1 Examples of multi-band images of variable H II regions identified by criteria (1)–(3) in Sect. 3. We found that no source meets criterion (2). From top to bottom: (a) Example of a variable H II region that meets criterion (1); (b–d) Examples of variable H II regions that meet criterion (3): (b) using 3σ as the upper limit of the CORNISH peaks to estimate the variation if 3σ is higher than the local peak; (c) and (d) using the local peak of the source to estimate the variation if the local peak is higher than 3σ; From left to right: Three-colors composition image of Hi-GAL (red = 250 μm, green = 160 μm, blue = 70 μm), GLIMPSE (red = 8.0 μm, green = 4.5 μm, blue = 3.6 μm), radio image of GLOSTAR and CORNISH at 5 GHz. The noise level of CORNISH is 0.33 mJy beam−1. The white circles in the lower left corner of each image show the FWHM beams of Hi–GAL (12″ at 160 μm), GLIMPSE (2″), GLOSTAR (its B-configuration smoothed to 1.5″) and CORNISH (1.5″). The gray contours in the left two panels show the ATLASGAL emissions at 870 μm. The lime contours in the middle and right panels show the radio emission of GLOSTAR. The image size is indicated at the top of each figure centered at the coordinates of each H II region. The GLOSTAR images have been smoothed to match the beam size of 1.5″ in CORNISH. |
| In the text | |
|
Fig. 2 Distribution of flux ratio between GLOSTAR and CORNISH for the 86 UC H II regions (white shaded) that can be assessed using criteria (1)–(3). This gives 38 variable UC H II regions (gray shaded) with flux variation fraction |fvar| > 30%, which includes the purple area for those with flux ratio > 1.3 (or fvar > 30%) and the green area for those with flux ratio <0.7 (or fvar < −30%). The bin size is 0.15. |
| In the text | |
|
Fig. 3 Flux ratio between GLOSTAR and CORNISH as a function of the GLOSTAR spectral index at 4–8 GHz of the 86 sources, including 38 variables (black dots) with |fvar| > 30% and the remaining 48 sources (gray dots) with |fvar| < 30%, as defined in Sect. 3. The purple shaded area includes the variables with flux increase and the green shaded area includes the variables with flux decrease, as outlined in Figure 2. The red circles display the Top7 variable UC H II region (see Sect. 4.1 for details), six of which have reliable spectral indices listed in Table 1. |
| In the text | |
|
Fig. 4 Cumulative distributions of the physical diameter (top panel) and the spectral index α4–8 GHz (bottom panel) for the Top7 (blue) and variable UC H II regions (red) of this work, and for the UC H II regions (black) from the GLOSTAR (Yang et al. 2023) or CORNISH (Kalcheva et al. 2018). A total of 32 of the 38 variable UC H II regions have their distances measured in Urquhart et al. (2018). The magenta line indicates diam=0.05 pc, i.e., the size criterion of the HC H II regions. This indicates that 100% of variable sources in this study meet the size criterion of HC H II regions. As the uncertainty in spectral index σα is large for weak sources in GLOSTAR (Yang et al. 2023), we limit the sources with σα < 0.1 here for α comparison. |
| In the text | |
|
Fig. 5 Cumulative distributions of the clump properties such as bolometric luminosity Lbol, mass Mclump, luminosity-to-mass ratio Lbol/Mclump, surface density Σ, bolometric temperature Tbol, and clump free-fall times tff for the natal clumps of the Top7 variables (blue) and variable UC H II regions (red) from this work, as well as the GLOSTAR UC H II regions (black) and CORNISH UC H II regions. |
| In the text | |
|
Fig. 6 Comparison of clump properties of the total UC H II regions and variable UC H II regions. Top panel: spectral index α4–8 GHz UC H II regions vs. the surface densities of their natal clumps for the variable sample (red circles), and the Top7 (blue circles) (6 with reliable α in Table 1), and the total UC H II regions (gray dots) from GLOSTAR (only GLOSTAR here as it has the measured spectral index). Middle panel: bolometric luminosity vs. the clump mass of the natal clumps for the variable UC H II regions, the Top7, and the total UC H II regions of CORNISH and CORNISH. Bottom panel: bolometric temperature vs. the luminosity-to-mass ratio of the natal clumps for the variable UC H II regions, the Top7 variable UC H II regions, and the GLOSTAR and CORNISH UC H II regions. The error bars in each figure correspond to a typical uncertainty of these parameters: 0.2 for α (Yang et al. 2023), 25% for Tbol, 50% for Lbol, Mclump, and Lbol/Mclump (Urquhart et al. 2018, 2022). |
| In the text | |
|
Fig. 7 GLOSTAR and CORNISH 5 GHz images for the 38 variable sources identified in this work. The beam size is 1.5″ for each image in the two surveys. Each figure is centered at the position of the identified H II region. Only a small portion of the sample is presented here, and the radio images for the full sample of 38 variable UC H II regions are available in electronic form at Zenodo via https://zenodo.org/records/13906200. |
| In the text | |
Current usage metrics show cumulative count of Article Views (full-text article views including HTML views, PDF and ePub downloads, according to the available data) and Abstracts Views on Vision4Press platform.
Data correspond to usage on the plateform after 2015. The current usage metrics is available 48-96 hours after online publication and is updated daily on week days.
Initial download of the metrics may take a while.