Fig. 7
Download original image
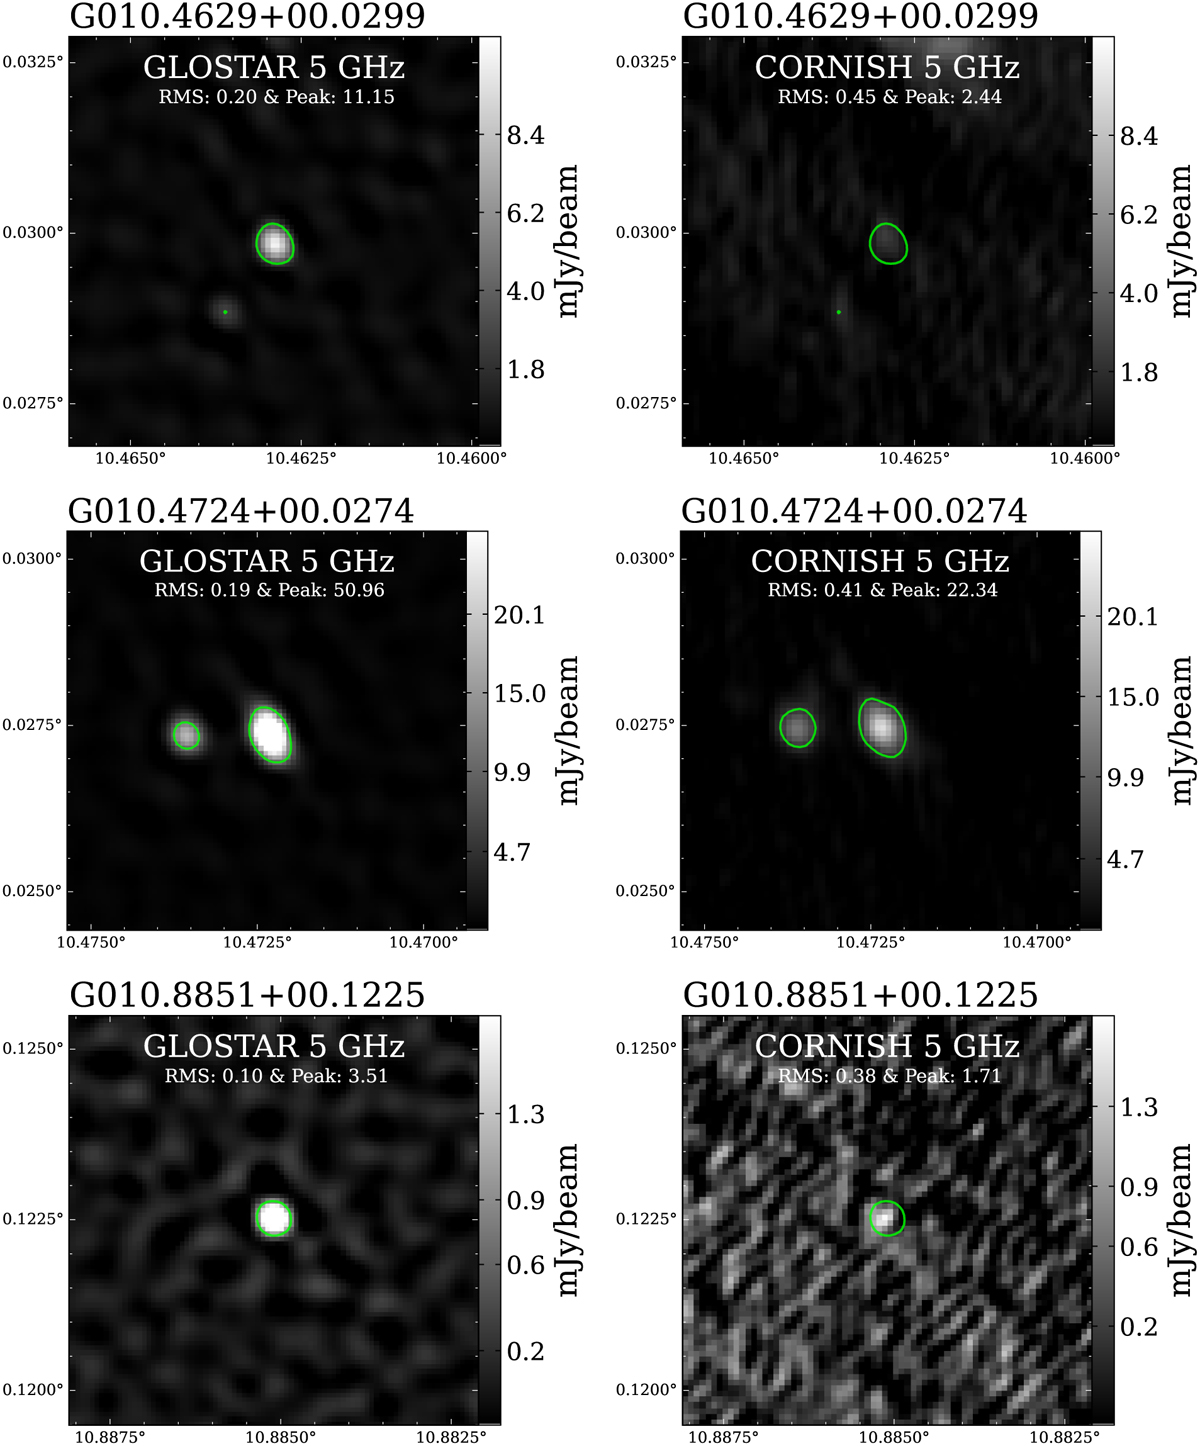
GLOSTAR and CORNISH 5 GHz images for the 38 variable sources identified in this work. The beam size is 1.5″ for each image in the two surveys. Each figure is centered at the position of the identified H II region. Only a small portion of the sample is presented here, and the radio images for the full sample of 38 variable UC H II regions are available in electronic form at Zenodo via https://zenodo.org/records/13906200.
Current usage metrics show cumulative count of Article Views (full-text article views including HTML views, PDF and ePub downloads, according to the available data) and Abstracts Views on Vision4Press platform.
Data correspond to usage on the plateform after 2015. The current usage metrics is available 48-96 hours after online publication and is updated daily on week days.
Initial download of the metrics may take a while.