Fig. 3
Download original image
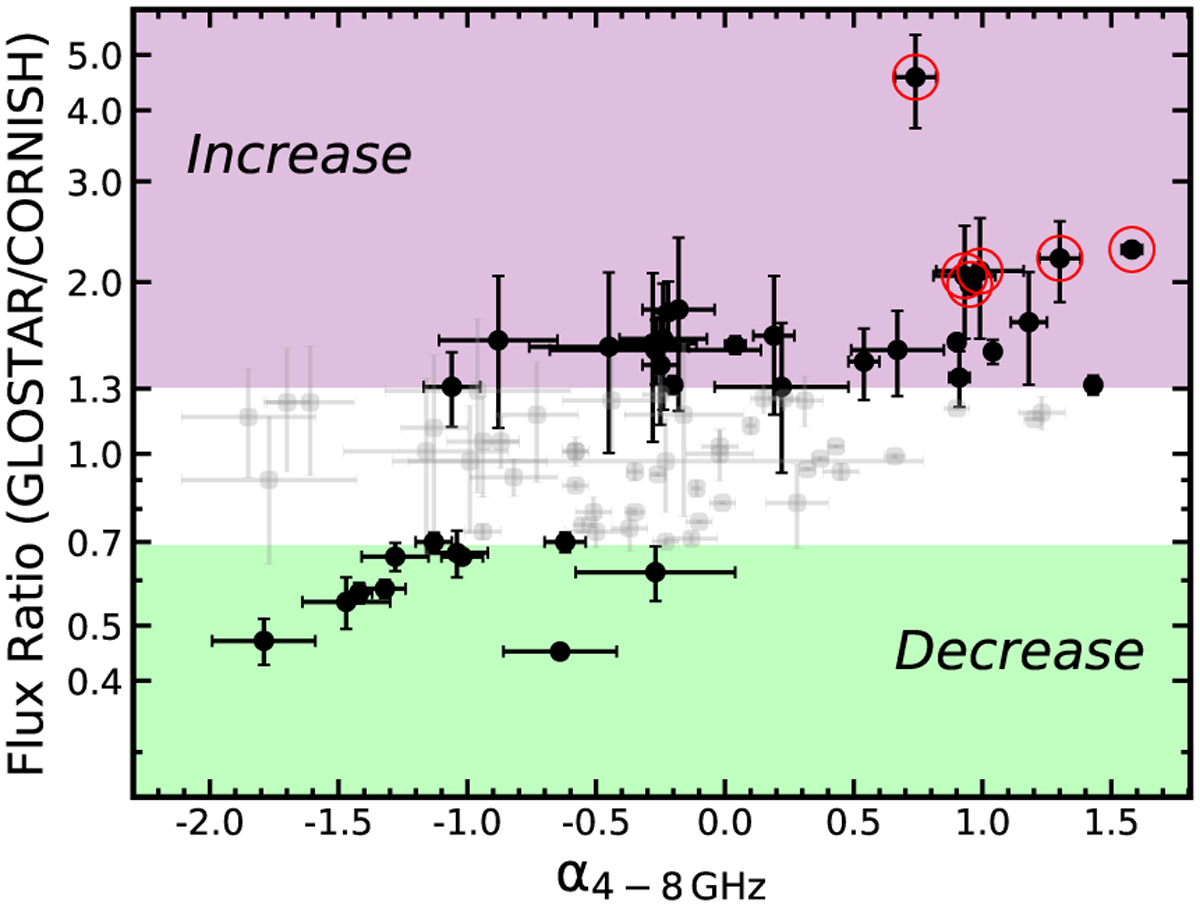
Flux ratio between GLOSTAR and CORNISH as a function of the GLOSTAR spectral index at 4–8 GHz of the 86 sources, including 38 variables (black dots) with |fvar| > 30% and the remaining 48 sources (gray dots) with |fvar| < 30%, as defined in Sect. 3. The purple shaded area includes the variables with flux increase and the green shaded area includes the variables with flux decrease, as outlined in Figure 2. The red circles display the Top7 variable UC H II region (see Sect. 4.1 for details), six of which have reliable spectral indices listed in Table 1.
Current usage metrics show cumulative count of Article Views (full-text article views including HTML views, PDF and ePub downloads, according to the available data) and Abstracts Views on Vision4Press platform.
Data correspond to usage on the plateform after 2015. The current usage metrics is available 48-96 hours after online publication and is updated daily on week days.
Initial download of the metrics may take a while.