Fig. 4
Download original image
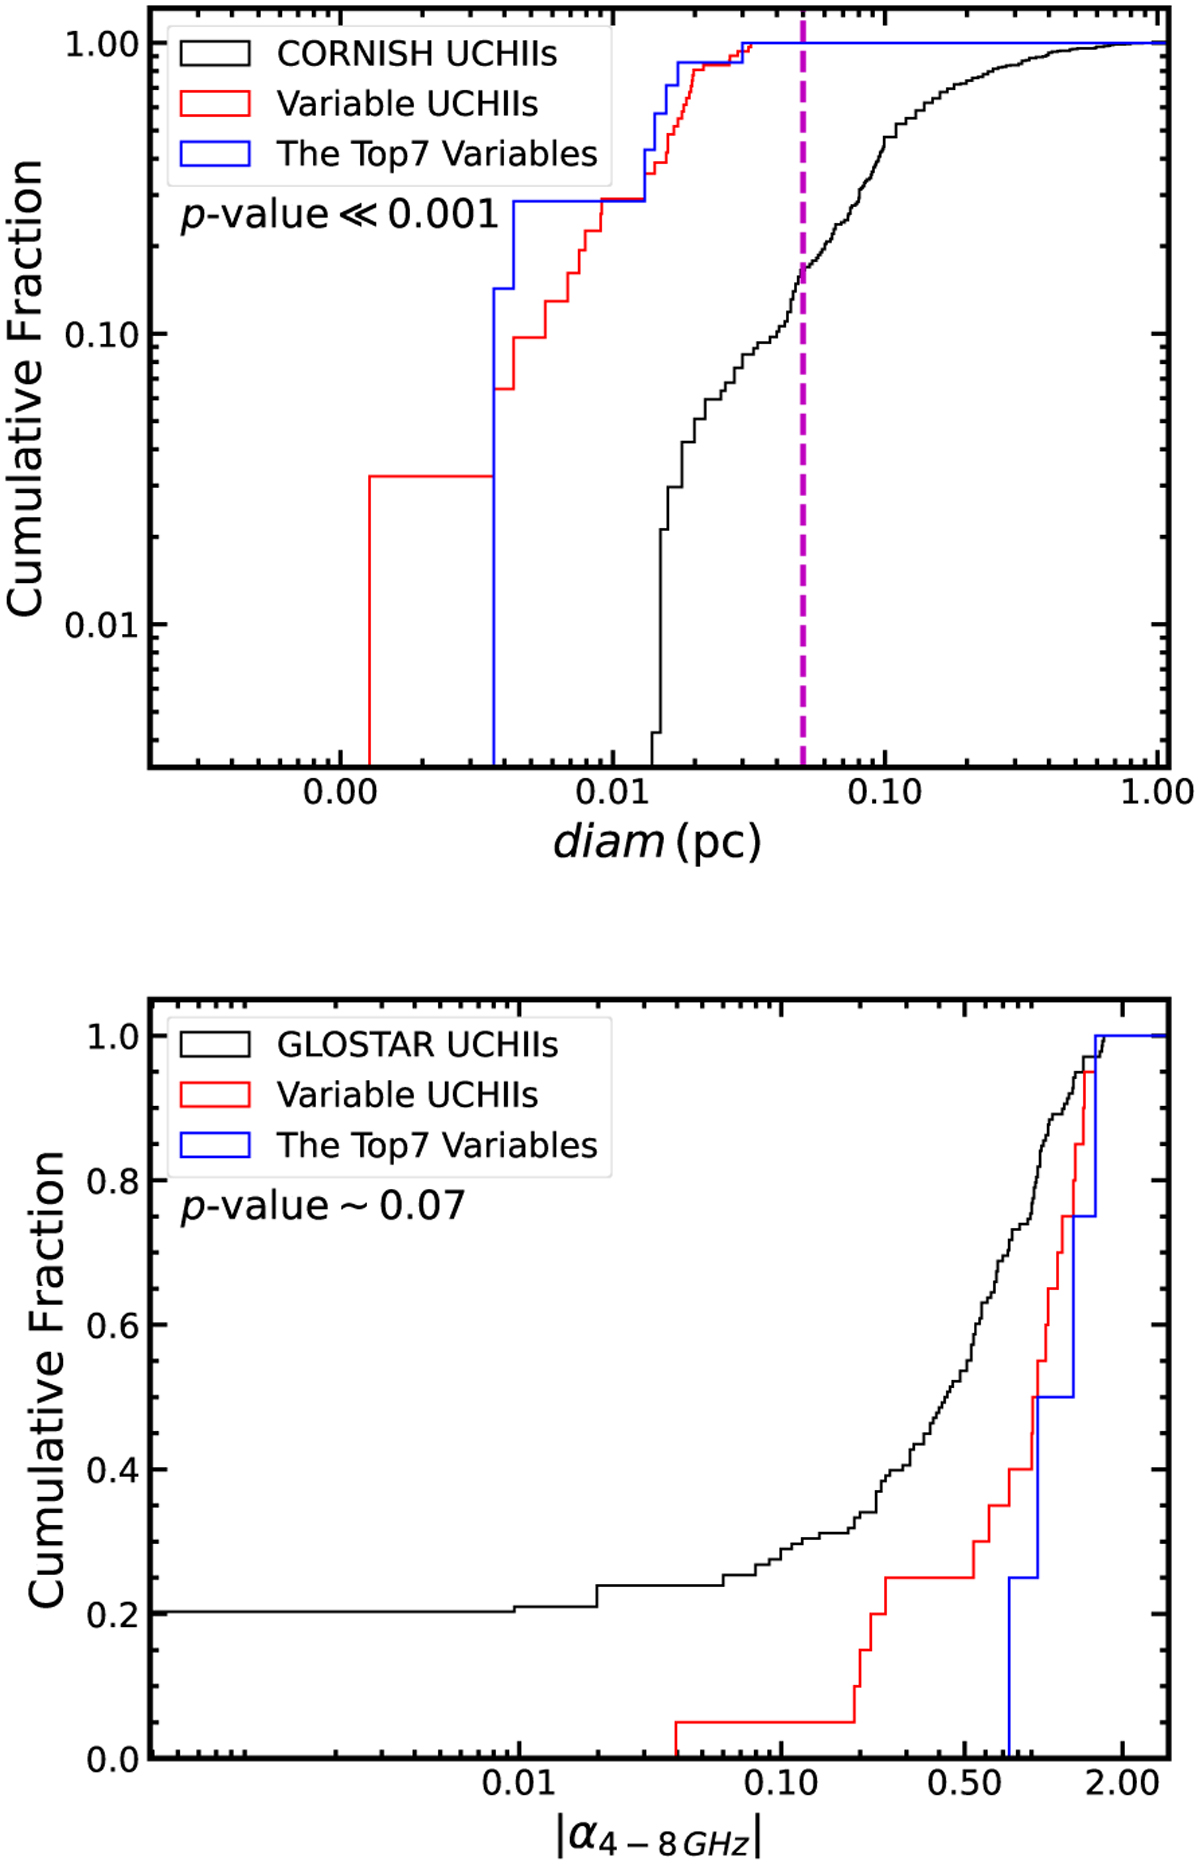
Cumulative distributions of the physical diameter (top panel) and the spectral index α4–8 GHz (bottom panel) for the Top7 (blue) and variable UC H II regions (red) of this work, and for the UC H II regions (black) from the GLOSTAR (Yang et al. 2023) or CORNISH (Kalcheva et al. 2018). A total of 32 of the 38 variable UC H II regions have their distances measured in Urquhart et al. (2018). The magenta line indicates diam=0.05 pc, i.e., the size criterion of the HC H II regions. This indicates that 100% of variable sources in this study meet the size criterion of HC H II regions. As the uncertainty in spectral index σα is large for weak sources in GLOSTAR (Yang et al. 2023), we limit the sources with σα < 0.1 here for α comparison.
Current usage metrics show cumulative count of Article Views (full-text article views including HTML views, PDF and ePub downloads, according to the available data) and Abstracts Views on Vision4Press platform.
Data correspond to usage on the plateform after 2015. The current usage metrics is available 48-96 hours after online publication and is updated daily on week days.
Initial download of the metrics may take a while.