Fig. 1
Download original image
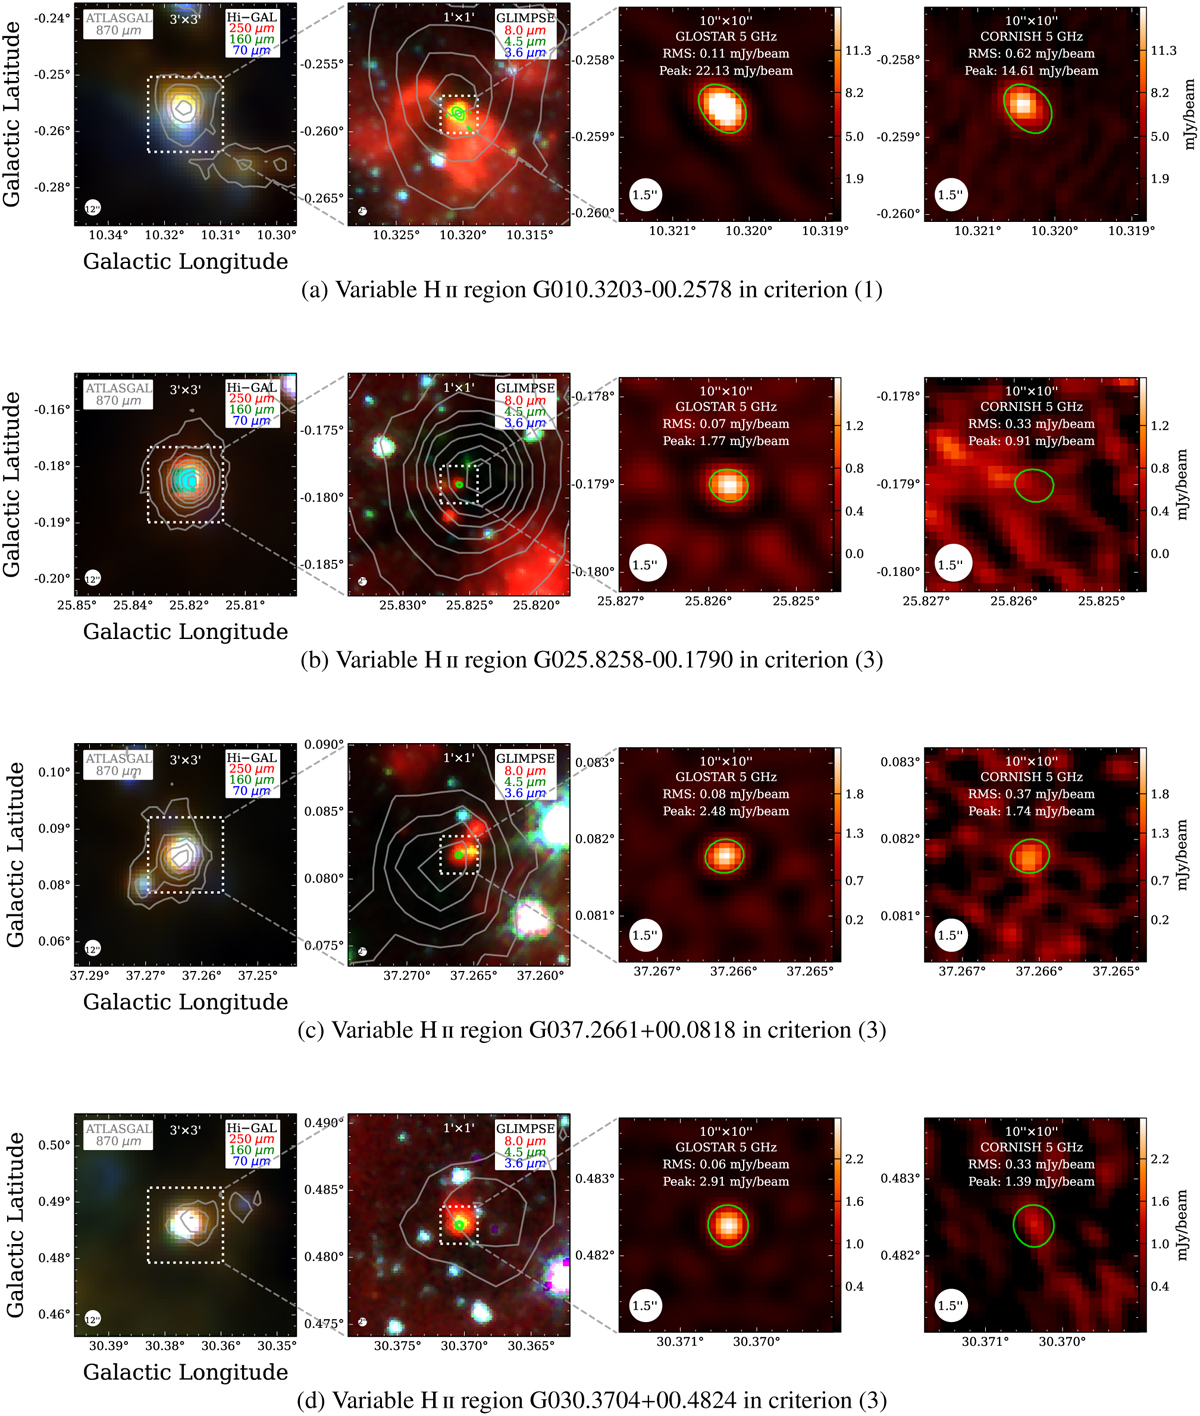
Examples of multi-band images of variable H II regions identified by criteria (1)–(3) in Sect. 3. We found that no source meets criterion (2). From top to bottom: (a) Example of a variable H II region that meets criterion (1); (b–d) Examples of variable H II regions that meet criterion (3): (b) using 3σ as the upper limit of the CORNISH peaks to estimate the variation if 3σ is higher than the local peak; (c) and (d) using the local peak of the source to estimate the variation if the local peak is higher than 3σ; From left to right: Three-colors composition image of Hi-GAL (red = 250 μm, green = 160 μm, blue = 70 μm), GLIMPSE (red = 8.0 μm, green = 4.5 μm, blue = 3.6 μm), radio image of GLOSTAR and CORNISH at 5 GHz. The noise level of CORNISH is 0.33 mJy beam−1. The white circles in the lower left corner of each image show the FWHM beams of Hi–GAL (12″ at 160 μm), GLIMPSE (2″), GLOSTAR (its B-configuration smoothed to 1.5″) and CORNISH (1.5″). The gray contours in the left two panels show the ATLASGAL emissions at 870 μm. The lime contours in the middle and right panels show the radio emission of GLOSTAR. The image size is indicated at the top of each figure centered at the coordinates of each H II region. The GLOSTAR images have been smoothed to match the beam size of 1.5″ in CORNISH.
Current usage metrics show cumulative count of Article Views (full-text article views including HTML views, PDF and ePub downloads, according to the available data) and Abstracts Views on Vision4Press platform.
Data correspond to usage on the plateform after 2015. The current usage metrics is available 48-96 hours after online publication and is updated daily on week days.
Initial download of the metrics may take a while.