Fig. 6
Download original image
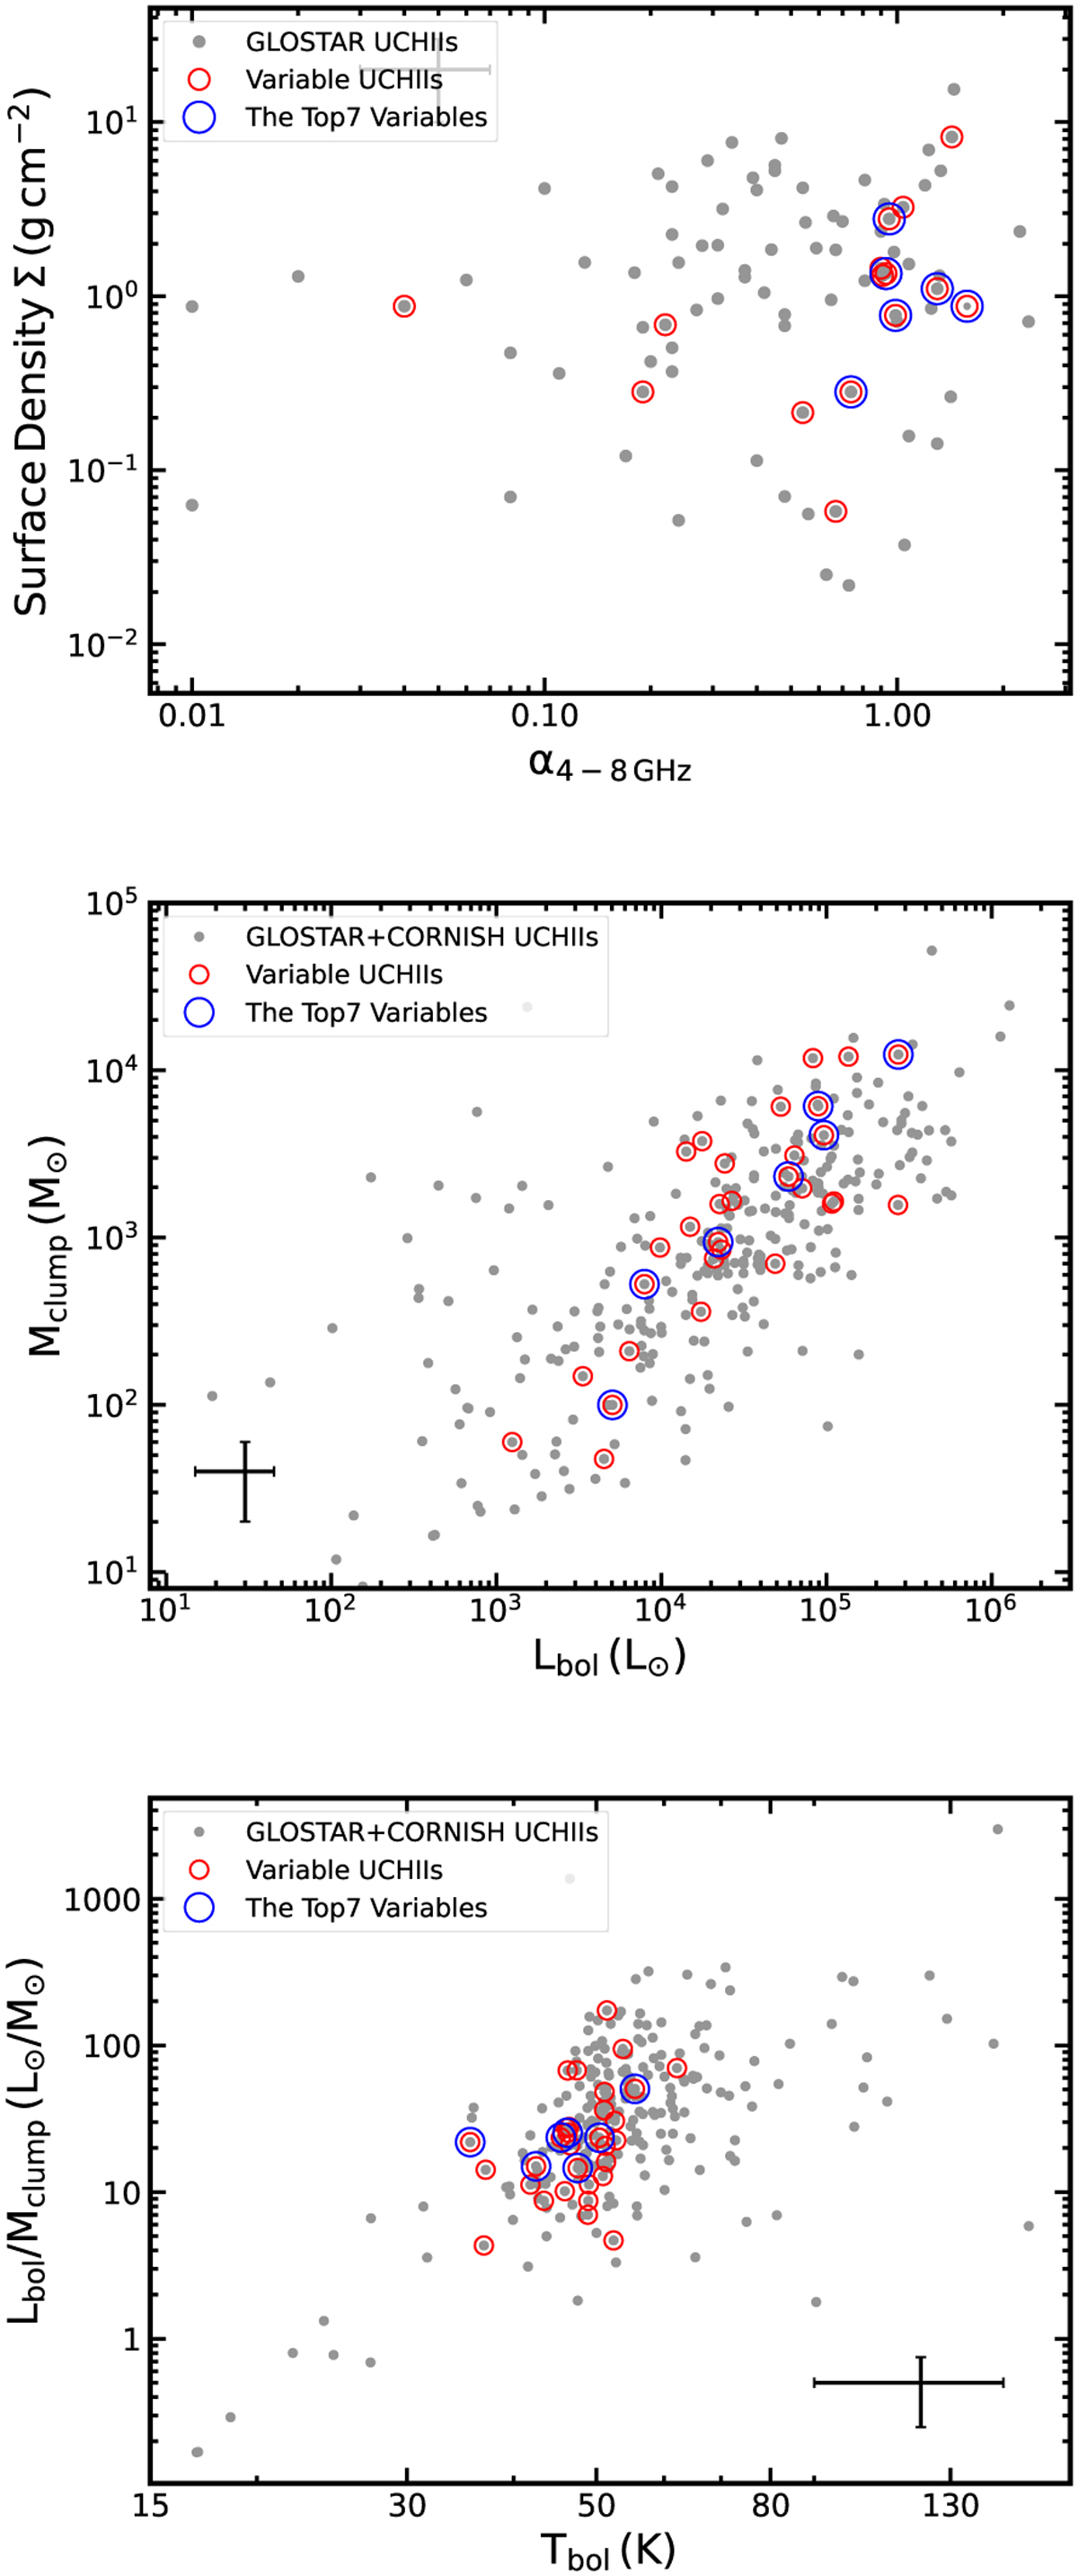
Comparison of clump properties of the total UC H II regions and variable UC H II regions. Top panel: spectral index α4–8 GHz UC H II regions vs. the surface densities of their natal clumps for the variable sample (red circles), and the Top7 (blue circles) (6 with reliable α in Table 1), and the total UC H II regions (gray dots) from GLOSTAR (only GLOSTAR here as it has the measured spectral index). Middle panel: bolometric luminosity vs. the clump mass of the natal clumps for the variable UC H II regions, the Top7, and the total UC H II regions of CORNISH and CORNISH. Bottom panel: bolometric temperature vs. the luminosity-to-mass ratio of the natal clumps for the variable UC H II regions, the Top7 variable UC H II regions, and the GLOSTAR and CORNISH UC H II regions. The error bars in each figure correspond to a typical uncertainty of these parameters: 0.2 for α (Yang et al. 2023), 25% for Tbol, 50% for Lbol, Mclump, and Lbol/Mclump (Urquhart et al. 2018, 2022).
Current usage metrics show cumulative count of Article Views (full-text article views including HTML views, PDF and ePub downloads, according to the available data) and Abstracts Views on Vision4Press platform.
Data correspond to usage on the plateform after 2015. The current usage metrics is available 48-96 hours after online publication and is updated daily on week days.
Initial download of the metrics may take a while.