Fig. 2
Download original image
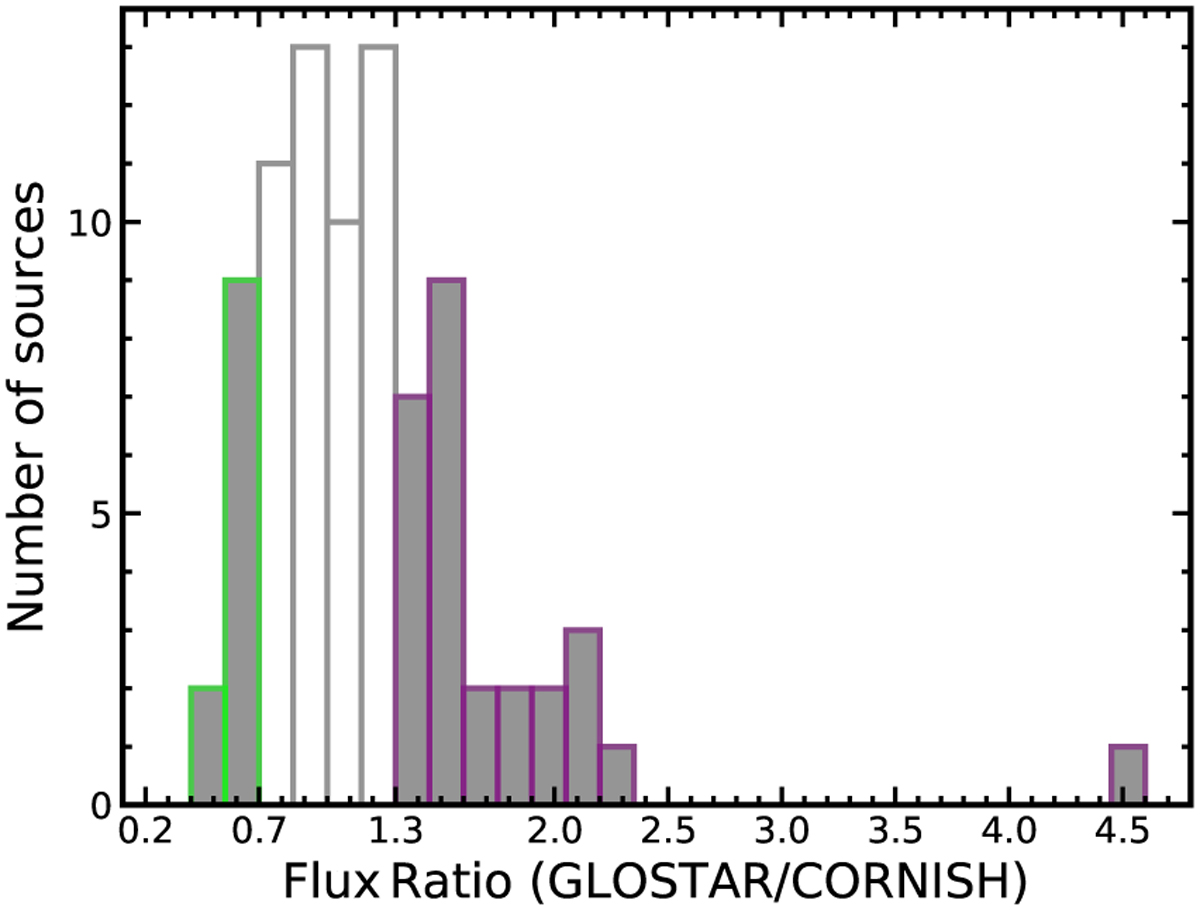
Distribution of flux ratio between GLOSTAR and CORNISH for the 86 UC H II regions (white shaded) that can be assessed using criteria (1)–(3). This gives 38 variable UC H II regions (gray shaded) with flux variation fraction |fvar| > 30%, which includes the purple area for those with flux ratio > 1.3 (or fvar > 30%) and the green area for those with flux ratio <0.7 (or fvar < −30%). The bin size is 0.15.
Current usage metrics show cumulative count of Article Views (full-text article views including HTML views, PDF and ePub downloads, according to the available data) and Abstracts Views on Vision4Press platform.
Data correspond to usage on the plateform after 2015. The current usage metrics is available 48-96 hours after online publication and is updated daily on week days.
Initial download of the metrics may take a while.