| Issue |
A&A
Volume 693, January 2025
|
|
|---|---|---|
| Article Number | L18 | |
| Number of page(s) | 9 | |
| Section | Letters to the Editor | |
| DOI | https://doi.org/10.1051/0004-6361/202452604 | |
| Published online | 24 January 2025 | |
Letter to the Editor
Spectroscopic confirmation of a dust-obscured, possibly metal-rich dwarf galaxy at z ∼ 5
1
INAF, Istituto di Radioastronomia, Via Piero Gobetti 101, 40129 Bologna, Italy
2
Dipartimento di Fisica e Astronomia “G. Galilei”, Università di Padova, Via Marzolo 8, 35131 Padova, Italy
3
INAF-Osservatorio Astrofisico di Arcetri, Largo E. Fermi 5, 50125 Firenze, Italy
4
NSF’s National Optical-Infrared Astronomy Research Laboratory, 950 N. Cherry Ave., Tucson, AZ, 85719
USA
5
Astrophysics Science Division, NASA Goddard Space Flight Center, 8800 Greenbelt Rd, Greenbelt, MD, 20771
USA
6
INAF – Osservatorio Astronomico di Roma, via di Frascati 33, 00078 Monte Porzio Catone, Italy
7
Department of Astronomy and Astrophysics, The Pennsylvania State University, University Park, PA, 16802
USA
8
Institute for Computational and Data Sciences, The Pennsylvania State University, University Park, PA, 16802
USA
9
Institute for Gravitation and the Cosmos, The Pennsylvania State University, University Park, PA, 16802
USA
10
Centro de Astrobiología (CAB), CSIC-INTA, Ctra de Ajalvir km 4, Torrejón de Ardoz, 28850 Madrid, Spain
11
INAF–Osservatorio Astronomico di Padova, Vicolo dell’Osservatorio 5, I-35122 Padova, Italy
12
INAF-Osservatorio di Astrofisica e Scienza dello Spazio, via Gobetti 93/3, I-40129 Bologna, Italy
13
Space Telescope Science Institute, 3700 San Martin Drive, Baltimore, MD, 21218
USA
14
Physics & Astronomy Department, University of Louisville, 40292 KY, Louisville, USA
15
INAF – Osservatorio Astronomico di Roma, via di Frascati 33, 00078 Monte Porzio Catone, Italy
16
Center for Astrophysics | Harvard & Smithsonian, 60 Garden St, Cambridge, MA, 02138
USA
17
Black Hole Initiative, Harvard University, 20 Garden St, Cambridge, MA, 02138
USA
18
Aix Marseille Univ, CNRS, CNES, LAM, Marseille, France
19
Astronomy Centre, University of Sussex, Falmer, Brighton, BN1 9QH
UK
20
Institute of Space Sciences and Astronomy, University of Malta, Msida, MSD 2080
Malta
21
Department of Astronomy, The University of Texas at Austin, Austin, TX, USA
22
Cosmic Frontier Center, The University of Texas at Austin, Austin, TX, USA
23
Laboratory for Multiwavelength Astrophysics, School of Physics and Astronomy, Rochester Institute of Technology, 84 Lomb Memorial Drive, Rochester, NY, 14623
USA
24
Department of Physics and Astronomy, Texas A&M University, College Station, TX, 77843-4242
USA
25
George P. and Cynthia Woods Mitchell Institute for Fundamental Physics and Astronomy, Texas A&M University, College Station, TX, 77843-4242
USA
26
ESA/AURA Space Telescope Science Institute, USA
⋆ Corresponding author; This email address is being protected from spambots. You need JavaScript enabled to view it.
Received:
14
October
2024
Accepted:
13
December
2024
Abstract
We present the first spectroscopic confirmation of a dust-obscured dwarf galaxy, CEERS-14821. The analysis was performed by combining JWST NIRCam broadband photometry and NIRSpec/PRISM spectroscopic data. From the detection of multiple rest-frame optical lines, we derive that CEERS-14821 is located at z = 4.883 ± 0.003. Moreover, from a secure detection of the Hα and Hβ, we derive that the galaxy has a dust extinction ranging from AV = 2.2−0.6+0.5 to AV = 3.4−0.9+0.7, depending on the assumed reddening law. This value is extremely large given that we estimated a low stellar mass, that is, log10(M/M⊙) = 8.17−0.04+0.05 or log10(M/M⊙) = 8.65−0.05+0.06, based on two different dust extinction laws. Moreover, the combination of different metallicity tracers and the spectro-photometric fit suggests that the galaxy may also be metal-rich, with 12 + log10(O/H)> 8.3, but a low metallicity value cannot be totally ruled out. The high metallicity value would be above the expectation based on the mass-metallicity relation. Both metallicity estimations are above the expectations based on the fundamental mass-metallicity relation since CEERS-14821 is going through a burst of star formation. The constraints on a possible active galactic nucleus presence are limited and loose, but they point towards a possible non-dominant contribution (fAGN < 0.5 with respect to the total dust luminosity). Based on the rest-frame optical images, this source has a size compatible with galaxies of similar stellar masses and at similar redshifts. Finally, CEERS-14821 may be part of a larger galaxy overdensity, but there are no other galaxies closely interacting with it (within 30 Mpc).
Key words: galaxies: dwarf / galaxies: fundamental parameters / galaxies: ISM / galaxies: peculiar
NASA Postdoctoral Fellow.
© The Authors 2025
 Open Access article, published by EDP Sciences, under the terms of the Creative Commons Attribution License (https://creativecommons.org/licenses/by/4.0), which permits unrestricted use, distribution, and reproduction in any medium, provided the original work is properly cited.
This article is published in open access under the Subscribe to Open model. This email address is being protected from spambots. You need JavaScript enabled to view it. to support open access publication.
1. Introduction
Only 1% of the total mass of the interstellar medium (ISM) is composed of dust, which is key to the formation and cooling of the molecular gas and the formation of new stars (for a review, see Draine 2003). The presence of dust can also profoundly impact the derivation of physical properties and our understanding of galaxy evolution as it absorbs ultraviolet (UV) and optical radiation and re-emits it at infrared (IR) wavelengths.
Several studies have focused on dust-obscured objects and their dust mass (e.g. Gruppioni et al. 2013; Béthermin et al. 2015; Zavala et al. 2021; Gentile et al. 2024a; Traina et al. 2024a,b) and on objects so deeply obscured to be extremely faint or completely undetected in the rest-frame optical and UV (e.g. Rodighiero et al. 2007; Simpson et al. 2014; Franco et al. 2018; Wang et al. 2019; Talia et al. 2021; Gruppioni et al. 2020; Enia et al. 2022; Gentile et al. 2024b). To our understanding, dust-obscured galaxies dominate the cosmic star formation budget at least out to z = 4 − 5 (Zavala et al. 2017; Magnelli et al. 2024; Traina et al., in prep.) and the massive end of the stellar mass function (Rodighiero et al. 2007; Caputi et al. 2015; Wang et al. 2016, 2019). However, all these studies were hampered by the faintness of these objects in the optical and the limitations of IR instruments, which impacts the robustness of derived physical parameters and, as a consequence, our understanding of these galaxies. The James Webb Space Telescope (JWST) is finally allowing us to observe the stellar continuum of these objects with high angular resolution and sensitivity, enabling the study of dust-obscured objects to higher redshifts and lower stellar masses than previously feasible (e.g. Pérez-González et al. 2023; Rodighiero et al. 2023; Xiao et al. 2024; Wang et al. 2024; Williams et al. 2024).
In this respect, the studies by Bisigello et al. (2023) and Rodighiero et al. (2023) indicate the presence of a possible population of dust-obscured galaxies with low stellar masses. These objects were unexpected given that the dust extinction (Av) of star-forming galaxies has a positive correlation with stellar mass (M*), with more massive galaxies being generally dustier, whereas low-mass galaxies (with M∗ < 108.5 M⊙) typically have a negligible dust content (Pannella et al. 2015; McLure et al. 2018; Shapley et al. 2023; Liu et al. 2024). In fact, dust is produced by mass loss from asymptotic giant branch stars and supernova ejecta (e.g. Gall et al. 2011; Sarangi et al. 2018), so an increase in star formation results in an increase in stellar mass and dust mass. Moreover, stellar-feedback-driven outflows can efficiently expel metal-enriched gas from low-mass galaxies, given their low gravitational potential (Dayal et al. 2013). In addition, dust in low-mass galaxies has a much larger scale height and thus appears more diffuse than in massive ones, resulting in an overall lower dust extinction (Dalcanton et al. 2004). Thus, abundant dust extinction in low-mass systems is unexpected and could have a non-negligible impact on the overall cosmic star formation budget. The results presented in Bisigello et al. (2023) and Rodighiero et al. (2023), based on photometric data only, must therefore be confirmed with robust spectroscopic measurements.
In this Letter we present the first spectroscopic confirmation of a high dust extinction in a low-mass galaxy at z = 4.88, using JWST NIRSpec (Near-Infrared Spectrograph) PRISM data. We present the observations in Sect. 2, the analysis in Sect. 3, and discuss the main findings and their interpretation in Sect. 4. We summarise our results in Sect. 5. Throughout the paper, we assume a Λ cold dark matter cosmology with H0 = 70 km s−1 Mpc−1, Ωm = 0.27, and ΩΛ = 0.73 and a Kroupa initial mass function (Kroupa 2001), and all magnitudes are in the AB system (Oke & Gunn 1983).
2. Data
2.1. Photometry
We used the source catalogue from Finkelstein et al. (2024), which is based on the v0.6 release of the imaging data (Bagley et al. 2023) of the Cosmic Evolution Early Release Science Survey (CEERS; P.I. Finkelstein) covering the Extended Groth Strip. These data include observations in seven NIRCam broad and medium bands (F115W, F150W, F200W, F277W, F356W, F444W, and F410M). In addition, there are deep Hubble Space Telescope (HST) observations (Grogin et al. 2011; Koekemoer et al. 2011) in six filters (ACS/WFC F606W, F814W, and WFC3/IR F105W, F125W, F140W, and F160W).
As explained in detail in Finkelstein et al. (2024), photometric fluxes were derived with the Source Extractor (v2.25.0 Bertin & Arnouts 1996) in dual-image mode, using as detection images the inverse variance weighted images of the F277W and F356W bands at the native resolution. The fluxes were measured in each HST and JWST image on small elliptical Kron apertures, corrected for any missing flux by comparing them with larger Kron apertures. We refer to Finkelstein et al. (2023, 2024) for further details.
CEERS-14821 (RA = 214.917994, Dec = 52.937245) is part of a larger sample of highly extincted low-mass (HELM) galaxy candidates (∼4000 objects; Bisigello et al., in prep.). The selection was performed considering the multi-parameter probability distribution of M* and AV obtained by fitting the photometric data using the spectral energy distribution (SED) fitting code BAGPIPES (Bayesian Analysis of Galaxies for Physical Inference and Parameter EStimation; Carnall et al. 2018) with different configurations. The sample notably includes objects with a more than 68% probability of being either a galaxy with a low stellar mass and Av > 1 or a galaxy with a higher mass and a dust extinction above the expectations:
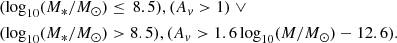 (1)
(1)
Given the finding of no redshift evolution in the Av − M* relation at least out to z = 6.5 (Shapley et al. 2023), we chose to not evolve the selection either. CEERS-14821 had a 96.8% probability of being inside the selection and is the only object with available spectroscopic data. For further details on the SED fitting and selection criterion, we refer to Bisigello et al. (in prep.). In Appendix A we report the images and the photometric fluxes. CEERS-14821 is robustly detected in the four filters at the longest wavelengths, and it is spatially resolved in two of them (F277W and F356W).
2.2. Spectroscopy
NIRSpec Micro Shutter Array (MSA; Ferruit et al. 2022) spectra of CEERS-14821 were taken as part of programme DD-2750 (P.I. Arrabal Haro; Arrabal Haro et al. 2023a), in which the source (MSA ID D2015) was observed in three visits each with three integrations of nine or ten groups in NRSIRS2 readout mode, for a total of 18 387 s (∼5.1 h) of combined integration time. The configuration employed three-shutter slitlets to enable a three-point nodding pattern and made use of the NIRSpec prism, providing a complete wavelength coverage from 0.6 to 5.3 μm (corresponding to the 0.1–0.9 μm rest frame at z = 4.883) at a variable spectral resolution (R ≈ 30 − 300 from blue to red). The data reduction followed the process described in Arrabal Haro et al. (2023b), with the additional improvements mentioned below that will be further detailed in Arrabal Haro (in prep.). The Calibration Reference Data System (CRDS) mapping 1227 was used with the STScI calibration pipeline1 (Bushouse et al. 2024) version 1.14.0. During the reduction process, a custom correction was applied to the FAST_VARIATION extension of the NIRSpec FFLAT, which would otherwise result in an unrealistically low signal-to-noise ratio (S/N) in the 2.5–3 μm range. A default pipeline pathloss correction was adopted to partly account for slit losses, and a further calibration via a comparison to the NIRCam photometry was carried out to correct for this effect (see Sect. 3.1). The resulting spectrum from each independent visit after a nodding combination was inspected to identify and remove any remaining hot pixels or image defects, making use of the Mosviz visualisation tool2 (JDADF Developers et al. 2023). After that, the masked independent visits were combined with an inverse variance weighting. It is important to note that all the visits in the DD-2750 programme employed the same pointing and MSA configuration. Thus, the target source was at the exact same location within its shutter in all the visits, which facilitated their combination as no spatial or spectral resampling was required in the process. The final 1D spectrum presented in Fig. B.1 was extracted from the combined 2D spectrum following the optimal extraction prescriptions in Horne (1986).
3. Analysis
3.1. Emission line fitting
The flux of each nebular emission line was derived by fitting a Gaussian function to the spectrum, after removing the stellar continuum and taking the slit loss into account. The fit was performed simultaneously when the lines were blended. In particular, Hα, [N II] 6548 Å, and [N II] 6584 Å are severely blended, making their flux estimates highly covariant and impacting our results (see Appendix B). We give all the details of the fit in Appendix B, and we report the measured line fluxes in Table B.1.
From the Hα/Hβ ratio (i.e. 5.42 ± 0.85), assuming a case-B recombination at T = 1.5 × 10⁴ K (i.e. Hα/Hβ = 2.86) and the Calzetti et al. (2000, hereafter C00) reddening law, we derived a dust extinction in the V band of  . The value is even larger if we consider the Charlot & Fall (2000, hereafter CF00) reddening law with a slope of –0.7, which results in
  , and it remains above Av, neb = 1 even if we consider extremely steep dust extinction slopes (Appendix C). The S/N of the Hγ/Hβ ratio is unfortunately too low to give significant results, and moreover, the Hγ is blended with the [O III] 4663 Å line. We also used the dust-corrected Hα flux, which is sensitive to recent star formation (< 10 Myr), to extract the star formation rate (SFR) using the relation from Kennicutt & Evans (2012). We estimate a
  and
and 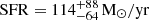 based on the C00 and CF00 reddening laws, respectively. Consistent SFR estimates are derived from the dust-corrected Hβ line.
We used the [O III] 5007 Å/Hβ ratio (R3) to estimate the gas-phase metallicity, obtaining 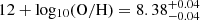 with the Curti et al. (2024) relation. We derived a consistent estimate using the Nakajima et al. (2022) relation. We note that R3 depends on the ionisation parameter of the gas and is a double-value calibrator. The low-metallicity estimation is
 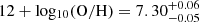 . The lower limit on the [O III] 5007 Å/O II] 3727 Å ratio (O32), which is a metallicity estimation, is 12+log10(O/H) < 8.46; this is not sufficient to discriminate between the two R3 estimations. The Hα and [N II] 6584 Å lines, whose ratio (N2) can also be used to estimate the gas-phase metallicity, are severely blended. Taking this ratio with extreme caution and using the Curti et al. (2024) relation, or similarly the Pettini & Pagel (2004) and Nakajima et al. (2022) relations, we obtain a higher metallicity,
 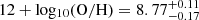 . The 5σ upper limit on the [S II] 6717,6731 Å/Hα (S2), again based on the Curti et al. (2024) relation, gives an upper limit on the gas-phase metallicity of 12+log10(O/H) < 8.54, which is consistent with both R3 estimates. Finally, if we estimate the Hγ line from the Hβ line, assuming case-B recombination, we obtain an estimate for the [O III] 4636 Å flux, as the two lines are blended. The [O III] 4636 Å line, combined with the [O III] 4859 Å and [O III] 5007 Å lines, can then be used to estimate the electron temperature of the high-ionisation region (t3; Pérez-Montero 2017). The electron temperature of the low-ionisation region (t2) can then be estimated using the Pilyugin et al. (2009) relation. These temperatures, combined with the ionic abundances of oxygen (Pérez-Montero 2017), can then be used to directly estimate the metallicity. We propagated the uncertainties on the [O III] 5007 Å and Hβ lines, as well as that on the dust extinction, deriving a value of
  , which is inconsistent with the R3 high-metallicity estimation. However, it is necessary to understand that an underestimation of the [O III] 4363 Å auroral line, due to stellar absorption in the continuum or an underestimation of the dust extinction, would result in an underestimation of the metallicity. On the other hand, we only have upper limits for the [O II] 3727 Å emission line, which indicates that the overall metallicity could be overestimated. We discuss these results further in Sect. 4 and report the derived physical properties in Table 1.
Derived physical properties of CEERS-14821.
3.2. Physical size
To estimate the physical size of this galaxy, we derived the radial profile in the two filters where the galaxy is detected and resolved. We then fitted it with a Sérsic profile (Sersic 1968) convolved with the JWST point spread function (PSF) taken from WebbPSF V1.1.0 (Perrin et al. 2012). We derived an effective radius of  kpc (corresponding to
  ) in the F277W filter and
  kpc (corresponding to
  ) in the F356W filter. Cutouts of CEERS-14821 in all HST and JWST filters are shown in Fig. A.1, and we show the light profiles in Fig. A.2.
3.3. Spectro-photometric SED fitting
We performed a combined spectro-photometric fit using the 13 HST and NIRCam filter observations and the NIRSpec spectrum, including both nebular lines and stellar continuum. The spectrum was normalised using a second-order polynomial (see Sect. 3.1). To perform the SED fitting, we used the BAGPIPES code, fixing the redshift to the measured spectroscopic value. We considered two different dust extinction laws (CF00; CF00) and used the values derived from the Balmer decrement as priors for AV, rescaling them to take the differential attenuation into account. In addition, in an attempt to verify or rule out the presence of an active galactic nucleus (AGN), we not only used several line diagnostics (see Sect. 4), but we also fitted the available photometry with the CIGALE code (Boquien et al. 2019) using similar parameters and priors. In Appendix D we give more information on the fits and the configurations used. We consider the BAGPIPES results as the fiducial ones, but CEERS-14821 is consistent with being a dusty dwarf even with CIGALE.
4. Discussion
In Table 1 we summarise the physical properties of CEERS-14821 derived from the images, the line fluxes, and the BAGPIPES spectro-photometric SED fitting.
The first surprising result is the high AV measured given the stellar mass of this object (Fig. 1). We can take as reference the continuum A1600, cont − M* relation from McLure et al. (2018). This relation was derived considering galaxies at 2 < z < 3 and with 9.25 ≤ log(M∗/M⊙) ≤ 10.75, but it has been shown to be consistent with other works at similar or higher redshifts (Shapley et al. 2022, 2023). Using this A1600, cont − M* relation, we would expect a dust extinction at 1600 Å of A1600, cont ≤ 0.8 considering our uncertainties on the stellar mass. This would correspond to AV, cont ≤ 0.33 with the CF00 reddening law and AV, cont = 0 with the C00 reddening law. Even after taking into account the differential attenuation of the nebular emission with respect to the stellar UV-optical continuum (known as the f-factor), which can be a factor of two to three (e.g. Calzetti et al. 1994; Charlot & Fall 2000; Kreckel et al. 2013; Talia et al. 2015; Buat et al. 2018; Rodríguez-Muñoz et al. 2022), it is clear that our source is much more dust extinguished than expected given its stellar mass. Similarly, in the First Light And Reionization Epoch Simulations (FLARES), the majority of galaxies (84%) with M∗ = 108 M⊙ at z = 5 have A1500 < 0.4 with a few extending up to A1500 = 1 (Vijayan et al. 2021), which is still too low compared with CEERS-14821. The peculiar dusty nature of CEERS-14821 is also supported by the fact that sources with similar stellar masses are expected to have an extremely blue UV-continuum slope, such as β = −2, but the UV continuum is so obscured in CEERS-14821 that it is undetected (i.e. fF814W = 6.41 ± 5.78 nJy).
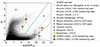 |
Fig. 1. Stellar mass vs dust extinction. We compare CEERS-14821 (coloured stars) with the complete CEERS sample (black dots; Bisigello et al., in prep.) at all redshifts. We also show the median values of other samples of dusty objects (Alcalde Pampliega et al. 2019; Pérez-González et al. 2023; Gentile et al. 2024a) and low-mass dusty galaxies (Rodighiero et al. 2023; Euclid Collaboration 2023) from the literature. We report the selection criteria for highly extincted low-mass galaxies in Eq. (1) (solid blue line; Bisigello et al., in prep.) and the relation between stellar mass and AV from the literature (dashed coloured lines; McLure et al. 2018; Lorenz et al. 2024). |
Given that dust content is closely related to gas metallicity, an obvious step is to look at the mass-metallicity relation (MZR; Tremonti et al. 2004; Maiolino & Mannucci 2019). If we consider the relation at z = 3 − 6 from Curti et al. (2024), based on JWST PRISM data, we would expect to observe a gas-phase metallicity around 12+log10(O/H) = 7.7−7.9 given the stellar mass (Fig. 2). As mentioned previously, the gas-phase metallicity derived using the R3 method, which is the most robust given the available data, gives two possible results, one above and one below the expectation based on the MZR. Considering the results from the N2 tracer, which, however, is severely affected by blending, and from the spectro-photometric SED fitting, the high-metallicity result would be preferred. This result is, however, slightly in tension with the direct method estimation, which is limited by the blending between Hγ and [O III] 4363 Å. If we consider the expectation on the gas-phase metallicity from the fundamental metallicity relation (FMR; Mannucci et al. 2010), including also the secondary dependence on the SFR, there is a clear discrepancy with both R3 estimations. We would expect 12+log10(O/H) < 6 using the parametrisation from Curti et al. (2020) and the SFR estimated based on the Hα line, as the metallicity decreases with the SFR at a fixed stellar mass. We can therefore postulate that the ISM of this galaxy has not only a relatively high dust content but possibly also a high gas-phase metallicity as compared to the bulk of the population with similar stellar masses and redshifts that follow the MZR and, particularly, the FMR.
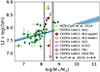 |
Fig. 2. Comparison between the gas-phase metallicity of CEERS-14821 (coloured stars, slightly shifted horizontally for clarity) with the MZR (solid blue line) and other galaxies (green circles) at z = 4 − 6 (Curti et al. 2024). Vertical grey shadows show the stellar mass of CEERS-14821 derived based on the two different dust extinction laws. |
The star formation history derived from the spectro-photometric fit indicates that the galaxy is going through a burst of star formation (Fig. D.2). If we consider the main sequence of star-forming galaxies derived at 4 ≤ z < 5 by Santini et al. (2017), we see that a galaxy with the stellar mass of CEERS-14821 is expected to have a SFR = 0.6−2.6 M⊙/yr. Similarly, if we consider the sequence derived by Cole et al. (2023) using a timescale for the SFR of 10 Myr, the galaxy is above the SFR expected based on its stellar mass, while it is in line with expectations if we consider the SFR over a longer timescale (i.e. 100 Myr). Therefore, CEERS-14821 is above the main sequence if we consider its current burst of star formation, but determining by how much strongly depends on the dust-extinction law considered.
Extrapolating the relation between stellar mass and size from Ward et al. (2024), estimated for z = 3 − 5 star-forming galaxies with log10(M/M⊙) > 9.5, we derive a size of  to
to  kpc, depending on the assumed stellar mass of CEERS-14821. This is consistent with the measured size. However, if we compare CEERS-14821 with the sample from Ono et al. (2024) at a similar redshift, which spans brighter galaxies, we derive that our source is larger than expected given the observed size-luminosity relation at z = 5. CEERS-14821 is also larger than the general population of ‘little red dots’ (e.g. Furtak et al. 2023; Baggen et al. 2024; Matthee et al. 2024; Guia et al. 2024). However, the available observations trace the rest-frame optical and are sensitive to the stellar mass. We would need UV or IR data to trace the size of the star-forming regions, which indeed could be more compact (Puglisi et al. 2019). At the same time, the presence of dust can make galaxies appear larger since it smooths the light profile (Roper et al. 2023; Costantin et al. 2023). Therefore, current data indicate that compactness (a high AV due to geometry with an overall normal dust content) is likely not the cause of the high AV. However, more observations at higher angular resolution are necessary for a definitive answer.
We also attempted to confirm or rule out the presence of an AGN using the Baldwin et al. (1981) AGN diagnostic (BPT) diagram. This is fundamental given that the presence of an AGN would impact our derivation of the SFR and the gas-phase metallicity, which is based on the assumption that the galaxy is dominated by star formation. With the separation described by Kewley et al. (2013) and Kauffmann et al. (2003), we find that CEERS-14821 is in the composite region. We highlight that CEERS-14821 has an almost-solar metallicity, and therefore the BPT diagram should still be able to discriminate the presence of an AGN; this is not possible with other broad-line AGNs observed at similar redshifts that have very low metallicities (e.g. Übler et al. 2023; Maiolino et al. 2024).
At the same time, based on the criterion from Kewley et al. (2006), the upper limit on the [S II] 6717,6731 Å doublet places CEERS-14821 right on the separation line between star-forming and AGN-dominated systems. This indicates a significant star-forming contribution. The upper limit on the [O I] 6300 Å/Hα ratio also implies that CEERS-14821 is dominated by star formation, again using the separation reported by Kewley et al. (2006). The low spectral resolution of the spectrum prevents us from instead using the kinematics-excitation diagram (Zhang & Hao 2018) since the [O III] 5007 Å line is unresolved. Similarly, the upper limit on the He II 4686 Å line flux, unlike the measured Hβ flux, is not stringent enough to rule out the presence of an AGN based on the relation from Shirazi & Brinchmann (2012), as log(He II/Hβ)< − 0.28. Finally, the SED fitting, performed on the photometric data and including an AGN component, does not require a luminous AGN component, as the ratio of the AGN luminosity over the dust luminosity is fAGN = 0.22 ± 0.27 (see Appendix D.2). Overall, there are no stringent and conclusive results, and we cannot completely rule out the presence of an AGN with the current data. However, the minimal evidence available points to, at most, a non-dominant contribution by an AGN.
Different works have reported a possible galaxy overdensity at z = 4.88 − 4.91 in the CEERS field (Naidu et al. 2022; Arrabal Haro et al. 2023a; de Graaff et al. 2024), including 14 objects spectroscopically confirmed and a bright sub-millimetre galaxy with a consistent photometric redshift (Zavala et al. 2023). However, the closest spectroscopically confirmed object is 31 ± 1 Mpc from CEERS-14821. Therefore, none of the confirmed galaxies seem to be closely interacting with CEERS-14821, but further analyses are needed to understand if the high AV is driven by galaxy interactions.
5. Summary
In this work we present the study of a z = 5 dusty dwarf galaxy, CEERS-14821, based on broadband HST and JWST/NIRCam photometric data and JWST/NIRSpec spectroscopic data. We performed a detailed spectro-photometric analysis of this object, finding that it has a low stellar mass of  or
or 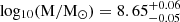 , depending on the dust extinction law. Moreover, the galaxy also has a dust-rich and possibly metal-rich ISM. In particular, using the Balmer decrement, we measure
  and
and  based on the Calzetti et al. (2000) and Charlot & Fall (2000) reddening laws, respectively. In both cases, the AV is well above the value expected given the low mass of CEERS-14821. At the same time, the gas-phase metallicity derived from the [O III] 5007 Å/Hβ ratio, combined with the SED-fitting results, is 12+log10(O/H)] = 8.38 ± 0.04. However, based on the spectroscopic data alone, we are unable to totally rule out the secondary solution at
 ![Mathematical equation: $ \rm 12+log_{10}(O/H)]=7.30_{-0.05}^{+0.06} $](/articles/aa/full_html/2025/01/aa52604-24/aa52604-24-eq37.gif) . If the high-metallicity value is confirmed, it is well above the expectations based on the MZR. Both metallicity values are above the FMR given that, based on the spectro-photometric fit, CEERS-14821 seems to be going through a burst of star formation.
. If the high-metallicity value is confirmed, it is well above the expectations based on the MZR. Both metallicity values are above the FMR given that, based on the spectro-photometric fit, CEERS-14821 seems to be going through a burst of star formation.
The origin of the star formation burst and the richness of the ISM is still unclear. We confirm that CEERS-14821 has an optical size compatible with that of galaxies of similar masses and at similar redshifts, which rules out compactness as a reason for the large AV. We used several diagnostics in an attempt to confirm or rule out the presence of an AGN; while deeper spectroscopic data are needed to place stronger constraints, our current assessment points towards, at most, a non-dominant AGN contribution (fAGN < 0.5). At the same time, CEERS-14821 appears not to be interacting with other nearby objects.
Spectroscopic data at higher spectral resolution are necessary to shed more light on the nature of this peculiar object, that is, to more robustly estimate the gas-phase metallicity and to look for a possible broad component in the hydrogen lines due to AGN activity.
Data availability
Appendix D is available online at the following link: https://doi.org/10.5281/zenodo.14551458.
Acknowledgments
LB acknowledges support from INAF under the Large Grant 2022 funding scheme (project “MeerKAT and LOFAR Team up: a Unique Radio Window on Galaxy/AGN co-Evolution”). This research made use of Photutils, an Astropy package for detection and photometry of astronomical sources (Bradley et al. 2023).
References
- Alcalde Pampliega, B., Pérez-González, P. G., Barro, G., et al. 2019, ApJ, 876, 135 [NASA ADS] [CrossRef] [Google Scholar]
- Arrabal Haro, P., Dickinson, M., Finkelstein, S. L., et al. 2023a, Nature, 622, 707 [NASA ADS] [CrossRef] [Google Scholar]
- Arrabal Haro, P., Dickinson, M., Finkelstein, S. L., et al. 2023b, ApJ, 951, L22 [NASA ADS] [CrossRef] [Google Scholar]
- Baggen, J. F. W., van Dokkum, P., Brammer, G., et al. 2024, ApJ, 977, L13 [NASA ADS] [CrossRef] [Google Scholar]
- Bagley, M. B., Finkelstein, S. L., Koekemoer, A. M., et al. 2023, ApJ, 946, L12 [NASA ADS] [CrossRef] [Google Scholar]
- Baldwin, J. A., Phillips, M. M., & Terlevich, R. 1981, PASP, 93, 5 [Google Scholar]
- Bertin, E., & Arnouts, S. 1996, A&AS, 117, 393 [NASA ADS] [CrossRef] [EDP Sciences] [Google Scholar]
- Béthermin, M., Daddi, E., Magdis, G., et al. 2015, A&A, 573, A113 [Google Scholar]
- Bisigello, L., Gandolfi, G., Grazian, A., et al. 2023, A&A, 676, A76 [NASA ADS] [CrossRef] [EDP Sciences] [Google Scholar]
- Boquien, M., Burgarella, D., Roehlly, Y., et al. 2019, A&A, 622, A103 [NASA ADS] [CrossRef] [EDP Sciences] [Google Scholar]
- Boquien, M., Buat, V., Burgarella, D., et al. 2022, A&A, 663, A50 [NASA ADS] [CrossRef] [EDP Sciences] [Google Scholar]
- Bradley, L., Sipőcz, B., Robitaille, T., et al. 2023, https://doi.org/10.5281/zenodo.7946442 [Google Scholar]
- Buat, V., Boquien, M., Małek, K., et al. 2018, A&A, 619, A135 [NASA ADS] [CrossRef] [EDP Sciences] [Google Scholar]
- Bushouse, H., Eisenhamer, J., Dencheva, N., et al. 2024, https://doi.org/10.5281/zenodo.10870758 [Google Scholar]
- Calzetti, D., Kinney, A. L., & Storchi-Bergmann, T. 1994, ApJ, 429, 582 [Google Scholar]
- Calzetti, D., Armus, L., Bohlin, R. C., et al. 2000, ApJ, 533, 682 [NASA ADS] [CrossRef] [Google Scholar]
- Caputi, K. I., Ilbert, O., Laigle, C., et al. 2015, ApJ, 810, 73 [Google Scholar]
- Carnall, A. C., McLure, R. J., Dunlop, J. S., & Davé, R. 2018, MNRAS, 480, 4379 [Google Scholar]
- Charlot, S., & Fall, S. M. 2000, ApJ, 539, 718 [Google Scholar]
- Chevallard, J., Charlot, S., Wandelt, B., & Wild, V. 2013, MNRAS, 432, 2061 [CrossRef] [Google Scholar]
- Cole, J. W., Papovich, C., Finkelstein, S. L., et al. 2023, arXiv e-prints [arXiv:2312.10152] [Google Scholar]
- Costantin, L., Pérez-González, P. G., Vega-Ferrero, J., et al. 2023, ApJ, 946, 71 [NASA ADS] [CrossRef] [Google Scholar]
- Curti, M., Mannucci, F., Cresci, G., & Maiolino, R. 2020, MNRAS, 491, 944 [Google Scholar]
- Curti, M., Maiolino, R., Curtis-Lake, E., et al. 2024, A&A, 684, A75 [NASA ADS] [CrossRef] [EDP Sciences] [Google Scholar]
- Dalcanton, J. J., Yoachim, P., & Bernstein, R. A. 2004, ApJ, 608, 189 [NASA ADS] [CrossRef] [Google Scholar]
- Dayal, P., Ferrara, A., & Dunlop, J. S. 2013, MNRAS, 430, 2891 [Google Scholar]
- de Graaff, A., Setton, D. J., Brammer, G., et al. 2024, arXiv e-prints [arXiv:2404.05683] [Google Scholar]
- Draine, B. T. 2003, ARA&A, 41, 241 [NASA ADS] [CrossRef] [Google Scholar]
- Enia, A., Talia, M., Pozzi, F., et al. 2022, ApJ, 927, 204 [NASA ADS] [CrossRef] [Google Scholar]
- Euclid Collaboration (Bisigello, L., et al.) 2023, MNRAS, 520, 3529 [NASA ADS] [CrossRef] [Google Scholar]
- Ferruit, P., Jakobsen, P., Giardino, G., et al. 2022, A&A, 661, A81 [NASA ADS] [CrossRef] [EDP Sciences] [Google Scholar]
- Finkelstein, S. L., Bagley, M. B., Ferguson, H. C., et al. 2023, ApJ, 946, L13 [NASA ADS] [CrossRef] [Google Scholar]
- Finkelstein, S. L., Leung, G. C. K., Bagley, M. B., et al. 2024, ApJ, 969, L2 [NASA ADS] [CrossRef] [Google Scholar]
- Franco, M., Elbaz, D., Béthermin, M., et al. 2018, A&A, 620, A152 [NASA ADS] [CrossRef] [EDP Sciences] [Google Scholar]
- Furtak, L. J., Zitrin, A., Plat, A., et al. 2023, ApJ, 952, 142 [NASA ADS] [CrossRef] [Google Scholar]
- Gall, C., Hjorth, J., & Andersen, A. C. 2011, A&ARv, 19, 43 [NASA ADS] [CrossRef] [Google Scholar]
- Gentile, F., Talia, M., Behiri, M., et al. 2024a, ApJ, 962, 26 [NASA ADS] [CrossRef] [Google Scholar]
- Gentile, F., Talia, M., Daddi, E., et al. 2024b, A&A, 687, A288 [NASA ADS] [CrossRef] [EDP Sciences] [Google Scholar]
- González Delgado, R. M., Cerviño, M., Martins, L. P., Leitherer, C., & Hauschildt, P. H. 2005, MNRAS, 357, 945 [Google Scholar]
- Grogin, N. A., Kocevski, D. D., Faber, S. M., et al. 2011, ApJS, 197, 35 [NASA ADS] [CrossRef] [Google Scholar]
- Gruppioni, C., Pozzi, F., Rodighiero, G., et al. 2013, MNRAS, 432, 23 [Google Scholar]
- Gruppioni, C., Béthermin, M., Loiacono, F., et al. 2020, A&A, 643, A8 [NASA ADS] [CrossRef] [EDP Sciences] [Google Scholar]
- Guia, C. A., Pacucci, F., & Kocevski, D. D. 2024, Res. Notes Am. Astron. Soc., 8, 207 [Google Scholar]
- Horne, K. 1986, PASP, 98, 609 [Google Scholar]
- JDADF Developers, Averbukh, J., Bradley, L., et al. 2023, https://doi.org/10.5281/zenodo.7504710 [Google Scholar]
- Kauffmann, G., Heckman, T. M., Tremonti, C., et al. 2003, MNRAS, 346, 1055 [Google Scholar]
- Kennicutt, R. C., & Evans, N. J. 2012, ARA&A, 50, 531 [NASA ADS] [CrossRef] [Google Scholar]
- Kewley, L. J., Groves, B., Kauffmann, G., & Heckman, T. 2006, MNRAS, 372, 961 [Google Scholar]
- Kewley, L. J., Dopita, M. A., Leitherer, C., et al. 2013, ApJ, 774, 100 [NASA ADS] [CrossRef] [Google Scholar]
- Koekemoer, A. M., Faber, S. M., Ferguson, H. C., et al. 2011, ApJS, 197, 36 [NASA ADS] [CrossRef] [Google Scholar]
- Kreckel, K., Groves, B., Schinnerer, E., et al. 2013, ApJ, 771, 62 [NASA ADS] [CrossRef] [Google Scholar]
- Kroupa, P. 2001, MNRAS, 322, 231 [NASA ADS] [CrossRef] [Google Scholar]
- Liu, Z., Morishita, T., & Kodama, T. 2024, arXiv e-prints [arXiv:2406.11188] [Google Scholar]
- Lo Faro, B., Buat, V., Roehlly, Y., et al. 2017, MNRAS, 472, 1372 [NASA ADS] [CrossRef] [Google Scholar]
- Lorenz, B., Kriek, M., Shapley, A. E., et al. 2024, ApJ, 975, 187 [NASA ADS] [CrossRef] [Google Scholar]
- Magnelli, B., Adscheid, S., Wang, T.-M., et al. 2024, A&A, 688, A55 [NASA ADS] [CrossRef] [EDP Sciences] [Google Scholar]
- Maiolino, R., & Mannucci, F. 2019, A&ARv, 27, 3 [Google Scholar]
- Maiolino, R., Scholtz, J., Curtis-Lake, E., et al. 2024, A&A, 691, A145 [NASA ADS] [CrossRef] [EDP Sciences] [Google Scholar]
- Mannucci, F., Cresci, G., Maiolino, R., Marconi, A., & Gnerucci, A. 2010, MNRAS, 408, 2115 [NASA ADS] [CrossRef] [Google Scholar]
- Matthee, J., Naidu, R. P., Brammer, G., et al. 2024, ApJ, 963, 129 [NASA ADS] [CrossRef] [Google Scholar]
- McLure, R. J., Dunlop, J. S., Cullen, F., et al. 2018, MNRAS, 476, 3991 [Google Scholar]
- Naidu, R. P., Oesch, P. A., Setton, D. J., et al. 2022, ApJL, submitted [arXiv:2208.02794] [Google Scholar]
- Nakajima, K., Ouchi, M., Xu, Y., et al. 2022, ApJS, 262, 3 [CrossRef] [Google Scholar]
- Oke, J. B., & Gunn, J. E. 1983, ApJ, 266, 713 [NASA ADS] [CrossRef] [Google Scholar]
- Ono, Y., Harikane, Y., Ouchi, M., et al. 2024, PASJ, 76, 219 [NASA ADS] [CrossRef] [Google Scholar]
- Pannella, M., Elbaz, D., Daddi, E., et al. 2015, ApJ, 807, 141 [Google Scholar]
- Pérez-González, P. G., Barro, G., Annunziatella, M., et al. 2023, ApJ, 946, L16 [CrossRef] [Google Scholar]
- Pérez-Montero, E. 2017, PASP, 129, 043001 [CrossRef] [Google Scholar]
- Perrin, M. D., Soummer, R., Elliott, E. M., Lallo, M. D., & Sivaramakrishnan, A. 2012, Proc. SPIE, 8442, 84423D [NASA ADS] [CrossRef] [Google Scholar]
- Pettini, M., & Pagel, B. E. J. 2004, MNRAS, 348, L59 [NASA ADS] [CrossRef] [Google Scholar]
- Pilyugin, L. S., Mattsson, L., Vílchez, J. M., & Cedrés, B. 2009, MNRAS, 398, 485 [NASA ADS] [CrossRef] [Google Scholar]
- Puglisi, A., Daddi, E., Liu, D., et al. 2019, ApJ, 877, L23 [Google Scholar]
- Rodighiero, G., Cimatti, A., Franceschini, A., et al. 2007, A&A, 470, 21 [NASA ADS] [CrossRef] [EDP Sciences] [Google Scholar]
- Rodighiero, G., Bisigello, L., Iani, E., et al. 2023, MNRAS, 518, L19 [Google Scholar]
- Rodríguez-Muñoz, L., Rodighiero, G., Pérez-González, P. G., et al. 2022, MNRAS, 510, 2061 [Google Scholar]
- Roper, W. J., Lovell, C. C., Vijayan, A. P., et al. 2023, MNRAS, 526, 6128 [NASA ADS] [CrossRef] [Google Scholar]
- Salmon, B., Papovich, C., Long, J., et al. 2016, ApJ, 827, 20 [NASA ADS] [CrossRef] [Google Scholar]
- Santini, P., Fontana, A., Castellano, M., et al. 2017, ApJ, 847, 76 [NASA ADS] [CrossRef] [Google Scholar]
- Sarangi, A., Matsuura, M., & Micelotta, E. R. 2018, Space Sci. Rev., 214, 63 [NASA ADS] [CrossRef] [Google Scholar]
- Seillé, L. M., Buat, V., Haddad, W., et al. 2022, A&A, 665, A137 [NASA ADS] [CrossRef] [EDP Sciences] [Google Scholar]
- Sersic, J. L. 1968, Atlas de Galaxias Australes (Cordoba, Argentina: Observatorio Astronomico) [Google Scholar]
- Shapley, A. E., Sanders, R. L., Salim, S., et al. 2022, ApJ, 926, 145 [NASA ADS] [CrossRef] [Google Scholar]
- Shapley, A. E., Sanders, R. L., Reddy, N. A., Topping, M. W., & Brammer, G. B. 2023, ApJ, 954, 157 [NASA ADS] [CrossRef] [Google Scholar]
- Shirazi, M., & Brinchmann, J. 2012, MNRAS, 421, 1043 [NASA ADS] [CrossRef] [Google Scholar]
- Simpson, J. M., Swinbank, A. M., Smail, I., et al. 2014, ApJ, 788, 125 [Google Scholar]
- Talia, M., Cimatti, A., Pozzetti, L., et al. 2015, A&A, 582, A80 [NASA ADS] [CrossRef] [EDP Sciences] [Google Scholar]
- Talia, M., Cimatti, A., Giulietti, M., et al. 2021, ApJ, 909, 23 [NASA ADS] [CrossRef] [Google Scholar]
- Traina, A., Gruppioni, C., Delvecchio, I., et al. 2024a, A&A, 681, A118 [NASA ADS] [CrossRef] [EDP Sciences] [Google Scholar]
- Traina, A., Magnelli, B., Gruppioni, C., et al. 2024b, A&A, 690, A84 [NASA ADS] [CrossRef] [EDP Sciences] [Google Scholar]
- Tremonti, C. A., Heckman, T. M., Kauffmann, G., et al. 2004, ApJ, 613, 898 [Google Scholar]
- Übler, H., Maiolino, R., Curtis-Lake, E., et al. 2023, A&A, 677, A145 [NASA ADS] [CrossRef] [EDP Sciences] [Google Scholar]
- Vijayan, A. P., Lovell, C. C., Wilkins, S. M., et al. 2021, MNRAS, 501, 3289 [NASA ADS] [Google Scholar]
- Wang, T., Elbaz, D., Schreiber, C., et al. 2016, ApJ, 816, 84 [Google Scholar]
- Wang, T., Schreiber, C., Elbaz, D., et al. 2019, Nature, 572, 211 [Google Scholar]
- Wang, T., Sun, H., Zhou, L., et al. 2024, arXiv e-prints [arXiv:2403.02399] [Google Scholar]
- Ward, E., de la Vega, A., Mobasher, B., et al. 2024, ApJ, 962, 176 [NASA ADS] [CrossRef] [Google Scholar]
- Williams, C. C., Alberts, S., Ji, Z., et al. 2024, ApJ, 968, 34 [NASA ADS] [CrossRef] [Google Scholar]
- Xiao, M., Oesch, P., Elbaz, D., et al. 2024, Nature, 635, 311 [NASA ADS] [CrossRef] [Google Scholar]
- Zavala, J. A., Aretxaga, I., Geach, J. E., et al. 2017, MNRAS, 464, 3369 [NASA ADS] [CrossRef] [Google Scholar]
- Zavala, J. A., Casey, C. M., Manning, S. M., et al. 2021, ApJ, 909, 165 [CrossRef] [Google Scholar]
- Zavala, J. A., Buat, V., Casey, C. M., et al. 2023, ApJ, 943, L9 [NASA ADS] [CrossRef] [Google Scholar]
- Zhang, K., & Hao, L. 2018, ApJ, 856, 171 [NASA ADS] [CrossRef] [Google Scholar]
Appendix A: Images and photometric fluxes
We report in Fig. A.1 the CEERS-14821 cutouts in the available HST and JWST filters, all converted to a pixel scale of 30 mas/pixel. The source is completely undetected at λ ≤ 1.6 μm, barely detected in the F200W (S/N < 2) and robustly detected (S/N > 5) in all filters at λ ≥ 2.7 μm. This would classify this source as a F200W-dropout. CEERS-14821 is also very compact, as it is barely resolved in the F277W and F356W filters and unresolved in the F410M and F444W ones. This is visible in Fig. A.2, where we report the light profiles and their respective models.
In Table A.1 we report the total fluxes measured for CEERS-14821 in the available HST and JWST filters. We highlight that the HST/F140W is particularly affected by large noise, as is also visible from the cutouts.
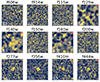 |
Fig. A.1. CEERS-14821 HST and JWST cutouts converted to a pixel scale of 30 mas/pixel. The position of the source is marked with a red cross. We report the scale in arcseconds in the bottom left and the filter PSF (diameter equal to the full-width-half-maximum) in the upper right. |
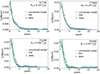 |
Fig. A.2. Light profile of CEERS-14821 in the four filters where it is detected. We show the measure profile (blue squares), the PSF normalised to the central pixel (dotted black line) and the convolved model (solid green line). |
Measured photometry of CEERS-14821.
Appendix B: Line fit
In this appendix we give more information on the continuum subtraction and the line fit applied to derive the line fluxes. The observed spectrum is shown in Fig. B.1.
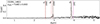 |
Fig. B.1. Observed NIRSpec/PRISM spectrum of CEERS-14821. The vertical lines highlight the visible nebular emission lines. |
First, we applied a multiplicative factor that takes into account wavelength-dependent slit loss. This is derived by fitting a second-order polynomial function to the ratio of the spectrum, convolved with the broadband filters, and the photometric fluxes.
Then, we removed the stellar continuum. Given its low S/N, we decided to consider a simple approach and fit it with a quadratic function, after masking the wavelengths affected by strong nebular emission lines. This simple approach could result in an underestimation of the Hβ and Hγ line fluxes, given that we are not considering possible stellar absorption features. Based on the evolutionary stellar synthesis models by González Delgado et al. (2005), the Hβ absorption feature can have an equivalent width up to 10Å, but given that it strongly depends on stellar age and CEERS-14821 is going through a burst of star formation (see Sect. 4), the contribution is probably smaller. Even in the worst situation, this would underestimate the Hβ flux by less than 10% and overestimate the AV by less than 0.4.
We described each nebular emission line using a Gaussian function. Line fitting was performed in the rest frame, using the redshift derived from the [OIII] 5007Åline, that is, zspec = 4.883 ± 0.003, which is consistent with the redshift reported by de Graaff et al. (2024). Given the low spectral resolution of the PRISM, we left the line centre free to vary within one resolution element (i.e. 10Å for Hβ and 8Å for Hα). The fit was performed simultaneously for [OIII] 5007Å, [OIII] 4959Å, and Hβ, as well as for Hα, [NII] 6548Å, and [NII] 6584Å, due to line blending. In the multicomponent fit, we assumed that the width of the lines is the same and the ratios [OIII] 4959Å/[OIII] 5007Åand [NII] 6584Å/[NII] 6548Åare equal to the theoretical value of one-third. We repeat the fit 1000 times, randomising the flux considering a normal distribution with standard deviation equal to the flux uncertainties. All lines are unresolved or barely resolved. We tried a multicomponent fit also for the [S II]6717,6731 Å doublet, but the S/N is too low, therefore we obtain only an upper limit for the combined line fluxes. The Hγ line could also be contaminated by the [O III]4363Å line, but given the overall low S/N we do not try to deblend them.
In Fig. B.2 we report the multi-component fit of the Hα, [ ] 6548Å, and [N II] 6584Å as well as the fit of the Hβ, [O III] 5007Å, and [O III] 4959Å. As visible from the residuals, the fits are consistent with the data within the flux uncertainties. However, while the necessity for three components in the second case is obvious, the line blending is more severe in the Hα+ [NII] complex. Using the Kolmogorov-Smirnov test, the difference among the residuals considering a single Gaussian component and three components is not significant. The difference in the reduced χ2 is Δχ2 = 0.3, with the multi-component fit showing the lowest χ2. Looking instead at the Bayesian information criterion (BIC), the multicomponent fit is preferred to the single-component fit, since for the single Gaussian fit we obtain BIC = 71.0, while for the multicomponent fit we derived a lower value of BIC = 63.4. Overall, the improvement in the fit when considering the [N II] 6548Å and [N II] 6584Å lines is present, but its statistical importance is limited.
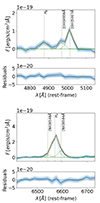 |
Fig. B.2. Multi-component fit of the Hβ, [O III] 4959Å and [O III] 5007Å lines (top) and the Hα, [N II] 6548Å and [N II] 6584Å lines (bottom). The solid blue lines show the observed continuum-subtracted spectrum, with the blue shaded areas indicating the 1σ, 2σ, and 3σ uncertainties. Dotted green lines show the different components of the fit, while the orange dashed lines show the total model. Grey vertical lines show the expected center of the nebular emission lines. The bottom panels show the residuals of the fit. The spectral resolution is around R = 100 near Hβ and R = 200 near Hα. |
In Fig. B.3 we show the fluxes of Hα and [N II] 6584Å derived by repeating the multicomponent fit 1000 times and randomly evaluating the observed fluxes within the uncertainties each time. As expected, an anticorrelation is present, where the [N II] 6584Å flux increases with decreasing Hα flux. We took this degeneracy into account when deriving the gas-phase metallicity using these nebular emission lines, but this result needs to be taken with caution. If we instead consider a single-component fit, given the reduced improvement when including the [N II] 6548Å and [N II] 6584Å lines, we obtain a total flux of fHα = (116.93 ± 2.50) × 10−19 erg/s/cm2. This would increase even more the dust-extinction derived from the Balmer decrement, up to AV = 3.1 ± 0.4 with C00 and  with CF00. However, we would also discard the estimate of the gas-phase metallicity based on the [N II] 6584Å line. Overall, spectroscopic data at higher spectral resolution are necessary to properly estimate dust extinction and gas-phase metallicity, but CEERS-14821 still has a large dust extinction, even if we consider a single-Gaussian component to describe the Hα+[N II] complex.
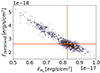 |
Fig. B.3. Hα and [N II] 6584Å flux estimates, derived by applying a multi-component fit to 1000 different randomisations of the observed fluxes. Solid red lines indicate the median values reported in Table B.1, while the coloured contours show the 20%, 40%, 60%, and 80% of the distribution. |
In Table B.1 we report the measured fluxes and upper limits of the nebular emission lines.
Measured line fluxes.
Appendix C: Impact of the reddening law slope
Previous studies have observed a flattening of the attenuation curve with increasing AV (e.g. Chevallard et al. 2013; Salmon et al. 2016; Lo Faro et al. 2017; Boquien et al. 2022; Seillé et al. 2022), which would impact the physical properties derived. We therefore derived again the dust extinction based on the observed Hα/Hβ line ratio, but assuming the dust extinction by CF00 with the slope free to vary. As visible in Fig. C.1, even considering extremely steep dust-extinction curves (i.e. δBC = −2.) we would measure AV > 1, which is still too large for a galaxy with the stellar mass of CEERS-14821. Based on the study by Boquien et al. (2022), which however includes galaxies with stellar masses above 109.25 M⊙, an overestimation in the dust-extinction slope would result in an overestimation of the stellar mass up to 0.3 dex, slightly increasing the tension with the literature stellar mass vs. dust extinction relation. In contrast, if we consider a flat dust extinction curve, the stellar mass could be underestimated by 0.3 dex (Boquien et al. 2022), but at the same time the dust extinction rapidly diverges to values above AV = 4. Therefore, even if we change the slope of the dust extinction, CEERS-14821 remains an outlier in the M* − AV relation.
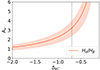 |
Fig. C.1. Dust extinction values derived for different slopes of the dust extinction law, considering the observed Hα/Hβ line ratio. The vertical dotted line shows the value of δBC = −0.7. |
All Tables
All Figures
|
Fig. 1. Stellar mass vs dust extinction. We compare CEERS-14821 (coloured stars) with the complete CEERS sample (black dots; Bisigello et al., in prep.) at all redshifts. We also show the median values of other samples of dusty objects (Alcalde Pampliega et al. 2019; Pérez-González et al. 2023; Gentile et al. 2024a) and low-mass dusty galaxies (Rodighiero et al. 2023; Euclid Collaboration 2023) from the literature. We report the selection criteria for highly extincted low-mass galaxies in Eq. (1) (solid blue line; Bisigello et al., in prep.) and the relation between stellar mass and AV from the literature (dashed coloured lines; McLure et al. 2018; Lorenz et al. 2024). |
| In the text | |
|
Fig. 2. Comparison between the gas-phase metallicity of CEERS-14821 (coloured stars, slightly shifted horizontally for clarity) with the MZR (solid blue line) and other galaxies (green circles) at z = 4 − 6 (Curti et al. 2024). Vertical grey shadows show the stellar mass of CEERS-14821 derived based on the two different dust extinction laws. |
| In the text | |
|
Fig. A.1. CEERS-14821 HST and JWST cutouts converted to a pixel scale of 30 mas/pixel. The position of the source is marked with a red cross. We report the scale in arcseconds in the bottom left and the filter PSF (diameter equal to the full-width-half-maximum) in the upper right. |
| In the text | |
|
Fig. A.2. Light profile of CEERS-14821 in the four filters where it is detected. We show the measure profile (blue squares), the PSF normalised to the central pixel (dotted black line) and the convolved model (solid green line). |
| In the text | |
|
Fig. B.1. Observed NIRSpec/PRISM spectrum of CEERS-14821. The vertical lines highlight the visible nebular emission lines. |
| In the text | |
|
Fig. B.2. Multi-component fit of the Hβ, [O III] 4959Å and [O III] 5007Å lines (top) and the Hα, [N II] 6548Å and [N II] 6584Å lines (bottom). The solid blue lines show the observed continuum-subtracted spectrum, with the blue shaded areas indicating the 1σ, 2σ, and 3σ uncertainties. Dotted green lines show the different components of the fit, while the orange dashed lines show the total model. Grey vertical lines show the expected center of the nebular emission lines. The bottom panels show the residuals of the fit. The spectral resolution is around R = 100 near Hβ and R = 200 near Hα. |
| In the text | |
|
Fig. B.3. Hα and [N II] 6584Å flux estimates, derived by applying a multi-component fit to 1000 different randomisations of the observed fluxes. Solid red lines indicate the median values reported in Table B.1, while the coloured contours show the 20%, 40%, 60%, and 80% of the distribution. |
| In the text | |
|
Fig. C.1. Dust extinction values derived for different slopes of the dust extinction law, considering the observed Hα/Hβ line ratio. The vertical dotted line shows the value of δBC = −0.7. |
| In the text | |
Current usage metrics show cumulative count of Article Views (full-text article views including HTML views, PDF and ePub downloads, according to the available data) and Abstracts Views on Vision4Press platform.
Data correspond to usage on the plateform after 2015. The current usage metrics is available 48-96 hours after online publication and is updated daily on week days.
Initial download of the metrics may take a while.