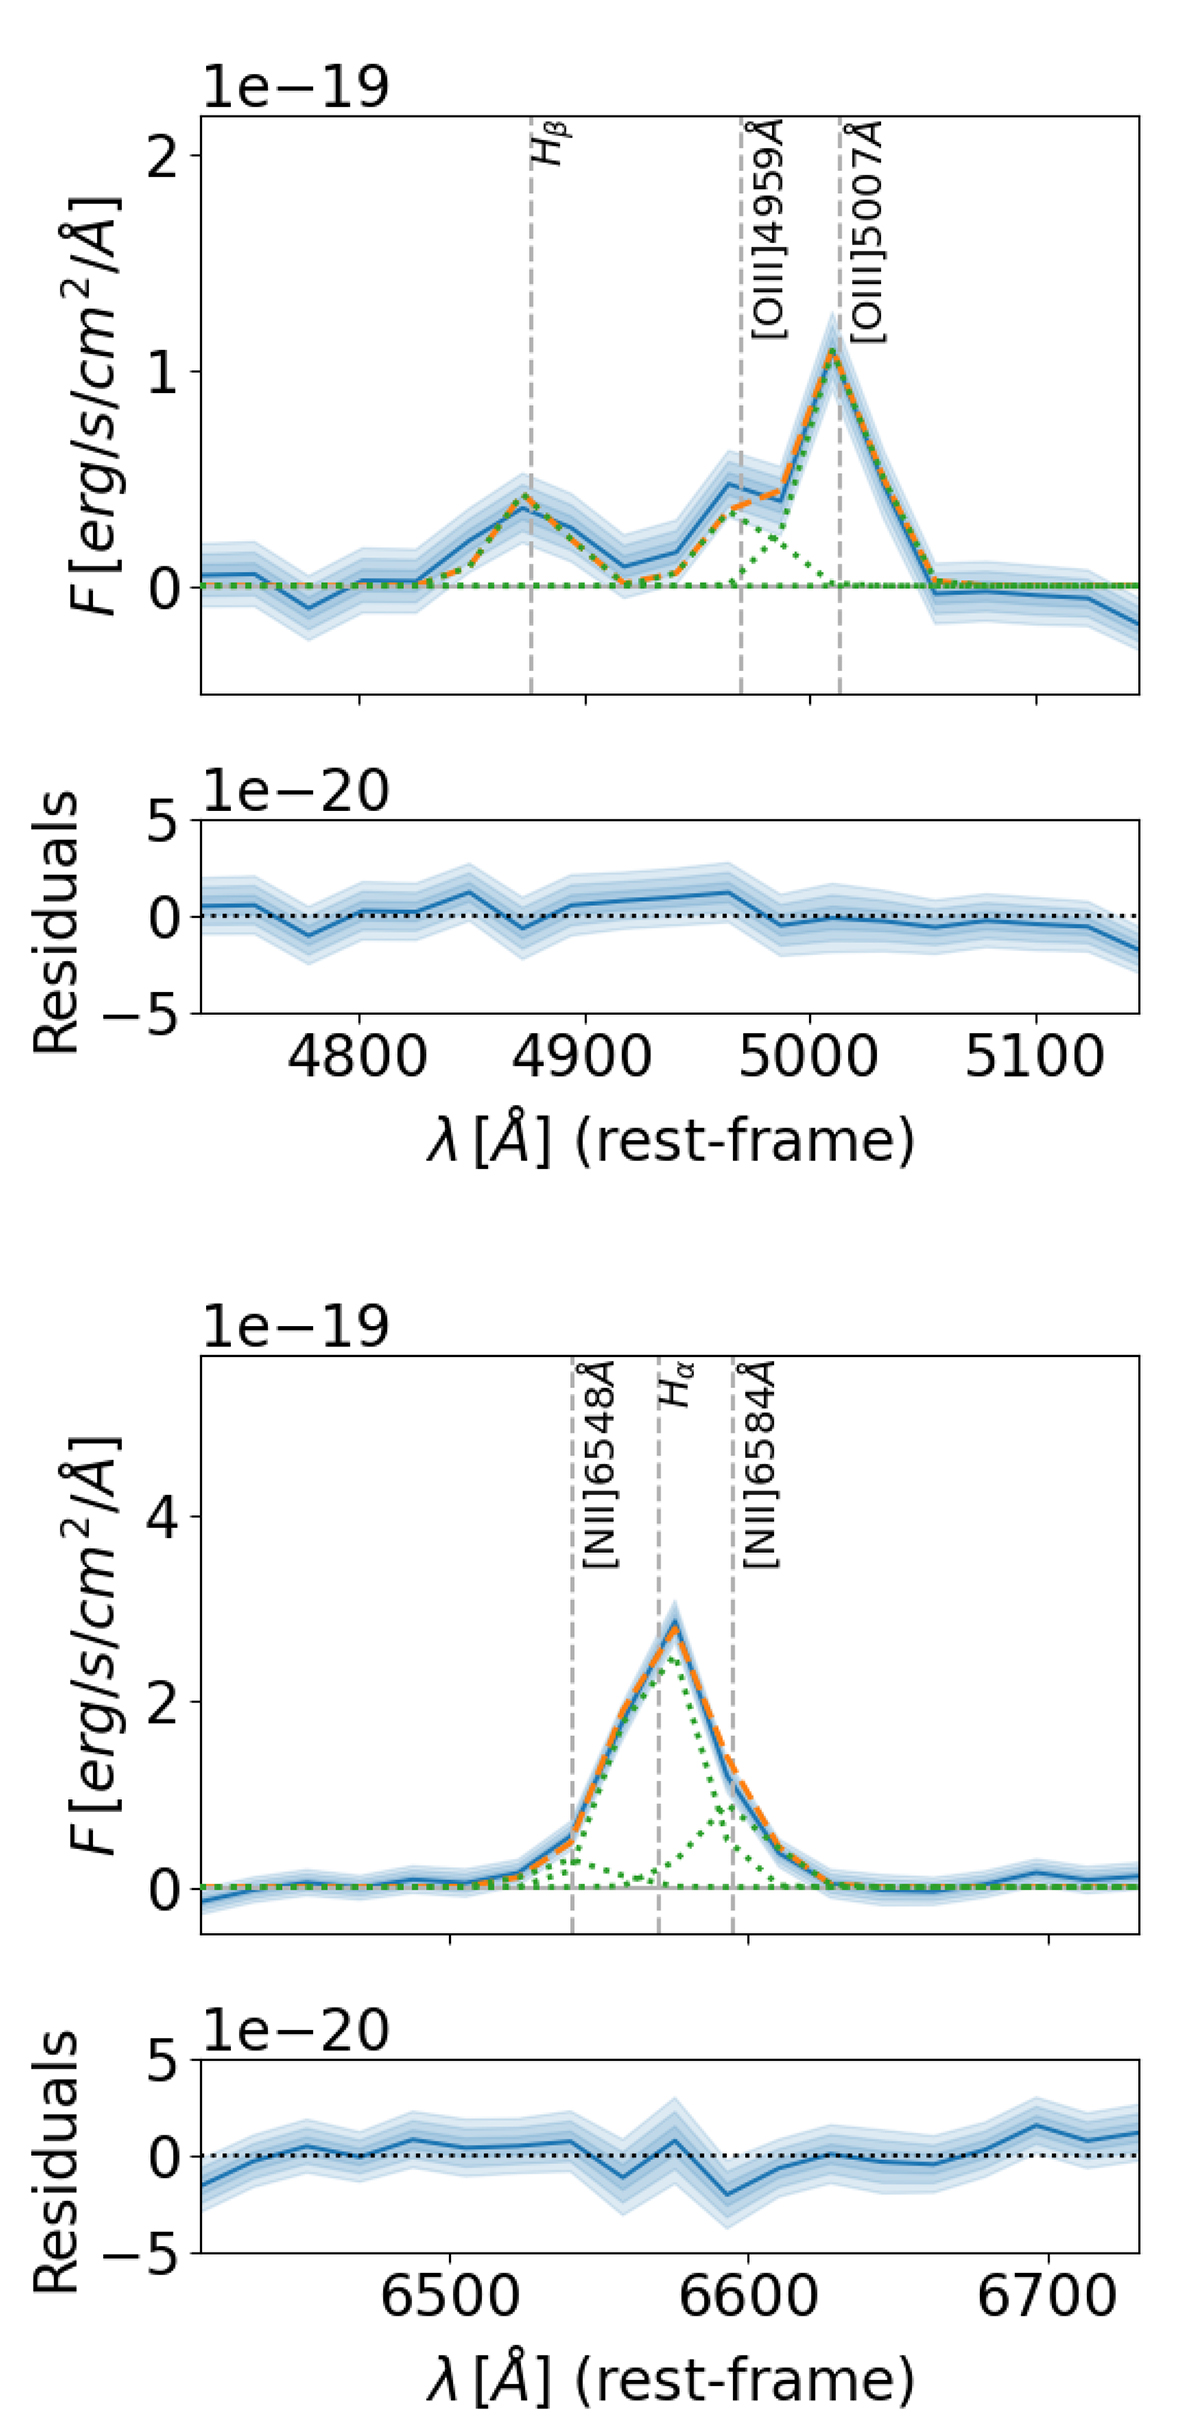
Fig. B.2.
Download original image
Multi-component fit of the Hβ, [O III] 4959Å and [O III] 5007Å lines (top) and the Hα, [N II] 6548Å and [N II] 6584Å lines (bottom). The solid blue lines show the observed continuum-subtracted spectrum, with the blue shaded areas indicating the 1σ, 2σ, and 3σ uncertainties. Dotted green lines show the different components of the fit, while the orange dashed lines show the total model. Grey vertical lines show the expected center of the nebular emission lines. The bottom panels show the residuals of the fit. The spectral resolution is around R = 100 near Hβ and R = 200 near Hα.
Current usage metrics show cumulative count of Article Views (full-text article views including HTML views, PDF and ePub downloads, according to the available data) and Abstracts Views on Vision4Press platform.
Data correspond to usage on the plateform after 2015. The current usage metrics is available 48-96 hours after online publication and is updated daily on week days.
Initial download of the metrics may take a while.