| Issue |
A&A
Volume 693, January 2025
|
|
|---|---|---|
| Article Number | A17 | |
| Number of page(s) | 21 | |
| Section | Extragalactic astronomy | |
| DOI | https://doi.org/10.1051/0004-6361/202451832 | |
| Published online | 23 December 2024 | |
Unveiling dust, molecular gas, and high star-formation efficiency in extremely UV bright star-forming galaxies at z ∼ 2.1–3.6
1
Département d’Astronomie, Université de Genève, Chemin Pegasi 51, 1290 Versoix, Switzerland
2
CNRS, IRAP, 14 Avenue E. Belin, 31400 Toulouse, France
3
Centro de Astrobiología (CAB), CSIC-INTA, Ctra. de Ajalvir km 4, Torrejón de Ardoz, 28850 Madrid, Spain
4
Instituto de Astrofísica de Canarias, C/Vía Láctea, s/n, 38205 San Cristóbal de La Laguna, Tenerife, Spain
5
Universidad de La Laguna, Dpto. Astrofísica, 38206 La Laguna, Tenerife, Spain
⋆ Corresponding author; This email address is being protected from spambots. You need JavaScript enabled to view it.
Received:
7
August
2024
Accepted:
21
October
2024
Abstract
We analysed the Atacama Large Millimetre/submillimetre Array (ALMA) far-infrared (FIR), 1.3 mm, dust continuum and CO emission of 12 starburst galaxies at z ∼ 2.1 − 3.6 selected for their extreme brightness in the rest-frame UV, with absolute magnitudes of −23.4 to −24.7. We also analysed their Very Large Telescope (VLT) High Acuity Wide field K-band Imager (HAWK-I) H- and Ks-band images. The targeted galaxies are characterised by negligible dust attenuations with blue UV spectral slopes (−2.62 to −1.84), very young stellar populations of ∼10 Myr, and powerful starbursts with a high mean specific star-formation rate of 112 Gyr−1, placing them ∼1.5 dex above the main sequence at similar redshifts and stellar masses (Mstars ∼ (1.5 − 4.6)×109 M⊙). The FIR dust continuum emission revealed in nine galaxies gives IR luminosities of (5.9 − 28.3)×1011 L⊙, with six galaxies remaining dominated by unobscured UV star-formation rates, and high dust masses barely produced by supernovae within the 10 Myr timescale. The CO emission detected in eight galaxies leads to molecular gas masses higher than stellar masses, with the mean molecular gas mass fraction as high as 82%. The corresponding star-formation efficiencies reach ≳40%, with amazingly short molecular gas depletion timescales between less than 13 Myr and 71 Myr. These unique properties never reported in previously studied galaxies highlight that these galaxies are likely caught at the very beginning of their stellar mass build-up and undergo a very efficient and fast conversion of gas into stars that can only result from the gas collapse within a very short free-fall time. We find that the feedback-free starburst model seems to be able to explain the formation of these galaxies. To reconcile the co-spatial FIR dust emission with the UV-bright unattenuated emission, we speculate about the presence of radiation-driven outflows that can temporarily remove dust at the location of the starburst and expel it at large distances in line with the measured high FIR effective radii (1.7 kpc to 5 kpc) in comparison to the very compact stellar radii of a few hundred parsecs.
Key words: dust / extinction / ISM: molecules / galaxies: high-redshift / galaxies: starburst / galaxies: star formation
© The Authors 2024
 Open Access article, published by EDP Sciences, under the terms of the Creative Commons Attribution License (https://creativecommons.org/licenses/by/4.0), which permits unrestricted use, distribution, and reproduction in any medium, provided the original work is properly cited.
This article is published in open access under the Subscribe to Open model. This email address is being protected from spambots. You need JavaScript enabled to view it. to support open access publication.
1. Introduction
The census of star-forming galaxies at high redshifts (z > 2) has been ongoing for decades, and different observational techniques have been developed to identify galaxies either as Lyman break galaxies (LBGs) or Lyman-α emitters (LAEs). Large volumes of space have been probed to investigate their space density as a function of their ultraviolet luminosity through luminosity functions (e.g. Reddy & Steidel 2009; Sobral et al. 2018a). The bright end of the luminosity function (LF) of the UV and Lyα emission corresponds to massive star formation and high production of ionising photons. However, the identification of the most UV- or Lyα-luminous star-forming galaxies remains challenging for three possible reasons: vigorous episodes of star formation are simply rare phenomena; galaxies with high star-formation rates (SFRs) consume their gas quickly, implying short timescales for their UV- or Lyα-luminous phases; or galaxies at the bright end of the LF produce significant quantities of dust during their intense star formation so that these most vigorous and intrinsically luminous star-forming galaxies quickly have their emission at UV wavelengths heavily obscured by dust (e.g. Casey et al. 2014).
Probing the bright end of UV and Lyα LFs thus requires wide-area surveys. Several dedicated surveys at z ∼ 2 − 3 covering a few square degrees (1 − 4 deg2) have searched for extremely UV-luminous galaxies but failed to discover galaxies more luminous than two times the typical luminosity (L⋆) of UV and Lyα of LBGs and LAEs, which corresponds to the unobscured absolute magnitude  and
and  , respectively (e.g. Ouchi et al. 2008; Zheng et al. 2016; Sobral et al. 2018b). The Baryon Oscillation Spectroscopic Survey Emission-Line Lens Survey for the GALaxy-Lyα EmitteR sYstems (BELLS GALLERY; Shu et al. 2016) led to the discovery of five LAEs at 2 < z < 3 with intrinsic MUV above
  , with two of them being brighter than MUV < −23 and having
  , and this was without the need to invoke an active galactic nucleus (AGN) component (Marques-Chaves et al. 2017, 2020a). Additionally, five strongly lensed UV-luminous non-active LBGs with −23.5 < MUV < −21.1 were also reported in the literature but with, on average, strongly suppressed Lyα lines, higher metallicities, stronger interstellar medium (ISM) absorption lines, and redder slopes, suggesting higher dust attenuation than the extremely UV-bright LAEs (Pettini et al. 2000; Quider et al. 2009, 2010; Dessauges-Zavadsky et al. 2010, 2011; Patrício et al. 2016; Marques-Chaves et al. 2018).
Remarkably, UV-luminous galaxies above  are also detected at z > 6 (Sobral et al. 2015; Matsuoka et al. 2018; Hashimoto et al. 2019; Endsley et al. 2021; Bouwens et al. 2022a), and recent works now include the highest redshift sources known at the epoch of reionisation (EoR) discovered with the James Webb Space Telescope (JWST), leading to important and unexpected implications (e.g. Bouwens et al. 2023; Atek et al. 2023; Bunker et al. 2023; Casey et al. 2023; Castellano et al. 2024; Carniani et al. 2024). The volume density inferred for these UV-luminous sources with MUV reaching −22.5 is much higher by factors of ∼10 − 100 than that predicted by models (e.g. Mason et al. 2018), implying steeper UV LFs than predicted such that the bright end of the LFs does not significantly evolve between 8 < z < 16 (e.g. Naidu et al. 2022; Finkelstein et al. 2024; Chemerynska et al. 2024). The excess of these UV-bright sources at the EoR, which still needs to be confirmed with spectroscopic redshift assessments, currently puts strain on the standard ΛCDM cosmology unless new concepts in our understanding of star-formation processes and baryon physics are invoked (Boylan-Kolchin 2023). Different scenarios have thus been proposed to explain the extremely UV-luminous and massive galaxies detected at the EoR and their excess, including a feedback-free starburst yielding a very high star-formation efficiency, namely a very efficient conversion of accreted gas into stars within a very short free-fall timescale (Dekel et al. 2023; Li et al. 2024); a temporary removal of dust as a consequence of radiation-driven outflows that yields very low dust attenuation and makes the galaxies appear brighter (Ferrara et al. 2023; Ziparo et al. 2023; Ferrara 2024); a top-heavy IMF boosting the UV radiation and the luminosity to mass ratio (e.g. Bekki & Tsujimoto 2023; Trinca et al. 2024); and a stochastic variability of the SFR (e.g. Mirocha & Furlanetto 2023; Gelli et al. 2024). Which of these scenarios holds now needs to be determined. Finally, although AGN contamination could possibly also explain the excess of these UV-bright sources at the EoR, this scenario was discarded by Finkelstein & Bagley (2022) and only the exceptionally UV-luminous galaxy GN-z11 at z = 10.6 potentially hosts an AGN (Maiolino et al. 2024).
The recent search for extremely UV-luminous galaxies with MUV < −23 undertaken at z ≳ 2 within the ∼ 9000 deg2-wide extended Baryon Oscillation Spectroscopic Survey (eBOSS; Abolfathi et al. 2018) of the Sloan Digital Sky Survey (SDSS; Eisenstein et al. 2011) delivered about 70 galaxies at the very bright end of the UV LF, and they are among the most UV-bright galaxies known at cosmic noon (Marques-Chaves et al., in prep.). The first detailed studies of 13 of these galaxies are presented in Marques-Chaves et al. (2020b), Álvarez-Márquez et al. (2021), Marques-Chaves et al. (2021), Marques-Chaves et al. (2022), and Upadhyaya et al. (2024). We selected 12 of the most UV-luminous galaxies with MUV ranging from −23.4 to −24.5 at z = 2.08 − 3.61, accessible for observations with ALMA. They are characterised by unattenuated starlight with steep UV spectral slopes ranging from −2.62 to −1.84 and are dominated by young stellar populations with average ages of ∼10 Myr, as testified by their rest-frame UV spectra revealing pure stellar features. Powered by powerful starbursts with very high specific SFRs (∼ 100 Gyr−1), the corresponding stellar masses are in the range of (1.47 − 4.59)×109 M⊙, and they have sub-solar metallicities. Evidence of outflows, and even inflows, is found for some of these galaxies, as well as signatures of very massive stars (VMSs) with masses of 100 M⊙ − 400 M⊙. Two galaxies are identified as very strong Lyman continuum (LyC) leakers. Considering these physical properties altogether, the galaxies are interpreted as being in an intense starburst phase with the bulk of their stellar mass being formed in a few million years.
Globally, most of the physical properties of these galaxies resemble the recently discovered galaxies at the EoR. Therefore, the scenarios proposed to explain the UV brightness and excess of galaxies out at z > 8 could also explain the tremendous UV luminosities of these vigorous starburst galaxies at cosmic noon. The ALMA observations we acquired in the far-infrared (FIR) dust continuum at 1.3 mm (band 6) and in the CO(3–2) or CO(4–3) line emission (band 3) are key to inferring their dust and cold molecular gas masses – two physical parameters that are essential to fully probe the star-formation process ongoing in the galaxies and bring answers to the questions as to how much dust was produced within the ∼10 Myr burst timescale, where dust is located so that it is reconciled with the steep UV spectral slopes, how much obscured star formation contributes to the whole SFR budget in these highly star-forming galaxies, how much molecular gas mass is available to feed their star formation, what are the subsequent molecular gas mass depletion timescale and star-formation efficiency, with the latter expected to be higher with respect to that of nearby galaxies given the high stellar mass build-up achieved within 10 Myr only. Efficiencies higher than 20% are indeed advocated by different studies to explain diverse observational findings at very high redshifts (e.g. Xiao et al. 2024; de Graaff et al. 2024; Weibel et al. 2024) and make them compatible with simulations (e.g. Kannan et al. 2023; Boylan-Kolchin 2023). These answers are helpful to determine whether the molecular gas mass reservoir is consumed rapidly so that galaxies quench by starvation or, on the contrary, the molecular gas mass reservoir is massive enough to produce high amounts of dust so that galaxies turn into luminous dusty star-forming galaxies.
In Sect. 2 we describe the selection and the physical properties of the 12 UV-bright star-forming galaxies at z = 2.08 − 3.61 studied in this work. In Sect. 3 we present their ALMA and Very Large Telescope (VLT) HAWK-I observations and the corresponding data reduction and imaging. We then analyse the CO line, the FIR dust continuum, and the rest-frame UV or optical emission, and we measure CO luminosities, molecular gas masses, IR luminosities, dust masses, and FIR dust continuum as well as the rest-frame UV/optical sizes. Section 4 discusses the derived measurements in the general context of main sequence (MS) star-forming galaxies and starburst galaxies at similar and higher redshifts. We focus on the dust-obscured star formation in Sect. 4.1, the molecular gas mass content and depletion timescale in Sect. 4.2, the star-formation efficiency in Sect. 4.3, the dust mass content in Sect. 4.4, the FIR dust continuum and rest-frame UV/optical sizes in Sect. 4.5, and the rest-frame UV/optical morphology and spatial offsets in Sect. 4.6. In Sect. 5 we try to obtain a complete understanding of these extremely UV-luminous galaxies, considering all of their physical properties. Finally, in Sect. 6 we summarize our results.
Throughout the paper, we assume the ΛCDM cosmology with Ωm = 0.3, ΩΛ = 0.7, and H0 = 70 km s−1 Mpc−1. We adopt the Chabrier (2003) initial mass function (IMF).
2. Target sample and their properties
This work presents ALMA and VLT HAWK-I observations of 12 extremely UV-bright star-forming galaxies at z = 2.08 − 3.61. These sources are part of a large sample of about 70 UV-luminous galaxies (Marques-Chaves et al. in prep.) selected from the ∼ 9000 deg2-wide eBOSS/SDSS survey (Abolfathi et al. 2018) to have high UV absolute magnitudes and narrow Lyα emission profiles in their BOSS spectra (covering the spectral range λ ≃ 3600 − 10 000 Å with a resolving power R ≃ 2000). The targets studied here were selected for ALMA and HAWK-I observations with declinations ≤30° and other properties that are representative of the parent sample. They show extremely bright MUV ranging from −23.4 to −24.6, Lyα luminosities of log(LLyα/erg s−1) = 42.9 − 44.1, and Lyα rest-frame equivalent widths of EWLLyα = 12 − 55 Å. The rest-frame UV and optical properties of a fraction (7/12) of these targets were analysed in detail in previous works through deep spectroscopy with the 10.4 m Gran Telescopio Canarias (Marques-Chaves et al. 2020b, 2021, 2022, 2024; Álvarez-Márquez et al. 2021; Upadhyaya et al. 2024), and for the remaining targets through shallow SDSS spectroscopy. We measured steep UV spectral slopes (βUV) from −2.62 to −1.84, suggesting residual/low dust attenuations E(B − V)≤0.1 when assuming the Calzetti et al. (2000) extinction law with an intrinsic β0 = −2.44.
In the references listed above it is also shown that the rest-frame UV spectra of the galaxies studied here reveal pure stellar features, such as wind lines and photospheric absorption, known to be produced only by the atmospheres of the most massive stars; as such, they are characterised by very young stellar populations with an average age of ∼10 Myr for the whole sample (but some galaxies are even younger and some slightly older). They have metallicities in the range of 12 + log(O/H) = 8.13 − 8.49, with a mean of 8.36, that is, Z/Z⊙ ≃ 0.5. Using their UV luminosities (LUV), we measured high unobscured star-formation rates SFRUV = 104 − 415 M⊙ yr−1 by applying the specific LUV–SFRUV conversion factor κUV = 1.3 × 10⁻⁸ M⊙ yr−1/(erg s−1 Hz−1), derived using the Binary Population and Spectral Synthesis (BPASS) binary models (Eldridge et al. 2017; Stanway & Eldridge 2018; Byrne et al. 2022), and assuming a continuous star formation over 10 Myr, a metallicity of 0.5 Z⊙, and the Chabrier (2003) IMF. However, one needs to keep in mind that κUV is strongly dependent on the burst age for 10 Myr and below, such that SFRUV gets more than twice higher for a two times shorter continuous star formation, as explained in Marques-Chaves et al. (2024). The stellar masses of the young stellar population were then derived following Mstars = SFRUV × 10 Myr, where SFRUV were corrected for the dust attenuation using the observed βUV; we obtained Mstars = (1.47 − 4.59)×109 M⊙. Analysing the spectral energy distributions (SEDs) of the galaxies, Marques-Chaves et al. (2020b, 2021, 2022) find that the SEDs are dominated by a young and intense burst of star formation, and could only infer loose upper limits on the mass of the old stellar population  (3σ). The new Hubble Space Telescope (HST) photometry recently acquired for J1316+2614 provides a more stringent upper limit on
  (3σ), yielding a fraction of the starburst mass to the total (young+old) stellar mass > 62% (see Fig. 9 Marques-Chaves et al. 2024). The absence of relevant old stellar population in these galaxies is interpreted as indicating that the galaxies are in an intense starburst phase with the bulk of their stellar mass being formed in a few million years. Table 1 summarizes all the rest-frame UV physical properties derived for our galaxies.
Rest-frame UV properties of the galaxy sample.
The galaxies studied here also appear as very strong producers of ionising radiation given their extreme MUV, and two are confirmed to be strong LyC leakers (Marques-Chaves et al. 2021, 2022), with J1316+2614 at z = 3.6122 reaching a LyC escape fraction as high as fesc(LyC)≃90%. Moreover, they have complex gas kinematics, showing signatures of outflows from the weak ISM absorption lines having blueshifted centroids with respect to the systemic redshift (Álvarez-Márquez et al. 2021; Marques-Chaves et al. 2021), and even signatures of inflow for J1316+2614 from the blue-dominated Lyα emission with respect to the systemic redshift (Marques-Chaves et al. 2022).
3. Observations and data analysis
3.1. ALMA data reduction and imaging
The 12 targets are part of two ALMA observing programmes. The first programme 2018.1.00932.S (PI: R. Marques-Chaves) includes J0146–0220, J0850+1549, J1220+0842, and J1157+0113, and was observed in Cycle 6 in bands 3 and 6 in the configurations C43-4 and C43-3, respectively, with short on-source integration times per target between 5 and 35 minutes. The second programme 2021.1.01438.S (PI: R. Marques-Chaves) includes J1322+0423, J1415+2036, J1249+1550, J0006+2452, J1220–0051, J0950+0523, J0121+0025, and J1316+2614, and was observed in Cylcle 8 also in bands 3 and 6 in the configurations C43-5 and C43-1 (C43-2 for J0950+0523), respectively, with on-source integration times of about 40 minutes per target. The band 3 observations were tuned to the CO(3–2) emission line, except for the 2 highest redshift targets at z > 3, J1316+2614 and J0121+0025, that were tuned to the CO(4–3) emission line. The band 6 observations were aimed for the 240 GHz (1.3 mm) FIR dust continuum solely and therefore were not tuned to a specific frequency. The spectral resolution was set to 31.25 MHz (i.e. ∼ 45 km s−1) for both band 3 and 6 observations.
The ALMA data were calibrated with the standard observatory pipeline, and imaged using the Common Astronomy Software Application (CASA, version 6.2.1.7; McMullin et al. 2007). We imaged the band 6 calibrated visibilities of continuum over the four spectral windows with the multi-frequency synthesis, applying a pixel size of 0.1″ (for the 2018.1.00932.S targets) or 0.15″ (for the 2021.1.01438.S targets), and the natural weighting. The clean was repeated down to the threshold of 4× the RMS noise level of the dirty images using the tclean routine in CASA. We then applied the primary beam correction on the cleaned continuum emission maps. The corresponding FIR continuum maps are shown in Figs. 1, A.1, and A.2 (left panels).
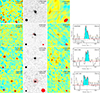 |
Fig. 1. Images showing the FIR dust continuum emission, the H- or Ks-band continuum emission, the CO(3–2) or CO(4–3) emission, and the related spectra (if CO is detected) of our 12 extreme starburst galaxies ordered by increasing redshift from top to bottom. Left panels: 23″ × 23″ ALMA band 6 1.3 mm (240 GHz) FIR dust continuum images of our targeted galaxies. Contour levels start at ±4σ and are in steps of 1σ up to 10σ and in larger steps above. The respective synthesised beam size and orientation are indicated by the red filled ellipse in the bottom-left corner. The cross in each panel corresponds to the coordinates of the HAWK-I continuum emission peak (except for J0850+1549 and J0121+0025 for which we consider, respectively, the CFHT MegaCam and Subaru continuum emission peak) and is ±3″ in size. Middle-left panels: 10″ × 10″ VLT HAWK-I seeing-limited H-band or AO Ks-band images of our starburst galaxies in greyscale with the ALMA band 6 FIR dust continuum contours overlaid in red. For J0850+1549 and J0121+0025, we show, respectively, the CFHT MegaCam and Subaru seeing-limited R-band images. Contour levels start at ±4σ and are in steps of 2σ, except for J0146–0220, J1249+1550, and J0850+1549 where contour levels are the same as in the left panels. The PSF is shown by the black filled circle in bottom-left corner, and the ALMA synthesised beam by the red filled ellipse in the bottom-right corner. The cross is the same as in the left panels. Middle-right panels: 10″ × 10″ ALMA CO(3–2) or CO(4–3) velocity-integrated intensity moment-0 maps of our galaxies. The maps were integrated over the cyan-shaded spectral channels shown in the right panels. Contour levels start at ±4σ and are in steps of 1σ. The respective synthesised beam size and orientation are indicated by the red filled ellipse in the bottom-right corner. The cross is the same as in the other panels. Right panels: ALMA CO(3–2) or CO(4–3) emission line spectra of our galaxies, plotted when detected, in steps of ∼ 45 km s−1 and with the zero velocity centred on the redshifts derived from optical nebular emission lines (Table 1). The cyan-shaded regions correspond to the velocity channels optimising the CO detections, as described in Sect. 3.1. The dashed orange lines correspond to the RMS noise level of spectra. The solid red lines are the multi-component Gaussian best-fits to the observed CO line profiles. The vertical bars mark the positions of the fitted Gaussian components. The rest of the figure is available in Appendix A. |
For the CO(3–2) and CO(4–3) emission imaging we used the pixel size of 0.1″ (for the 2018.1.00932.S targets) or 0.05″ (for the 2021.1.01438.S targets). The Briggs weighting with the robust factor of 1.0 was applied for the few galaxies with a high S/N CO detection, otherwise we applied the natural weighting. Similarly to the continuum maps, we cleaned all channels with the tclean routine down to the threshold of 4× the RMS noise level of the dirty cubes, and a primary beam correction was applied. Finally, we also imaged the band 3 calibrated visibilities of continuum over the four spectral windows, excluding channels contaminated by the CO emission. No band 3 (100 GHz) continuum was detected in any target. The resulting band 3 (CO emission) and band 6 (continuum emission) synthesised beam sizes and RMS noise levels for the 12 targets are listed in Tables 2 and 3, respectively.
CO emission line observations (ALMA band 3).
The CO moment-0 maps, that is, the velocity-integrated CO line intensity maps, were obtained by averaging the cleaned cube over the spectral channels where the CO emission is detected, using the immoments routine in CASA. We adopted the optimum channel range as the one that is maximising the S/N of the 1D spectrum of the CO emission line by iteratively testing different channel ranges (following the method of, e.g. Daddi et al. 2015; Zanella et al. 2018). For each channel range tested, the CO emission was extracted within a custom (polygonal) aperture including all the flux above the RMS noise level and typically bigger than the synthesised beam size. No band 3 continuum was subtracted beforehand, since undetected. The corresponding CO moment-0 maps and the CO line spectra are shown in Figs. 1, A.1, and A.2 (middle-right and right panels).
3.2. From the CO emission line to molecular gas masses
The CO emission is successfully detected close to the phase centre and at the expected frequency for eight targets. J0146–0220, J1249+1550, J0006+2452, J1220–0051, J0950+0523, and J1157+0113 show robust CO detections above 5σ, while J1415+2036 and J0121+0025 show patchy CO emission peaks at 4 − 5σ significance level spread over < 3″ (i.e. < 25 kpc) around the phase centre (Figs. 1, A.1, and A.2, middle-right panels). Four of the robust CO detections in J0006+2452, J1220–0051, J0950+0523, and J1157+0113 are spatially resolved, while J0146–0220 and J1249+1550 are unresolved/marginally resolved with their CO emission being comparable to the ALMA synthesised beam size. All the CO line profiles are complex, most are characterised by double-peaks and J1157+0113 even shows a triple-peak (Figs. 1, A.1, and A.2, right panels). They are difficult to interpret (between rotation/mergers) with the current data which do not allow us to perform a detailed kinematic analysis via velocity (moment-1) and dispersion (moment-2) maps given that all our galaxies are not sufficiently resolved.
We measured the CO velocity-integrated intensities (ICO) from the CO moment-0 maps integrating all the signal located around the phase centre, above the surrounding RMS noise level. No aperture correction was needed as the customised apertures used were all bigger than the synthesised beam. The derived ICO agree very well with those determined from the Gaussian fitting of the CO line profiles. To fit the complex CO line profiles, we performed multi-component Gaussian fitting using the nonlinear χ2 minimisation and the Levenberg-Marquardt algorithm. Errors on the values of CO redshifts (zCO), full-width half maximum (FWHMCO), and ICO were estimated using the Monte Carlo approach by perturbing the observed spectrum with 1000 random realisations. For the CO non-detections, upper limits on ICO were derived from the 4σ RMS noise level of moment-0 maps integrated over ∼ 350 km s−1, the typical FWHM measured for the detected CO emission lines of our targets. We then used Eq. (3) from Solomon et al. (1997) to derive the CO luminosities ( ) from the respective ICO. The resulting measurements can be found in Table 2.
The molecular gas mass (Mmolgas) is then expressed as
 (1)
(1)
where  in K km s−1 is the luminosity of a given CO transition, rJ, 1 is the CO luminosity correction for this transition to the fundamental CO(1–0) transition, and αCO in M⊙ (K km s−1 pc2)−1 is the conversion factor between the CO(1–0) luminosity and the H2 gas mass.
To convert the CO(3–2) and CO(4–3) luminosities to the fundamental CO(1–0) luminosity, which ultimately gives the total H2 molecular gas mass, we applied the CO luminosity correction factors r3, 1 = 0.77 ± 0.14 and r4, 1 = 0.61 ± 0.13, respectively, derived by Boogaard et al. (2020) from the stacking of CO-flux-limited star-forming galaxies at z ∼ 2.5 from the ALMA SPECtroscopic Survey (ASPECS). Overall, the adopted CO excitation (i.e. CO spectral line energy distribution) is comparable to the one of a lensed star-forming galaxy at z ∼ 3.6 with a similar IR luminosity to our targets (Dessauges-Zavadsky et al. 2017) and z ∼ 2.5 starburst galaxies (Xiao et al. 2022). It is also comparable to the recently derived CO excitation of IR-luminous sub-mm galaxies (SMGs) at z = 2 − 5 ( and
and  ; Frias Castillo et al. 2023), in contrast with the initially higher CO excitation derived for SMGs at z = 1 − 4 (Bothwell et al. 2013).
As for the CO-to-H2 conversion factor, hereafter we favour the value derived for nearby starburst galaxies,  , given the starburst nature of our targets (Sect. 2). The corresponding Mmolgas measurements are summarised in Table 4. In Sects. 4.2 and 4.3 we discuss the impact of αCO values between
  and the Milky Way value
  (including the factor of 1.36 to account for heavy elements, primarily Helium; Bolatto et al. 2013).
3.3. From the FIR dust continuum to IR luminosities and dust masses
The 1.3 mm (240 GHz) band 6 FIR dust continuum emission is robustly detected at the phase centre for nine targets: J0146–0220, J1249+1550, J0006+2452, J0850+1549, J1220–0051, J0950+0523, J1157+0113, J0121+0025, and J1316+2614 (Figs. 1, A.1, and A.2, left panels). All the continuum detections are spatially resolved, except in J0146–0220 whose continuum emission is comparable to the ALMA synthesised beam size.
We measured the FIR fluxes (S1.3mm) from the 1.3 mm (240 GHz) continuum emission maps using customised apertures big enough to include for each emission all the signal located around the phase centre, above the surrounding RMS noise level (no aperture correction was needed as the apertures used were all bigger than the synthesised beam). The derived S1.3mm agree very well with those determined from the fitting of the continuum emission in the uv plane by adopting the Fourier transform of the elliptical Gaussian 2D model. The fits were done using the UV_FIT routine from the GILDAS software package (Guilloteau & Lucas 2000), leaving the centre coordinates, flux, FWHMmajor, FWHMminor, and position angle of the Gaussian 2D model as free parameters. The fit in the uv plane did not converge for one target J1157+0113, certainly because of the complex shape of its emission in the continuum map that could not be approximated by the elliptical Gaussian 2D model. For the continuum non-detections, we considered 4σ upper limits estimated from the RMS noise level of the continuum dirty images. The resulting S1.3mm measurements are listed in Table 3.
Far-infrared dust continuum observations (ALMA band 6) and rest-frame UV/optical ground-based observations.
We used the results of the uv fits to derive the deconvolved FIR dust continuum sizes of the spatially resolved targets (except for J1157+0113). We computed the effective radius (Reff, FIR), defined as the radius enclosing half of the total emission, following  , where the square root of the product of the deconvolved full-width half maximum along the major and minor axes of the Gaussian 2D most precise fits of the FIR continuum emission corresponds to the circularised FWHM radius. The resulting Reff, FIR are listed in Table 3.
Since our galaxies have a low dust attenuation E(B − V)≤0.1 (Sect. 2), we assumed that the emission models for these galaxies should be optically thin. Therefore, to determine the IR luminosity (LIR) we scaled the optically thin modified black-body (MBB) function (Casey 2012) to the measured 1.3 mm (240 GHz) continuum flux of each target, and integrated over the wavelength range between 8 μm and 1000 μm. We derived the dust mass (Mdust) from S1.3mm in Jy by following Casey (2012)
 (2)
(2)
where DL in m is the luminosity distance, and Bν(Tdust) in Jy sr−1 is the Planck function at the dust temperature (Tdust) and the observer-frame frequency (ν = 240 GHz). We assumed Tdust = 40 K for the dust associated with the starburst regions of our targets at z ∼ 2.1 − 3.6 (e.g. Schreiber et al. 2018; Sommovigo et al. 2022; Viero et al. 2022; Witstok et al. 2023). For the dust mass absorption coefficient  , where β is the dust emissivity index and κ0 the dust opacity at ν0 (λ0), we assumed β = 1.4, κ0 = 40 cm2 g−1, and λ0 = 100 μm (Bianchi & Schneider 2007). We then derived the uncertainties on LIR and Mdust as the median absolute deviations (mad) obtained when averaging over Tdust = 30 K, 35 K, 40 K, and 45 K and seven different κ models of dust composition listed in Ginolfi et al. (2019, Table 2), each of them providing a combination of parameters β, κ0, and λ0 selected from the literature (Weingartner & Draine 2001; Bertoldi et al. 2003; Robson et al. 2004; Beelen et al. 2006; Bianchi & Schneider 2007; Galliano et al. 2011; Jones et al. 2017). The resulting uncertainties are big but allow us to place our LIR and Mdust estimates on the conservative side given the poorly constrained FIR SED with one single band continuum measurement. They are also big enough to encompass the ≳5 − 10% correction factor potentially needed to derive the intrinsic dust emission detected against the cosmic microwave background at the redshift of our galaxies (which we have not applied) computed by da Cunha et al. (2013). In Table 3 we summarize the derived LIR, and Mdust can be found in Table 4.
Dust and molecular gas properties of the galaxy sample.
3.4. VLT HAWK-I data reduction and analysis
The near-IR imaging was obtained in H- and Ks-bands for 10 targets with HAWK-I on the VLT UT4. These observations were conducted between March 2023 and February 2024 in service mode as part of the programme 111.251K.001 (PI: R. Marques-Chaves). The H-band observations were taken under very good seeing conditions of 0.4″ − 0.6″ (FWHM). The Ks-band observations were obtained with the GRound layer Adaptive optics system Assisted by Lasers (GRAAL), enhancing the final image quality down to 0.3″ − 0.4″ (FWHM). For each target, the total on-source exposure times were 560 seconds and 1350 seconds in the H- and Ks-bands, respectively. Data were reduced using the standard ESO pipeline version 2.4.121 and were flux calibrated against 2MASS stars in the field. The astrometry was calibrated using the GAIA DR3 catalogue (Gaia Collaboration 2023) yielding an RMS precision of 0.10″ − 0.13″, which is roughly similar to the HAWK-I native pixel-scale (0.107″ per pixel).
Given the very good HAWK-I image quality, we investigated the morphology and sizes of the galaxies2. We used GALFIT (Peng et al. 2002) to fit the light distribution of each galaxy with the 2D Gaussian function convolved to the instrumental point spread function (PSF) that was measured from bright stars in the HAWK-I field-of-view. The fitting process was performed on 10″ × 10″ background-subtracted cutouts centred on each target, shown in Figs. 1, A.1, and A.2 (middle-left panels). Overall, a single 2D Gaussian profile fitted well the observed light profiles for most of our galaxies, except for J0146–0220 and J0006+2452 that required an additional component. We find that eight galaxies are resolved in the HAWK-I images, for which we derived the rest-frame UV or optical effective radius (Reff, UV/opt) measurements. The two remaining galaxies, J0950+0523 and J1316+2614, are unresolved with effective radii as small as Reff, UV < 0.55 kpc for J1316+2614. J0146–0220 and J0006+2452 show a bright and unresolved component beside the extended and resolved component.
For the two targets with no HAWK-I observations, J0850+1549 and J0121+0025, we used, respectively, the public CFHT MegaCam and Subaru seeing-limited R-band images to infer their sizes, following the same methodology as described for HAWK-I images. The rest-frame UV or optical effective radii of our 12 UV-bright galaxies are summarised in Table 3.
4. Results
4.1. Dust-obscured star formation
As summarised in Sect. 2, our galaxies are intense starburst galaxies with very high unobscured star-formation rates for their Mstars and redshifts, ranging between SFRUV = 104 M⊙ yr−1 and 415 M⊙ yr−1 (uncorrected for dust attenuation; Table 1). The measured LIR (Table 3), moreover, show that most of these UV-bright galaxies reside in the regime of luminous IR galaxies (LIRGs; 1011 < LIR/L⊙ < 1012) and 3 galaxies reside at the faint end of ultra-luminous IR galaxies (ULIRGs; 1012 < LIR/L⊙ < 1013). They provide a measure of the obscured star-formation rates, defined as SFRIR = LIR/1010, following the calibration of Kennicutt (1998) for the Chabrier (2003) IMF. They reach SFRIR = 59 M⊙ yr−1 to 238 M⊙ yr−1, with three upper limits below 57 M⊙ yr−1 (Table 4). The resulting total SFR (SFRUV+IR = SFRUV + SFRIR) place our galaxies well above the MS of star-forming galaxies at similar z ∼ 2.5 and with similar stellar masses, with very high MS offsets of ΔMS = SFRUV+IR/⟨SFRMS⟩ ∼ 30 (e.g. Speagle et al. 2014; Leslie et al. 2020). Obviously, the offsets could be lower in presence of old, yet currently poorly evidenced, stellar populations (Sect. 2).
In Fig. 2 we show the comparison of the unobscured SFRUV and obscured SFRIR of our galaxies. The bulk of these extreme starbursts are dominated by the unobscured SFRUV and have obscured fractions of star formation (fobscured = SFRIR/SFRUV+IR) ranging between ≲14% and 42%. Only three galaxies, J0006+2452, J0950+0523, and J1157+0113, have fobscured moderately above 50%, with at most 57%. Based on different galaxy samples and exploring the possible effects of the assumed FIR SED template in the determination of SFRIR values, Whitekar et al. (2017) showed that fobscured is highly mass dependent but redshift independent for galaxies at 0 < z < 2.5. Half of our extreme starburst galaxies follows their fobscured–Mstars relation, while the other half of galaxies with fobscured < 25% is located a factor of two below the empirical relation. The latter galaxies have among the lowest fobscured measurements known at their Mstars, and this even in comparison to stacks of UV-selected galaxies at z ∼ 5 (Fudamoto et al. 2020b) and z ∼ 7 (Algera et al. 2023). The deviation from the mean fobscured–Mstars relation would be all the more significant if the stellar masses of our galaxies are underestimated (see Sect. 2). Among these low fobscured galaxies, we find the two strong LyC leaking galaxies, J0121+0025 and J1316+2614, at z > 3 (Marques-Chaves et al. 2021, 2022), both with FIR dust continuum detections.
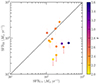 |
Fig. 2. Comparison of the unobscured SFRUV (uncorrected for dust attenuation) and obscured SFRIR of our galaxies, colour-coded by redshift. The majority of our galaxies is dominated by the unobscured SFRUV, such that the corresponding obscured fractions of star formation range between fobscured < 14% and 42%, and is above 50% for three galaxies only. The dashed line traces the one-to-one relationship. |
In Fig. 3 we show the IR excess (IRX = LIR/LUV) as a function of the UV spectral slope of our galaxies. This is another empirical relation commonly studied for star-forming galaxies used to evaluate their dust attenuation, which does not evidence significant redshift evolution at least for galaxies at z ≲ 4 (e.g. Meurer et al. 1999; Whitekar et al. 2014; Bouwens et al. 2016; Fudamoto et al. 2017; Álvarez-Márquez et al. 2016, 2019). In comparison to the existing galaxy samples around the cosmic noon era, our galaxies are characterised by very blue βUV < −1.8 and low IRX < + 0.5 because of their particularly high LUV dominating over the LIRG/ULIRG regime. These two characteristics are more typical of very high redshift UV-selected galaxies at z ∼ 4.5 − 7.7 (e.g. Fudamoto et al. 2020b; Inami et al. 2022; Bowler et al. 2024); in particular, mean βUV between −2.2 and −2.6 were derived from about a thousand of 5 < z < 13 galaxies (Roberts-Borsani et al. 2024; Heintz et al. 2024). As a result, similarly to the z ∼ 4.5 − 7.7 galaxies, most of our galaxies deviate from the canonical IRX–βUV relation derived by Meurer et al. (1999) for nearby starburst galaxies with an intrinsic UV continuum slope β0 = −2.23 (solid line in Fig. 3). Reddy et al. (2018) computed IRX–βUV relations assuming a constant star formation with an age of 100 Myr and including nebular continuum emission for a low stellar metallicity of Z = 0.14 Z⊙, assumed to better characterise high redshift galaxies expected to have different physical conditions from nearby starburst galaxies with younger stellar populations and lower metallicities, yielding bluer β0 = −2.62 relative to the canonical relation of Meurer et al. (1999). The resulting IRX–βUV predictions with β0 = −2.62 were found to agree with stacks of UV-selected galaxies at z > 4.5 (e.g. Fudamoto et al. 2020b). In Fig. 3 we show the corresponding IRX–βUV predictions obtained for the Small Magellanic Cloud (SMC; Gordon et al. 2003) extinction curve (dashed line) and the Calzetti et al. (2000) attenuation curve (dotted line). For three of our galaxies we observe a good match with the SMC and β0 = −2.62 prediction, although the Meurer et al. (1999) IRX–βUV relation remains consistent within the measurement uncertainties. Six galaxies are clearly offset to bluer βUV values, and are most precisely reproduced by the Calzetti et al. (2000) and β0 = −2.62 prediction.
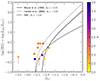 |
Fig. 3. Infrared excess as a function of the UV spectral slope of our galaxies, colour-coded by redshift. Our galaxies are all characterised by very blue βUV < −1.8 and low IRX < + 0.5. Most of them deviate from the canonical IRX–βUV relation (solid line; Meurer et al. 1999), and are better reproduced with the bluer intrinsic UV continuum slope β0 = −2.62 as computed by Reddy et al. (2018) for the SMC (dashed line) and Calzetti et al. (2000) (dotted line) extinction curves. |
Another well-studied empirical relation that links dust attenuation and stellar masses of galaxies is the IRX–Mstars relation, which is expected because Mstars is the outcome of past star-formation activity responsible for producing dust in supernovae (SNe) and pulsating moderate-mass asymptotic giant branch (AGB) stars, and is also suggested by simulations (Graziani et al. 2020). Different parametrisations are reported for samples of MS galaxies at z ∼ 1.5 − 4, showing, on average, that MS galaxies follow a relatively tight and shallow IRX–Mstars correlation with small variations from one sample to another (e.g. Heinis et al. 2014; Bouwens et al. 2016; Álvarez-Márquez et al. 2016; Koprowski et al. 2018), with the exception of the study of Fudamoto et al. (2020a) where they report a significantly steeper IRX–Mstars relation for their sample of z = 2.5 − 4.0 MS galaxies. Starburst galaxies at similar redshifts are found above the IRX–Mstars relation of MS galaxies with ∼ + 0.5 dex higher IRX values, indicating that starbursts are more dust extinct at a fixed Mstars (Fudamoto et al. 2020a). Our extreme starburst galaxies are among the few galaxies known with individual IRX measurements at stellar masses as low as log(Mstars/M⊙) = 9.17 − 9.66. Half of them follows more or less the shallow IRX–Mstars parametrisation, and the other half lies in between, that is, above the steep Fudamoto et al. (2020a) parametrisation and below the shallow parametrisation, and even below the parametrisation from Heinis et al. (2014) specifically derived from stacks of high LUV MS galaxies (log LUV/L⊙ = 10.64 − 10.94, which, nevertheless, are lower than the UV luminosities of our galaxies). Consequently, the currently still debated IRX–Mstars relation of MS galaxies, particularly for low stellar masses (Mstars/M⊙ < 1010), makes it difficult to bring definitive conclusions on the dust attenuation of our extreme starburst galaxies with respect to MS galaxies with similar Mstars. Globally, our galaxies populate the IRX and Mstars parameter space encompassed by the relations extrapolated from individual measurements and stacks of different samples of more massive MS galaxies at comparable redshifts. Nevertheless, they seem to agree particularly well with the new IRX–Mstars parametrisation recently derived by Bowler et al. (2024) for the very high redshift galaxies (z ∼ 4.5 − 7.7).
4.2. Molecular gas mass content and depletion timescale
The measurements (and upper limits) of the molecular gas masses of our galaxies, derived from the CO(3–2) or CO(4–3) luminosities, range between Mmolgas < 0.63 × 10¹⁰ M⊙ and 3.67 × 10¹⁰ M⊙ when derived with  (Table 4). As shown in Fig. 4, whatever αCO, our extreme starburst galaxies have significantly higher SFRUV+IR than MS galaxies at comparable Mmolgas, or, inversely, have significantly lower Mmolgas than MS galaxies at comparable SFRUV+IR (if these latter exist). This is in line with the integrated Kennicutt-Schmidt (KS) star-formation law and its Mmolgas–SFR parametrisations determined by Sargent et al. (2014) for MS galaxies (solid line in Fig. 4 derived from nearby and cosmic noon galaxies) and starburst galaxies (dashed line in Fig. 4 derived from nearby and z < 0.1 ULIRGs), as also reported by Daddi et al. (2010) and Genzel et al. (2010). Our galaxies actually represent the first sample of high redshift galaxies that shows an offset from MS galaxies high enough, when assuming
  , to lie on the starburst Mmolgas–SFR relation offset by more than 1 dex from the MS relation. Both the sample of massive starburst galaxies at z ∼ 1.6 studied by Silverman et al. (2015, 2018) and SMGs at z ∼ 1 − 5 (e.g. Bothwell et al. 2013; Calistro Rivera et al. 2018; Liu et al. 2019; Frias Castillo et al. 2023) do not reach the starburst star-formation regime even with
  . On the other hand, our galaxies still satisfy the empirical relation defined between LIR and
  established for diverse galaxy types from nearby galaxies (disks, dwarfs, starbursts) to ULIRGs, MS galaxies, SMGs, and quasars at z ∼ 0 − 5 (e.g. Carilli & Walter 2013; Dessauges-Zavadsky et al. 2015). This means that, for their IR luminosities, our starburst galaxies have the expected CO luminosities. They thus end up in the extreme starbursting regime mostly because of their very high unobscured SFRUV (see also Sect. 4.1).
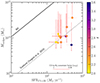 |
Fig. 4. Molecular gas mass as a function of the total (unobscured plus obscured) star-formation rate of our galaxies, colour-coded by redshift. The filled circles correspond to Mmolgas determined with |


The high SFRUV+IR of our galaxies yield very short molecular gas depletion timescales (tdepl = Mmolgas/SFRUV+IR) with a mean of 49 Myr ± 12 Myr for  (Table 4). As shown in the left panel of Fig. 5, these tdepl are significantly shorter by more than one order of magnitude than those measured in MS galaxies at any redshift (e.g. Béthermin et al. 2015; Liu et al. 2019; Tacconi et al. 2020; Dessauges-Zavadsky et al. 2020). They are also shorter than those reported for the massive starburst galaxies at z ∼ 1.6 with their mean tdepl ∼ 60 Myr (Silverman et al. 2015, 2018) and for the SMGs with their mean tdepl ∼ 200 Myr (e.g. Bothwell et al. 2013; Calistro Rivera et al. 2018; Frias Castillo et al. 2023), considering the same
  . The upper limit on tdepl derived for J1316+2614, our highest redshift galaxy, even suggests that all its molecular gas mass (Mmolgas < 6.3 × 10⁹ M⊙) is depleted in < 13 Myr! This remains true despite the uncertain LIR measurements (Sect. 3.3) affecting SFRUV+IR: if SFRUV+IR are underestimated the tdepl values would be even shorter, and if, on the other hand, SFRUV+IR are overestimated they would need to be overestimated by a factor of more than 10 to bring our galaxies to the tdepl values of MS galaxies at similar redshifts, which is implausible as SFRUV+IR are dominated by SFRUV and not by the uncertain SFRIR. Consequently, our extreme starburst galaxies are really vigorously consuming their molecular gas mass reservoir and are rapidly building up their stellar mass.
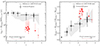 |
Fig. 5. Molecular gas depletion timescale (left) and molecular gas mass fraction (right) as a function of the redshift of our galaxies shown by the red filled circles. Similarly to Fig. 4, the dotted red segments represent the range of possible tdepl and fmolgas measurements of our galaxies as derived with CO-to-H2 conversion factors sampling values from |


In the right panel of Fig. 5 we show the molecular gas mass fractions (fmolgas = Mmolgas/(Mmolgas + Mstars)) of our galaxies as a function of redshift that we compare to MS galaxies. We observe that our galaxies have very high fmolgas with a mean of 82%±10% for  (Table 4). This reveals that their baryonic mass is dominated by the cold molecular gas mass over the stellar mass, with the mean molecular gas mass to stellar mass ratio (μmolgas = Mmolgas/Mstars) of 6 ± 3, and this despite the observed very rapid molecular gas consumption timescales (Fig. 5, left panel). This suggests that our extreme starburst galaxies are caught at the very beginning of their stellar mass build-up, or that cosmic gas inflows are actively feeding these galaxies. The measured fmolgas of our galaxies are in significant excess with respect to those of MS galaxies at similar redshifts, and still higher than those of MS galaxies with similar Mstars (and z) despite the existing steep fmolgas–Mstars anticorrelation (e.g. Béthermin et al. 2015; Liu et al. 2019; Tacconi et al. 2020; Dessauges-Zavadsky et al. 2020). The stellar masses of our galaxies would need to be underestimated by, on average, a factor of ∼3 − 4 to reach the upper end of the fmolgas distribution of MS galaxies at z ∼ 2.5. The same is true for them to reach the mean fmolgas ∼ 50% of the massive starburst galaxies at z ∼ 1.6 of Silverman et al. (2015, 2018) and even more to reach the mean fmolgas ∼ 40% of SMGs (e.g. Bothwell et al. 2013; Calistro Rivera et al. 2018; Frias Castillo et al. 2023), considering the same αCO.
4.3. Star-formation efficiency
Our extreme starburst galaxies are dominated by very young stellar populations of ∼10 Myr, with the bulk of their stellar mass being assembled within this short timescale given the absence of relevant old stellar populations, as described in Sect. 2. Upadhyaya et al. (2024), moreover, showed that their rest-frame UV spectra resemble those of nearby young star clusters (R136–Crowther et al. 2016 and SB179 Senchyna et al. 2017) and the Sunburst star cluster at z ≃ 2.4 (Meštrić et al. 2023). As a result, in contrast to most of the galaxies at cosmic noon whose stellar populations are a mixed bag of young and old populations dominated by old populations, our galaxies represent rare objects whose stellar populations are dominated by young populations representing > 30% to 62% of the total stellar mass of our galaxies (Marques-Chaves et al. 2020b, 2021, 2022, 2024).
We can thus measure the star-formation efficiency (ϵSF) of our galaxies, defined as the fraction of molecular gas mass converted into the recently formed stellar mass, namely here over the past ∼10 Myr, following  (Evans et al. 2009; Dessauges-Zavadsky et al. 2019, 2023). We find ϵSF ranging from 8% to 37% (Table 4), with a mean of 18%±9% for
  . J1249+1550 has the highest measured ϵSF approaching 40%, together with J1316+2614 with its lower limit ϵSF > 40%. They both are associated with very short molecular gas depletion timescales of 36 Myr and < 13 Myr, respectively, among the shorter in our galaxy sample (Table 4). One needs to keep in mind that the derived ϵSF likely are lower limits, as we do not know whether all the measured Mmolgas is associated with the star formation taking place in the compact starburst UV-bright component of our galaxies revealed by the HST and HAWK-I rest-frame UV/optical images (see Sect. 4.6).
The derived ϵSF of our extreme starburst galaxies are higher in comparison to those of a few percent only (≲5%) measured in nearby galaxies (e.g. Schruba et al. 2019; Utomo et al. 2018; Kim et al. 2023). On the other hand, they agree with the ϵSF values of ∼30% inferred for two strongly lensed MS galaxies at z ≃ 1 from the analysis of giant molecular clouds and their association with star-forming regions (Dessauges-Zavadsky et al. 2019, 2023). These enhanced ϵSF are comparable to those proposed in ultra-massive (Mstars > 1011 M⊙) optically dark and quenched galaxies recently discovered at z ∼ 5 − 6 (Xiao et al. 2024; de Graaff et al. 2024), whose existence can be explained by invoking very high star-formation efficiencies (≳20% to 100%). Similarly, Weibel et al. (2024) suggested that an increasing ϵSF with redshift, reaching values of ϵSF ∼ 30% at z ∼ 7 − 8, is required to explain the high-mass end of the stellar mass functions at z ≥ 4 − 9 as determined with JWST observations. On the simulation side, MillenniumTNG simulations also find that ϵSF of about 10%−30% are necessary in the early Universe to solve the observed excess of luminous/massive galaxies at z ≳ 8 discovered with JWST (Kannan et al. 2023). Values of ϵSF ≥ 57% are even invoked by Boylan-Kolchin (2023) to reconcile the standard ΛCDM cosmological model with the observed excess.
4.4. Dust mass content
The detected dust continuum emission in the Rayleigh-Jeans tail of the FIR SED (λrest > 230 μm) was used to estimate the dust mass content of our galaxies, as described in Sect. 3.3. However, the derived Mdust ranging from < 1.1 × 10⁷ M⊙ to 1.1 × 10⁸ M⊙ (Table 4) have to be considered with some caution given their large uncertainties coming from the poorly constrained FIR SED with one single band continuum measurement and the large number of free parameters entering in the dust composition models. The corresponding dust-to-gas mass ratios (δDGR = Mdust/Mmolgas) are spread out between log(δDGR) < − 2.9 and −2.1 for  . This spread is comparable to the dispersion of δDGR measurements reported in the literature at a given metallicity and the various extrapolated δDGR–metallicity relations that diverge even more at 12+log(O/H) < 8 (e.g. Magdis et al. 2012; Rémy-Ruyer et al. 2014; De Vis et al. 2019; Popping et al. 2023; Valentino et al. 2024). The observed δDGR–metallicity correlation is also found in semi-analytic models of galaxy formation that include the tracking of dust formation and destruction over cosmic time (e.g. Popping et al. 2017). Globally, the inferred δDGR of our galaxies lower than 10−2 (the typical δDGR value measured around solar metallicity) favour sub-solar metallicities in agreement with the metallicity measurements of our galaxies (12+log(O/H) = 8.13 − 8.49; Sect. 2).
In Fig. 6 we compare the dust masses of our extreme starburst galaxies to different empirical Mdust–Mstars relations presented in Kokorev et al. (2021, their Fig. 12) for MS galaxies at similar redshifts but extrapolated from more massive galaxies (log(Mstars/M⊙) > 10). Our galaxies agree with the Mdust–Mstars relation derived by Magnelli et al. (2020) as shown by the solid black line, but are well below the relations of Liu et al. (2019) and Kokorev et al. (2021) shown by the dotted and dashed black lines, respectively, which predict much higher Mdust for the low-Mstars MS galaxies at z ∼ 2.5. The Mdust estimates of our extreme starburst galaxies in fact resemble those of z ∼ 4 − 7 galaxies with comparable stellar masses (Pozzi et al. 2021; Sommovigo et al. 2022; Witstok et al. 2023; Valentino et al. 2024).
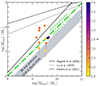 |
Fig. 6. Dust mass as a function of the stellar mass of our extreme starburst galaxies, colour-coded by redshift. Our galaxies agree with the Mdust–Mstars relation derived by Magnelli et al. (2020) as shown by the solid black line, but are well below the relations of Liu et al. (2019) and Kokorev et al. (2021) shown by the dotted and dashed black lines, respectively. The grey shaded zone defines the SN dust production as predicted by Gall & Hjorth (2019), which is barely sufficient to reproduce Mdust of most of our galaxies. The thick dashed-dotted green line defines the start of the AGB star contribution to the dust production (Witstok et al. 2023). |
The efficiency of dust production of our galaxies can be assessed by comparing their Mdust and Mstars with dust production models. In Fig. 6 the grey shaded zone defines the SN dust production as predicted by the model of Gall & Hjorth (2019), which assumes that the dust is produced during a star-formation episode lasting over Δt with a mean SFR and with SNe (or their massive star progenitors3) producing a fraction η of solar masses of dust, with the rate of SNe being proportional to SFR with the proportionality factor γ; such that the produced dust mass can be expressed as Mdust = γηSFRΔt. Gall & Hjorth (2019) computed the dust productivity μdust = γη and derived μdust = 0.004 ± 0.002 for the Chabrier (2003) IMF. The product SFRΔt gives the stellar mass assembled during the star-formation episode, which for our galaxies is computed over a burst age of ∼ 10 Myr as described in Sect. 2. The SN dust production can hence be expressed as Mdust = (0.004 ± 0.002)Mstars. This simple model indicates that SNe (or massive stars) alone barely produce enough dust (without considering dust destruction) during the short burst timescale of our extreme starburst galaxies (see the grey shaded zone in Fig. 6) to enable to reproduce their dust masses. For four galaxies, despite their big and conservative Mdust uncertainties (Sect. 3.3), their Mdust measurements even clearly step outside the predicted SN dust production, unless a top-heavy IMF is invoked, or the (young) stellar masses of these galaxies are underestimated by a factor of up to ∼4. On longer timescales, but relatively rapidly (for Δt ≳ 40 Myr), AGB stars start to contribute to the dust production in addition to SNe (Schneider & Maiolino 2024, their Fig. 1), as delimited by the thick dash-dotted green line in Fig. 6 derived by Witstok et al. (2023, following the simulations of Di Cesare et al. 2023). With respect to other dust formation models, only those by Imara et al. (2018) and Vijayan et al. (2019) predict the formation of enough dust to reproduce Mdust of all the low-Mstars galaxies in our sample; models of Popping et al. (2017) at z ∼ 2 − 3 globally follow the same trend as the SN dust production of Gall & Hjorth (2019).
4.5. FIR dust continuum and rest-frame UV/optical sizes
The FIR dust continuum sizes were measured in the uv plane for seven galaxies of our sample using the ALMA 1.3 mm band 6 observations (Sect. 3.3). They range between Reff, FIR = 1.7 kpc and 5.0 kpc (Table 3), and are shown as a function of LIR in Fig. 7. The dependence of the FIR dust sizes of high redshift galaxies (1 < z < 6) on LIR is still debated between, on one hand, the positive correlation (plotted as the dark-grey shaded area) reported by Fujimoto et al. (2017, based on a thousand of ALMA archival galaxies) that is in line with the stellar rest-frame UV size–luminosity correlation for star-forming galaxies (e.g. Shibuya et al. 2015), and, on the other hand, the anti-correlation (light-grey shaded area) proposed by Jin et al. (2022, based on a much smaller compilation of massive dusty galaxies, but with a better dynamical range towards lower LIR, from Valentino et al. 2020, Franco et al. 2020, and Gómez-Guijarro et al. 2022). In both studies, the big Reff, FIR 1 σ scatter (∼ 0.3 − 0.5 dex) at a given LIR weakens the significance of the respective correlations. We observe that Reff, FIR of our galaxies, on average, better agree with the relation of Jin et al. (2022).
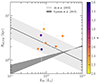 |
Fig. 7. Far-infrared dust continuum effective radius as a function of the IR luminosity of our galaxies, colour-coded by redshift. Our extreme starburst galaxies agree better with the Reff, FIR–LIR anti-correlation (light-grey shaded area) found by Jin et al. (2022) than with the Reff, FIR–LIR correlation (dark-grey shaded area) of Fujimoto et al. (2017). |
A dependence of Reff, FIR on stellar mass was also reported for massive galaxies at 1.5 < z < 4.5 by Gómez-Guijarro et al. (2022) as shown in Fig. 8 by the solid and dashed black lines at z < 2.5 and z > 2.5, respectively. Its slope is comparable to the slope of the stellar rest-frame UV effective radius versus Mstars relation derived for late-type galaxies (LTG) at similar redshifts z ∼ 2.5 (blue shaded area) but its normalisation is much lower by a factor of ∼3 − 4 (van der Wel et al. 2014). Fujimoto et al. (2017) also found that the FIR dust continuum sizes of high redshift galaxies are more compact than those at UV/optical wavelengths, albeit with a less different normalisation factor. Our galaxies have much higher Reff, FIR (filled circles) with respect to the Gómez-Guijarro et al. (2022) relations, and in fact very much agree with the stellar rest-frame UV sizes of LTG at z ∼ 2.5. TNG50 simulations from Popping et al. (2022) predict FIR dust continuum (850 μm rest-frame) sizes as a function of the stellar mass of MS galaxies from z = 1 to z = 5, which at z ∼ 2 − 3 approximately match Reff, FIR of our galaxies, but clearly overpredict the Reff, FIR–Mstars relations proposed by Gómez-Guijarro et al. (2022).
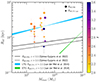 |
Fig. 8. Far-infrared dust continuum effective radius (filled circles) and rest-frame UV/optical effective radius (filled stars) as a function of the stellar mass of our galaxies, colour-coded by redshift. All our galaxies have systematically higher Reff, FIR than Reff, UV/opt. As a result, Reff, FIR of our galaxies strongly deviate from the Reff, FIR–Mstars relations of Gómez-Guijarro et al. (2022) at z < 2.5 and z > 2.5, shown by the solid and dashed black lines, respectively, as they are more extended. On the other hand, their Reff, UV/opt agree with the Reff, UV–Mstars relation (blue shaded area) derived for LTG at z ∼ 2.5 by van der Wel et al. (2014). The green shaded area corresponds to the Reff, UV–Mstars relation of z ∼ 2.5 early-type galaxies (ETG; van der Wel et al. 2014). |
In Fig. 8 we furthermore compare Reff, FIR (filled circles) with the rest-frame UV or optical effective radii (filled stars) derived from our HAWK-I seeing-limited H-band or AO Ks-band observations4, respectively (Sect. 3.4 and Table 3). We observe that half of our galaxies have Reff, UV/opt in agreement with those of LTG at z ∼ 2.5 (van der Wel et al. 2014), and the other half is considerably more compact. However, globally, all our extremely UV-luminous galaxies have Reff, FIR systematically higher than their Reff, UV/opt. As a result, the mean Reff, UV/opt/Reff, FIR = 0.43 ± 0.17 ratio of our galaxies contrasts with what is reported in the literature for galaxies at comparable redshifts 1 < z < 4, Reff, HST/Reff, ALMA ∼ 1.6 and ∼2.4 for, respectively, ALMA archival galaxies from Fujimoto et al. (2017) and massive galaxies from Franco et al. (2020). Our galaxies actually share one additional physical property in common with very high redshift UV-selected galaxies at 4.5 < z < 6, because these latter are also characterised by relatively extended FIR dust continuum sizes with respect to the compact UV sizes (≲1.5 kpc) with Reff, HST/Reff, ALMA = 0.39 ± 0.15 as recently measured by Pozzi et al. (2024, see also Mitsuhashi et al. 2024).
4.6. Rest-frame UV/optical morphology and spatial offsets
As shown in the middle-left panels of Figs. 1, A.1, and A.2, most of our extremely UV-luminous galaxies are characterised by a simple ‘roundish’ rest-frame UV or optical morphology with one main bright component with Reff, UV/opt ranging from 0.79 kpc to 2.01 kpc (Table 3). Two galaxies, J0950+0523 and J1316+2614, are particularly compact with Reff, opt < 0.74 kpc and < 0.55 kpc, respectively, unresolved in the HAWK-I AO Ks-band images. Only two galaxies, J0146–0220 and J0006+2452, show more complex rest-frame optical morphologies with one main bright and compact component with Reff, opt < 0.8 kpc (unresolved in HAWK-I AO Ks-band observations), centred on the phase centre, and a more diffuse component extended over > 2 kpc in radius and offset in one direction with respect to the main component. A second tiny component seems also to be present on top of the diffuse component in J0146–0220. The detected rest-optical diffuse emission can be interpreted as a possible signature of either a diffuse underlying old stellar population or diffuse outflowing gas as the HAWK-I Ks-band emission can instead trace the nebular Hα emission at the redshift of these two galaxies.
The recently acquired HST images of J1415+2036, J0850+1549, and J1316+2614 confirm that the rest-frame UV morphology of our extreme starburst galaxies is a mixed bag between one single component for J1316+2614 (Marques-Chaves et al. 2024) and multi-components with J1415+2036 and J0850+1549 showing, respectively, two and three very compact components (Marques-Chaves et al. in prep.) that are blended in ground-based observations (Figs. 1 and A.1, middle-left panels). The HST images also reveal that the extreme LUV we measure mostly comes from a very compact component, which is barely resolved even at the HST resolution. The galaxy J1316+2614 appears as the most extreme case in our sample, because it is composed of one single very compact HST component with an effective radius as small as  pc, co-spatial with the extended FIR dust continuum emission, and without any sign of underlying HST diffuse emission (Marques-Chaves et al. 2024).
In both J0146–0220 and J0006+2452 galaxies, the FIR dust continuum emission is co-spatial with the CO emission, but is offset from the main rest-optical component, whereas it aligns with the extended diffuse rest-optical emission. The offsets between the main rest-optical component and the FIR emission are 0.66″ and 0.59″, that is, about 5.5 kpc and 4.9 kpc, in J0146–0220 and J0006+2452, respectively. The possible origin of this offset is discussed in Sect. 5. J1249+1550 and J0850+1549 also seem to have their FIR emission slightly offset by ≲0.25 − 0.3″ from the bright rest-optical and rest-UV emission, respectively, but these offsets remain within the synthesised beam and PSF uncertainties and need to be confirmed. Thus, for seven out of nine galaxies one can assume that the UV/optical bright component is co-spatial with the more extended FIR emission and the CO emission (when detected) as shown in the middle-left and middle-right panels of Figs. 1, A.1, and A.2.
J1415+2036 and J0121+0025 show patchy CO emission peaks at 4 − 5σ significance level spread within < 3″ (i.e. < 25 kpc) around the phase centre (Figs. 1 and A.2, middle-right panels). Their integrated CO line detections nevertheless seem relatively robust, especially for J1415+2036, as shown by their respective CO line spectra plotted in the right panels of Figs. 1 and A.2. However, how this patchy CO emission with its relatively big spatial extent relates to the rest-frame UV/optical emission remains unclear, especially in J0121+0025 where the escaping LyC radiation (Marques-Chaves et al. 2021) needs to be reconciled with the presence of cold molecular gas. The other leaker, J1316+2614 (Marques-Chaves et al. 2022), is undetected in the CO emission with a stringent upper limit on its very depleted Mmolgas < 6.3 × 10⁹ M⊙ (Fig. 4).
5. Discussion
The studied sample consists of the 12 most UV-bright galaxies known at z ≃ 2.1 − 3.6 with MUV = −23.40 to −24.65 (Sect. 2 and Table 1), surpassing by 2 − 3 magnitudes the recently detected JWST UV-luminous galaxies at 7 < z < 16 brighter than  (e.g. Bouwens et al. 2023; Atek et al. 2023; Bunker et al. 2023; Casey et al. 2023; Castellano et al. 2024; Carniani et al. 2024). They also outshine by far the brightest stellar clusters known in the Sunburst (MUV ∼ −19) at z ≃ 2.4 and Sunrise (MUV ∼ −18) at z ≃ 6 galaxies (Vanzella et al. 2022, 2023). They are dominated by very young stellar populations of ∼10 Myr (as assessed from the rest-frame UV spectroscopy) and are powerful starbursts with a mean specific SFR (sSFR = SFR/Mstars) of 112 Gyr−1 (± 45 Gyr−1), placing them ∼1.5 dex above the MS for their redshifts and stellar masses (Mstars ∼ (1.47 − 4.59)×109 M⊙). They show unattenuated starlight with blue UV spectral slopes between βUV = −2.62 and −1.84, similar to those observed in several UV-bright galaxies at z > 7 (Roberts-Borsani et al. 2024; Heintz et al. 2024). They present complex gas kinematics showing signatures of outflows and inflows. Furthermore, they are not only very efficient at producing ionising radiation given their luminous MUV, but some of them leak high amounts of LyC photons (Marques-Chaves et al. 2021), including the record-holder J1316+2614 at z = 3.6122 with a LyC escape fraction of fesc(LyC) ≃ 90% (Marques-Chaves et al. 2022). In summary, our galaxies possibly experience very early stages of vigorous starbursts with a fast mode of stellar mass build-up, likely resembling the major bursts of star formation taking place in the UV-luminous galaxies recently discovered with JWST at the EoR.
The ALMA observations, analysed in this paper, furthermore reveal the relatively bright FIR dust continuum emission for nine of our galaxies, placing these extremely UV-luminous galaxies in the LIRG regime, and even the ULIRG regime for three galaxies, with LIR = (5.9 − 28.3)×1011 L⊙ (Table 3). All galaxies in the LIRG regime remain nevertheless dominated by the unobscured SFRUV, and half of them even have fobscured < 25%, much lower than UV-selected galaxies at z ∼ 4.5 − 7.7 (Sect. 4.1). The resulting IRX ratios together with the blue βUV best match the IRX–βUV relations determined for young stellar populations (Fig. 3), in line with their very young ages of ∼10 Myr derived from rest-frame UV spectra.
Large amounts of CO molecular gas in eight of our galaxies are also shown by ALMA observations, with much higher (up to an order of magnitude) molecular gas masses than their stellar masses, yielding very high fmolgas between 63% and 92% (Table 4 and Sect. 4.2). In what follows we refer to the Mmolgas measurements derived using the CO-to-H2 conversion factor  , but our conclusions do not change when considering the ∼4 times higher
  instead. ϵSF reliably estimated for our galaxies thanks to their dominant very young (∼10 Myr) stellar populations, show that very efficient star formation is taking place in our galaxies with ϵSF values reaching up to ∼40% (Sect. 4.3). Those are likely even higher if only part of the detected Mmolgas is associated with the star formation ongoing in the compact UV-bright component of our galaxies. This can, in particular, be the case for galaxies showing spatial offsets between the main UV-bright component and CO emission, currently evidenced in J1415+2036 and J0121+0025 (Sect. 4.6). The high ϵSF are a unique physical property characterising our galaxies together with their amazingly short tdepl between 36 Myr and 71 Myr (Table 4 and Sect. 4.2), which highlight a very efficient and fast conversion of gas into stars that can only result from the gas collapse within a very short free-fall time.
In their model, Dekel et al. (2023) suggest the formation of feedback-free starbursts (FFB) through the collapse of gas clouds within very short free-fall times, approaching the monolithic collapse model, in high density (> 103 cm−3 and > 2 × 10³ M⊙ pc−1) and low metallicity (Z ≤ 0.2 Z⊙) environments. This makes star formation very efficient, because the cloud collapse occurs before the onset of stellar winds and SNe feedback, allowing the formation of massive galaxies within a few million years; and this also makes galaxies appear blue with none to little dust attenuation. A significant fraction of gas mass (∼80%) is predicted to be in massive gas clouds shielded against feedback and which can hence participate in the FFB star formation. More specifically, Li et al. (2024) showed that globally the star-formation history (SFH) in an FFB galaxy occurs in several generations separated by about 10 Myr, which consist of a peak of nearly simultaneous FFB starbursts lasting for about 2 − 5 Myr and ending in low amounts of gas left over, followed by a period of gas accumulation until the onset of the following generation of bursts. The dispersion of the fmolgas and ϵSF measurements could be linked to the different SFH evolutionary stages of our galaxies following this model.
The stellar mass surface densities of our galaxies, defined as ΣMstars = Mstars/(2πReff2), range between ΣMstars = 80 M⊙ pc−1 and 1170 M⊙ pc−2 when measured with the ground-based rest-frame UV/optical effective radii listed in Table 3. However, as discussed in Sect. 4.6, the extreme LUV of our galaxies emerge from a compact component which is unresolved in the HAWK-I images (even with AO; Reff, opt < 0.8 kpc) and is barely resolved in the recently acquired HST images with  pc measured in J1316+2614 (Marques-Chaves et al. 2024). The derived Mstars also come from these compact UV-bright components (see Sect. 2), and represent > 30% to > 62% of the total stellar mass of our galaxies (Marques-Chaves et al. 2020b, 2021, 2022, 2024). As a result, the starbursting UV-bright components5, for an average
  pc, have very high ΣMstars ∼ (0.37−1.2) × 104 M⊙ pc−26 well in line with the surface density threshold required for an FFB to occur7 (Dekel et al. 2023). Most of the physical properties of our extremely UV-bright galaxies at z ∼ 2.5 actually seem to be naturally explained in the context of the FFB model, and this despite their Z ∼ 0.5 Z⊙ metallicities (Upadhyaya et al. 2024) while the FFB model was so far validated at Z ≤ 0.2 Z⊙. However, the measured metallicities should reflect the chemical enrichment of the starbursts over the past ∼10 Myr, potentially differing from the gas metallicity in the pre-FFB phase.
What furthermore needs to be understood is the relatively bright FIR dust continuum emission detected in nine of our galaxies (Sect. 4.4), and which we find co-spatial with the main rest-frame UV/optical component in seven galaxies (Sect. 4.6) in contrast with their very blue (βUV < −1.84) unattenuated starlight. A possible simple explanation could be geometrical, such that the UV-bright emission is located in front of the dust layer, hence appearing unaffected by dust obscuration. However, this specific geometrical alignment appears surprisingly too common given its high occurrence for seven out of nine galaxies.
Another interpretation could follow the Ferrara et al. (2023) model (see also Ziparo et al. 2023; Ferrara 2024) which suggests a temporary removal of dust (and gas) cleared by radiation-driven outflows that develop when galaxy luminosities become super-Eddington, making galaxies appear UV brighter and bluer with very low dust attenuation (AV ≲ 0.02), and having an impact on the occurrence of huge LyC leakage. All our galaxies (see Table 1) can potentially develop such radiation-driven outflows given their sSFR well above the super-Eddington sSFR > 25 Gyr−1 threshold8 computed by Ferrara (2024), in contrast to MS galaxies that reach this super-Eddington limit only at very high redshifts of z > 7 (Faisst et al. 2016; Bouwens et al. 2022b; Bradley et al. 2023; Stefanon et al. 2022, 2023).
Evidence of outflowing gas was reported in two of our galaxies so far, J1220+0842 (Álvarez-Márquez et al. 2021) and J0121+0025 (Marques-Chaves et al. 2021), from ISM absorption lines showing blueshifted centroids with respect to the systemic redshift by −400 km s−1 and −450 km s−1, respectively, in line with their Lyα profiles. The Lyα profiles of two other galaxies, J1249+1550 and J0850+1549, also support outflows. And, evidence of dust being possibly blown away in our galaxies is maybe best highlighted in J0146–0220 and J0006+2452, where the FIR emission is spatially offset from the main compact rest-optical component along with the diffuse rest-optical emission (Sect. 4.6). For the seven other galaxies with co-spatial FIR dust continuum emission, we can speculate that the dust is expelled out spherically creating a ‘hole’ in the FIR emission at the location of the UV-bright component and with a size of at least the UV-bright component’s radius ( pc; see above), currently unresolved at the angular resolution of our ALMA observations. The recent discovery of the Lyα hole in J1316+2614 at the location of the stellar UV emission while the Lyα emission extends out to ∼6 kpc (Marques-Chaves et al. 2024) provides support to a comparable FIR dust emission hole, because dust should follow the same distribution as the Lyα emission that is tracing neutral gas. Moreover, the particularly big Reff, FIR > 1.7 kpc (higher than Reff, UV/opt) of the FIR dust emission of our galaxies (Table 3) are also in line with dust being pushed beyond the radius of ∼2 − 3 kpc at which it becomes optically thin (as predicted by Ferrara 2024). Same is likely true for the gas that is also expected to be removed by outflows, and the CO emission is indeed found co-spatial with the FIR dust emission (Figs. 1, A.1, and A.2). Nevertheless, we do not observe any evidence of outflowing molecular gas in any of the currently available CO line profiles (no broad CO line component is detected; see Figs. 1, A.1, and A.2, right panels).
Menon et al. (2024) also demonstrated in their radiation hydrodynamical numerical simulations that localised starbursts can evacuate (local) surrounding dust/gas through radiation-driven outflows in very high stellar/gas surface density conditions (Σ > 103 M⊙ pc2) in line with the ΣMstars measured for our starbursting UV-bright components (see above). Their results are slightly different from the Ferrara et al. (2023) model which invokes a global galaxy-scale radiation-driven outflow, whereas their simulations suggest a picture where ‘localised’ outflows (at tens of parsecs scale) enable the UV-emitting stellar populations to be visible, while other regions can still be obscured, resulting in co-spatial UV/FIR emission when viewed with large apertures.
The origin of the dust detected in our galaxies remains to be explained. Dust could be produced by SNe at the end of the FFB phase, or have an independent origin before the onset of the FFB. As discussed in Sect. 4.4, the inferred dust masses (Table 4) – however relatively uncertain since derived from single band continuum measurements at 1.3 mm – can barely be produced by SNe (or massive stars) during the ∼10 Myr starburst phase (Gall & Hjorth 2019) for most of our galaxies and are clearly in excess in four galaxies, at least with the standard Chabrier (2003) IMF. This suggests that some dust was probably already produced prior to the burst of star formation by an older stellar population (from AGB stars and previous SNe). However, the evidence of an old stellar population currently remains elusive. So far, the SED analysis supports the absence of significant old stellar populations in these galaxies (Marques-Chaves et al. 2020b, 2021, 2022, 2024), and the nature of the underlying diffuse rest-frame optical emission detected with HAWK-I in at least two galaxies, J0146–0220 and J0006+2452, still needs to be understood (Sect. 4.6).
Other dust production mechanisms can be invoked, such as the rapid grain growth in the galaxy ISM (Graziani et al. 2020; Dayal et al. 2022; Schneider & Maiolino 2024) that would bypass the need of an old stellar population. Moreover, recently Higgins et al. (2023) reported that VMSs with masses of some 200 M⊙ can eject 100 times more heavy elements in their winds than 50 M⊙ stars and hence possibly produce more dust. Evidence of VMSs in some of our extreme starburst galaxies is obtained from the detection of intense and broad He IIλ1640 emission lines, with equivalent widths of EW0 = 3 − 5 Å (Upadhyaya et al. 2024; Marques-Chaves et al. 2020b, 2021, 2022), that is, much stronger than that typically found in normal star-forming galaxies (EW0 ≃ 1 Å; Shapley et al. 2003). Such high EW0 are difficult to explain by standard stellar models with an IMF upper mass cut-off Mupp = 100 M⊙, but are reproduced well by evolutionary models and atmospheres of VMSs with masses from 100 M⊙ to 400 M⊙ (Martins & Palacios 2022). If such populations including VMSs can produce sufficient amounts of dust as those observed in our galaxies remains to be worked out.
Marques-Chaves et al. (2020b) speculated on the fate of these extreme starburst galaxies and proposed two scenarios. Either these are the progenitors of compact present-day ellipticals (the so-called red nuggets; e.g. Dekel & Burkert 2014) in case the star formation quenches right after the starburst phase, or these are ultra-/hyper-luminous dusty star-forming galaxies (DSFGs; Santini et al. 2010) caught in their very early evolutionary stage (∼10 Myr), before their dust-poor extremely UV-luminous phase gets obscured by dust, in case the intense SFR activity lasts over a few hundreds of million years if located in gas-rich environments. The tdepl measurements derived in this work now provide a constraint on the gas consumption timescales of our galaxies. They highlight that most of our galaxies have enough gas to sustain the SFR over a few dozens of million years, that is, a factor of around three to seven longer than the current ∼10 Myr age of the burst. As a result, over these timescales they will more than triple their Mstars, and produce large amounts of dust by more than tripling their Mdust just from the SN dust production (reaching Mdust/M⊙ ≳ 108 − 109 according to Gall & Hjorth 2019). They could hence turn into FIR-bright DSFGs, heavily obscured in the UV. On the other hand, galaxies with tdepl comparable to the burst age (∼10 Myr), and especially J1316+2614 with tdepl < 13 Myr, are expected to quench rapidly by starvation even before reaching the SMG phase, likely representing the very initial phases in the evolution of massive quiescent galaxies.
6. Summary and conclusions
In this study, we performed an analysis of the ALMA FIR 1.3 mm (240 GHz) dust continuum and the CO(3–2) or CO(4–3) emission of 12 starburst galaxies at z = 2.08 − 3.61 selected for their extreme brightness in the rest-frame UV with absolute magnitudes MUV = −23.4 to −24.7. We also analysed the HAWK-I seeing-limited H-band and AO Ks-band images acquired for ten targets. The rest-frame UV and optical properties of seven of these targets have already been analysed in detail in previous works (Marques-Chaves et al. 2020b, 2021, 2022, 2024; Álvarez-Márquez et al. 2021; Upadhyaya et al. 2024). All the galaxies are characterised by steep UV spectral slopes βUV = −2.62 to −1.84 and dominated by very young stellar populations of ∼10 Myr, indicating that the bulk of their stellar mass Mstars = (1.47 − 4.59)×109 M⊙ was formed in an intense starburst phase over ∼10 Myr given the absence of relevant old stellar populations. They have sub-solar metallicities ranging between 12 + log(O/H) = 8.13 and 8.49. Signatures of very massive stars with masses from 100 M⊙ to 400 M⊙ are revealed in their rest-frame UV spectra (Upadhyaya et al. 2024) from the strong and broad He IIλ1640 emission line (e.g. Crowther et al. 2016; Martins et al. 2023; Schaerer et al. 2024), suggesting an IMF with possibly a higher upper mass cut-off and likely also boosting their LUV (Schaerer et al. 2024). Several targets in our sample present complex gas kinematics showing evidence of outflows and even inflows for one galaxy (J1316+2614). They are all strong producers of ionising radiation given their very luminous MUV, and two of them are identified as strong LyC leakers (J0121+0025 and J1316+2614). Placed at the EoR, these galaxies alone would be able to ionise their environment.
Detected in nine galaxies, the ALMA FIR dust continuum emission provides constraints on their IR luminosities, obscured SFRIR, and dust masses, and the CO emission detected in eight galaxies provides constraints on their molecular gas masses:
-
With LIR = (5.9 − 28.3)×1011 L⊙ our galaxies populate the LIRG regime, and even the ULIRG regime for three galaxies. All the LIRG-type galaxies remain dominated by the unobscured SFRUV. For half of the galaxies, the obscured fractions of star formation are less than 25%, placing them a factor of two below the empirical fobscured–Mstars relation of Whitekar et al. (2017), that is, even below the UV-selected galaxies at z ∼ 4.5 − 7.7 (Fudamoto et al. 2020b; Algera et al. 2023).
-
The resulting total SFRUV+IR bring these UV-bright galaxies considerably above (a factor of ∼30) the main sequence of star-forming galaxies for similar redshifts and stellar masses (e.g. Speagle et al. 2014), confirming they are powerful starbursts with specific SFRs as high as
 .
. -
The blue UV spectral slopes and luminous LUV, implying IRX < + 0.5, shift our extreme starburst galaxies away from the canonical IRX–βUV relation of Meurer et al. (1999) to relations expected for younger and lower metallicity stellar populations (Reddy et al. 2018), in agreement with their ∼10 Myr ages derived from rest-frame UV spectroscopy and sub-solar metallicities. Our galaxies are among the few with individual IRX measurements at their low stellar masses. They populate the IRX–Mstars parameter space between the relations found for main sequence galaxies at z ∼ 1.5 − 4 when extrapolated to lower Mstars (e.g. Bouwens et al. 2016; Fudamoto et al. 2020a) and agree best with the relation derived for very high redshift UV-selected galaxies at z ∼ 4.5 − 7.7 (Bowler et al. 2024), but they definitely disagree with starburst galaxies at comparable redshifts that have a much higher IRX at fixed Mstars (Fudamoto et al. 2020a).
-
The high dust masses Mdust = (2.3 − 11.1)×107 M⊙ of our galaxies (to be confirmed with a better FIR SED sampling) support an efficient dust production given their ∼10 Myr ages. Indeed, SNe alone barely produce such dust amounts during this short timescale (Gall & Hjorth 2019) and even fail for four galaxies unless a top-heavy IMF is invoked. Other dust production mechanisms can be invoked, for instance the rapid grain growth in the ISM, VMSs, or AGB stars in the presence of an old stellar population that remains elusive (Schneider & Maiolino 2024; Higgins et al. 2023).
-
The dust-to-gas mass ratios of our UV-bright galaxies range between < 10−2.9 and 10−2.1 (for
 ) and are consistent with different δDGR–12 + log(O/H) relations when extrapolated to their sub-solar metallicities (e.g. Popping et al. 2023).
 -
Our extreme starburst galaxies are offset from the integrated KS Mmolgas–SFRUV+IR relation of main sequence galaxies and match the starburst regime as defined by Sargent et al. (2014). Their high SFRUV+IR with respect to their Mmolgas give unprecedentedly short molecular gas depletion timescales between tdepl < 13 Myr and 71 Myr (for
 ). On the other hand, their baryonic masses remain dominated by the cold molecular gas over stars, which results in very high molecular gas mass fractions between fmolgas < 60% and 92% (for
  ), in significant excess with respect to those of main sequence galaxies (e.g. Tacconi et al. 2020). This suggests that these extreme starburst galaxies are caught at the very beginning of their intense starburst phase while vigorously consuming their still high molecular gas mass reservoir to build up their stellar mass.
 -
Dominated by very young stellar populations of ∼10 Myr, we obtained direct star-formation efficiency measurements of our galaxies ranging from ϵSF = 8% to > 40% (for
 ); these are much higher than ϵSF < 5% measured in nearby galaxies (e.g. Kim et al. 2023). The derived ϵSF should even be considered as lower limits given that only a percentage of the detected CO gas may be involved in the ongoing star formation. These high ϵSF, together with very short tdepl, highlight the amazingly efficient and fast conversion of gas into stars of these UV-bright galaxies.
 -
The FIR dust continuum effective radii of our galaxies range between Reff, FIR = 1.7 kpc and 5 kpc, and are bigger than their Reff, UV/opt. The corresponding mean Reff, UV/opt/Reff, FIR = 0.43 ± 0.17 is in contrast to what is typically observed for galaxies at comparable redshifts (Fujimoto et al. 2017) but in agreement with the size properties of very high redshift UV-selected galaxies at 4.5 < z < 6 (Mitsuhashi et al. 2024; Pozzi et al. 2024).
-
Our extremely UV-luminous galaxies are mostly characterised by a simple rest-frame UV/optical morphology, as assessed from HAWK-I observations, composed of one main bright component with Reff, UV/opt < 0.55 kpc to 2.01 kpc. Only two galaxies, J0146–0220 and J0006+2452, have more complex rest-frame optical morphologies with one main bright compact component (Reff, opt < 0.8 kpc) and a diffuse component extended over Reff, opt > 2 kpc that is offset in one direction with respect to the main component. A second tiny component is also present in J0146–0220. The diffuse emission could either trace an underlying old stellar population or outflowing gas as the HAWK-I Ks-band is contaminated by the nebular Hα emission at the redshift of these two galaxies. HST images acquired for three of our galaxies confirmed the multi-component morphology (blended in the ground-based images) for two other galaxies, J1415+2036 and J0850+1549, whereas J1316+2614 remains composed of one single extremely UV-bright and compact component. All of these components are barely resolved even at the HST resolution (
 pc for J1316+2614; Marques-Chaves et al. 2024).
 -
For seven galaxies, the main rest-UV/optical bright component is co-spatial with the more extended FIR dust continuum emission and the CO emission (when detected). This is quite surprising given their very blue unattenuated starlight. Only two galaxies, J0146–0220 and J0006+2452, have their FIR and CO emissions offset from the main rest-optical component but aligned with the extended diffuse rest-optical emission.
The extremely UV-luminous galaxies studied in this paper are recognised as being among the brightest UV galaxies known with MUV = −23.4 to −24.6 and among the most powerful starbursts, harbouring very young stellar populations of about 10 Myr. Their high star-formation efficiencies and very short molecular gas depletion timescales, together with their still very high molecular gas masses dominating over their stellar masses, strongly suggest that these galaxies are caught at the very beginning of their stellar mass build-up in an incredibly intense, rapid, and efficient gas-to-stars conversion phase. We find that the feedback-free starburst model of Dekel et al. (2023) seems to be able to explain the unique physical properties of our galaxies through the collapse of gas clouds within very short free-fall times before the onset of stellar winds and SN feedback. However, in addition to this, our galaxies are characterised by a relatively bright FIR dust continuum emission that is found to be co-spatial with the main rest-UV/optical bright component in seven out of nine galaxies. This is in strong contrast with their blue unattenuated starlight, as one would rather expect the galaxy to be dust obscured. To reconcile these physical properties, the Ferrara et al. (2023) model of dust removal by radiation-driven outflows taking place above the super-Eddington threshold at the location of the starburst appears to be a viable option and would also explain the big FIR effective radii of our galaxies in comparison to their stellar effective radii (see also Menon et al. 2024). Finally, the measured dust masses seem to require dust production mechanisms that are more rapid and efficient than SNe given the short 10 Myr timescale available for their formation.
While these extremely UV-luminous starburst galaxies are rare at z = 2.1 − 3.6, with only about 70 of them found in the ∼ 9000 deg2-wide eBOSS survey, corresponding to a number density of 10−9 Mpc−3 (Marques-Chaves et al., in prep.), intrinsically they are certainly not so rare. The detection of some of them at z > 6 (e.g. Sobral et al. 2015; Matsuoka et al. 2018; Hashimoto et al. 2019) and, more recently, their unexpected overabundance discovered at 7 < z < 16 with JWST, implying steeper UV luminosity functions than predicted (e.g. Bouwens et al. 2023; Atek et al. 2023; Bunker et al. 2023; Casey et al. 2023; Castellano et al. 2024; Carniani et al. 2024), show that galaxies towards the EoR are more often experiencing such UV-luminous and still unobscured phases, with high sSFRs. As discussed in Sect. 1, different scenarios were invoked to explain the UV-luminous starburst galaxies at the EoR and their number excess. Among these scenarios are the very efficient star formation following the Dekel et al. (2023) model and the Ferrara et al. (2023, see also Ziparo et al. 2023, Ferrara 2024) model of temporary dust removal as a consequence of radiation-driven outflows, for which the molecular gas and FIR dust continuum analysis of our galaxies provides some support. Alternatively, a modified IMF (towards a top-heavy one) boosting the UV radiation and the luminosity-to-mass ratio of galaxies was also proposed (e.g. Bekki & Tsujimoto 2023; Trinca et al. 2024) as well as a stochastic variability of the SFR (e.g. Mirocha & Furlanetto 2023; Gelli et al. 2024). Currently, we have no evidence supporting a modified IMF except possibly an IMF with a higher upper mass cut-off given that our galaxies host VMSs (Upadhyaya et al. 2024) that can also lead to high UV luminosity increases (Schaerer et al. 2024).
In summary, these galaxies show several similarities with the galaxies recently unveiled at the EoR with JWST. They hence possibly represent a sample of lower redshift ‘analogues’ that benefit from the advantage of a rich dataset and data to come that will be difficult to acquire for galaxies at z > 7. Our UV-bright galaxies at cosmic noon thus are ideal laboratories to test different scenarios proposed to explain what triggers the extreme UV luminosities and starbursts of galaxies and their number excess at the EoR.
However, one needs to keep in mind that the HAWK-I images at the redshift of our galaxies are likely dominated by the strong rest-frame optical lines, [O III]+Hβ or Hα.
The model of Gall & Hjorth (2019) does not specify how exactly the dust is produced in SNe or in massive stars prior the SN explosion.
For J0850+1549 and J0121+0025 we used the CFHT MegaCam and Subaru seeing-limited R-band observations, respectively.
The corresponding SFRUV surface densities of the UV-bright components are also huge with ΣSFRUV ∼ (0.27−1.1) × 103 M⊙ yr−1 kpc−2. Only a few massive stellar clusters at sub-10 pc scales, hosted in the Sunburst and Sunrise high redshift galaxies, have such extreme ΣSFRUV (Vanzella et al. 2022, 2023; Messa et al. 2024).
Such high ΣMstars were only reported for very few star-forming galaxies with similar Mstars and redshifts, and are more common for more massive compact star-forming galaxies (Barro et al. 2017), as well as for young star-forming clumps at 1 < z < 3 yet typically having two orders of magnitude lower stellar masses (e.g. Claeyssens et al. 2023; Messa et al. 2024).
For one of our galaxies, J1220+0842, Marques-Chaves et al. (2020b) could even measure its density from the [O II] λ3729/λ3726 and C III] λ1906/λ1908 line ratios that is > 103 cm−3, namely in agreement with the FFB density threshold.
The super-Eddington limit from Ferrara (2024) was reassessed by Li et al. (2024), who found that super-Eddington ejections potentially take place at z > 16 only.
Acknowledgments
This paper makes use of the following ALMA data: ADS/JAO.ALMA#2018.1.00932.S and 2021.1.01438.S. ALMA is a partnership of ESO (representing its member states), NSF (USA) and NINS (Japan), together with NRC (Canada), NSC and ASIAA (Taiwan), and KASI (Republic of Korea), in cooperation with the Republic of Chile. The Joint ALMA Observatory is operated by ESO, AUI/NRAO and NAOJ. This paper is also based on observations collected at the European Organisation for Astronomical Research in the Southern Hemisphere under ESO programme 111.251K.001.
References
- Abolfathi, B., Aguado, D. S., Aguilar, G., et al. 2018, ApJS, 235, 42 [NASA ADS] [CrossRef] [Google Scholar]
- Algera, H. S. B., Inami, H., Oesch, P. A., et al. 2023, MNRAS, 518, 6142 [Google Scholar]
- Álvarez-Márquez, J., Burgarella, D., Heinis, S., et al. 2016, A&A, 587, A122 [NASA ADS] [CrossRef] [EDP Sciences] [Google Scholar]
- Álvarez-Márquez, J., Burgarella, D., Buat, V., Ilbert, O., & Pérez-González, P. G. 2019, A&A, 630, A153 [NASA ADS] [CrossRef] [EDP Sciences] [Google Scholar]
- Álvarez-Márquez, J., Marques-Chaves, R., Colina, L., & Pérez-Fournon, I. 2021, A&A, 647, A133 [NASA ADS] [CrossRef] [EDP Sciences] [Google Scholar]
- Atek, H., Shuntov, M., Furtak, L., et al. 2023, MNRAS, 519, 1201 [Google Scholar]
- Barro, G., Faber, M., Koo, D. C., et al. 2017, ApJ, 840, 47 [CrossRef] [Google Scholar]
- Beelen, A., Cox, P., Benford, D. J., et al. 2006, ApJ, 642, 694 [NASA ADS] [CrossRef] [Google Scholar]
- Bekki, K., & Tsujimoto, T. 2023, MNRAS, 526, L26 [NASA ADS] [CrossRef] [Google Scholar]
- Bertoldi, F., Carilli, C. L., Cox, P., et al. 2003, A&A, 406, L55 [NASA ADS] [CrossRef] [EDP Sciences] [Google Scholar]
- Béthermin, M., Daddi, E., Magdis, G., et al. 2015, A&A, 573, A113 [Google Scholar]
- Bianchi, S., & Schneider, R. 2007, MNRAS, 378, 973 [NASA ADS] [CrossRef] [Google Scholar]
- Bolatto, A. D., Wolfire, M., & Leroy, A. K. 2013, ARA&A, 51, 207 [CrossRef] [Google Scholar]
- Boogaard, L. A., van der Werf, P., Weiss, A., et al. 2020, ApJ, 902, 109 [NASA ADS] [CrossRef] [Google Scholar]
- Bothwell, M. S., Smail, I., Chapman, S. C., et al. 2013, MNRAS, 429, 3047 [Google Scholar]
- Bouwens, R. J., Aravena, M., Decarli, R., et al. 2016, ApJ, 833, 72 [NASA ADS] [CrossRef] [Google Scholar]
- Bouwens, R. J., Illingworth, G. D., van Dokkum, P. G., et al. 2022a, ApJ, 927, 81 [NASA ADS] [CrossRef] [Google Scholar]
- Bouwens, R. J., Smit, R., Schouws, S., et al. 2022b, ApJ, 931, 160 [NASA ADS] [CrossRef] [Google Scholar]
- Bouwens, R. J., Stefanon, M., Brammer, G., et al. 2023, MNRAS, 523, 1009 [NASA ADS] [CrossRef] [Google Scholar]
- Bowler, R. A. A., Inami, H., Sommovigo, L., et al. 2024, MNRAS, 527, 5808 [Google Scholar]
- Boylan-Kolchin, M. 2023, Nat. Astron., 7, 731 [NASA ADS] [CrossRef] [Google Scholar]
- Bradley, L. D., Coe, D., Brammer, G., et al. 2023, ApJ, 955, 13 [CrossRef] [Google Scholar]
- Bunker, A. J., Saxena, A., Cameron, A. J., et al. 2023, A&A, 677, A88 [NASA ADS] [CrossRef] [EDP Sciences] [Google Scholar]
- Byrne, C. M., Stanway, E. R., Eldridge, J. J., McSwiney, L., & Townsend, O. T. 2022, MNRAS, 512, 5329 [NASA ADS] [CrossRef] [Google Scholar]
- Calistro Rivera, G., Hodge, J. A., Smail, I., et al. 2018, ApJ, 863, 56 [Google Scholar]
- Calzetti, D., Armus, L., Bohlin, R. C., et al. 2000, ApJ, 533, 682 [NASA ADS] [CrossRef] [Google Scholar]
- Carilli, C. L., & Walter, F. 2013, ARA&A, 51, 105 [NASA ADS] [CrossRef] [Google Scholar]
- Carniani, S., Hainline, K., D’Eugenio, F., et al. 2024, Nature, 633, 318 [CrossRef] [Google Scholar]
- Casey, C. M. 2012, MNRAS, 425, 3094 [Google Scholar]
- Casey, C. M., Narayanan, D., & Cooray, A. 2014, Phys. Rep., 541, 45 [Google Scholar]
- Casey, C. M., Kartaltepe, J. S., Drakos, N. E., et al. 2023, ApJ, 954, 31 [NASA ADS] [CrossRef] [Google Scholar]
- Castellano, M., Napolitano, L., Fontana, A., et al. 2024, ApJ, 972, 143 [Google Scholar]
- Chabrier, G. 2003, PASP, 115, 763 [Google Scholar]
- Chemerynska, I., Atek, H., Furtak, L. J., et al. 2024, MNRAS, 531, 2615 [NASA ADS] [CrossRef] [Google Scholar]
- Claeyssens, A., Adamo, A., Richard, J., Mahler, G., Messa, M., & Dessauges-Zavadsky, M. 2023, MNRAS, 520, 2180 [NASA ADS] [CrossRef] [Google Scholar]
- Crowther, P. A., Caballero-Nieves, S. M., Bostroem, K. A., et al. 2016, MNRAS, 458, 624 [Google Scholar]
- da Cunha, E., Groves, B., Walter, F., et al. 2013, ApJ, 766, 13 [Google Scholar]
- Daddi, E., Elbaz, D., Walter, F., et al. 2010, ApJ, 714, L118 [NASA ADS] [CrossRef] [Google Scholar]
- Daddi, E., Dannerbauer, H., Liu, D., et al. 2015, A&A, 577, A46 [NASA ADS] [CrossRef] [EDP Sciences] [Google Scholar]
- Dayal, P., Ferrara, A., Sommovigo, L., et al. 2022, MNRAS, 512, 989 [NASA ADS] [CrossRef] [Google Scholar]
- de Graaff, A., Setton, D. J., Brammer, G., et al. 2024, arXiv e-prints [arXiv:2404.05683] [Google Scholar]
- Dekel, A., & Burkert, A. 2014, MNRAS, 438, 1870 [Google Scholar]
- Dekel, A., Sarkar, K. C., Birnboim, Y., Mandelker, N., & Liet, Z. 2023, MNRAS, 523, 3201 [NASA ADS] [CrossRef] [Google Scholar]
- Dessauges-Zavadsky, M., D’Odorico, S., Schaerer, D., et al. 2010, A&A, 510, A26 [NASA ADS] [CrossRef] [EDP Sciences] [Google Scholar]
- Dessauges-Zavadsky, M., Christensen, L., D’Odorico, S., Schaerer, D., & Richard, J. 2011, A&A, 533, A15 [NASA ADS] [CrossRef] [EDP Sciences] [Google Scholar]
- Dessauges-Zavadsky, M., Zamojski, M., Schaerer, D., et al. 2015, A&A, 577, A50 [NASA ADS] [CrossRef] [EDP Sciences] [Google Scholar]
- Dessauges-Zavadsky, M., Zamojski, M., Rujopakarn, W., et al. 2017, A&A, 605, A81 [NASA ADS] [CrossRef] [EDP Sciences] [Google Scholar]
- Dessauges-Zavadsky, M., Richard, J., Combes, F., et al. 2019, Nat. Astron., 3, 1115 [NASA ADS] [CrossRef] [Google Scholar]
- Dessauges-Zavadsky, M., Ginolfi, M., Pozzi, F., et al. 2020, A&A, 643, A5 [NASA ADS] [CrossRef] [EDP Sciences] [Google Scholar]
- Dessauges-Zavadsky, M., Richard, J., Combes, F., et al. 2023, MNRAS, 519, 6222 [NASA ADS] [CrossRef] [Google Scholar]
- De Vis, P., Jones, A., Viaene, S., et al. 2019, A&A, 623, A5 [NASA ADS] [CrossRef] [EDP Sciences] [Google Scholar]
- Di Cesare, C., Graziani, L., Schneider, R., et al. 2023, MNRAS, 519, 4632 [Google Scholar]
- Eisenstein, D. J., Weinberg, D. H., Agol, E., et al. 2011, AJ, 142, 72 [Google Scholar]
- Eldridge, J. J., Stanway, E. R., Xiao, L., et al. 2017, PASA, 34, 58 [NASA ADS] [CrossRef] [Google Scholar]
- Endsley, R., Stark, D. P., Chevallard, J., & Charlot, S. 2021, MNRAS, 500, 5229 [Google Scholar]
- Evans, N. J., II, Dunham, M. M., Jørgensen, J. K., et al. 2009, ApJS, 181, 321 [Google Scholar]
- Faisst, A. L., Capak, P., Hsieh, B. C., et al. 2016, ApJ, 821, 122 [Google Scholar]
- Ferrara, A. 2024, A&A, 684, A207 [NASA ADS] [CrossRef] [EDP Sciences] [Google Scholar]
- Ferrara, A., Pallottini, A., & Dayal, P. 2023, MNRAS, 522, 3986 [NASA ADS] [CrossRef] [Google Scholar]
- Finkelstein, S. L., & Bagley, M. B. 2022, ApJ, 938, 25 [NASA ADS] [CrossRef] [Google Scholar]
- Finkelstein, S. L., Leung, G. C. K., Bagley, M. B., et al. 2024, ApJL, 969, L2 [NASA ADS] [CrossRef] [Google Scholar]
- Franco, M., Elbaz, D., Zhou, L., et al. 2020, A&A, 643, A30 [NASA ADS] [CrossRef] [EDP Sciences] [Google Scholar]
- Frias Castillo, M., Hodge, J., Rybak, M., et al. 2023, ApJ, 945, 128 [NASA ADS] [CrossRef] [Google Scholar]
- Fudamoto, Y., Oesch, P. A., Schinnerer, E., et al. 2017, MNRAS, 472, 483 [Google Scholar]
- Fudamoto, Y., Oesch, P. A., Magnelli, B., et al. 2020a, MNRAS, 491, 4724 [Google Scholar]
- Fudamoto, Y., Oesch, P. A., Faisst, A., et al. 2020b, A&A, 643, A4 [NASA ADS] [CrossRef] [EDP Sciences] [Google Scholar]
- Fujimoto, S., Ouchi, M., Shibuya, T., & Nagai, H. 2017, ApJ, 850, 83 [Google Scholar]
- Gaia Collaboration (Vallenari, A., et al.) 2023, A&A, 674, A1 [NASA ADS] [CrossRef] [EDP Sciences] [Google Scholar]
- Gall, C., & Hjorth, J. 2019, ApJ, 868, 62 [Google Scholar]
- Galliano, F., Hony, S., Bernard, J.-P., et al. 2011, A&A, 536, A88 [NASA ADS] [CrossRef] [EDP Sciences] [Google Scholar]
- Gelli, V., Mason, C., & Hayward, C. C. 2024, arXiv e-prints [arXiv:2405.13108] [Google Scholar]
- Genzel, R., Tacconi, L. J., Gracia-Carpio, J., et al. 2010, MNRAS, 407, 2091 [NASA ADS] [CrossRef] [Google Scholar]
- Ginolfi, M., Schneider, R., Valiante, R., et al. 2019, MNRAS, 483, 1256 [NASA ADS] [CrossRef] [Google Scholar]
- Gómez-Guijarro, C., Elbaz, D., Xiao, M., et al. 2022, A&A, 659, A196 [NASA ADS] [CrossRef] [EDP Sciences] [Google Scholar]
- Gordon, K. D., Clayton, G. C., Misselt, K. A., Landolt, A. U., & Wolff, M. J. 2003, ApJ, 594, 279 [NASA ADS] [CrossRef] [Google Scholar]
- Graziani, L., Schneider, R., Ginolfi, M., et al. 2020, MNRAS, 494, 1071 [NASA ADS] [CrossRef] [Google Scholar]
- Guilloteau, S., & Lucas, R. 2000, ASP Conf. Ser., 217, 299 [Google Scholar]
- Hashimoto, T., Inoue, A. K., Mawatari, K., et al. 2019, PASJ, 71, 71 [Google Scholar]
- Heinis, S., Buat, V., Béthermin, M., et al. 2014, MNRAS, 437, 1268 [Google Scholar]
- Heintz, K. E., Brammer, G. B., Watson, D., et al. 2024, A&A, in press, https://doi.org/10.1051/0004-6361/202450243 [Google Scholar]
- Higgins, E. R., Vink, J. S., Hirschi, R., Laird, A. M., & Sabhahit, G. N. 2023, MNRAS, 526, 534 [NASA ADS] [CrossRef] [Google Scholar]
- Imara, N., Loeb, A., Johnson, B. D., Conroy, C., & Behroozi, P. 2018, ApJ, 854, 36 [NASA ADS] [CrossRef] [Google Scholar]
- Inami, H., Algera, H. S. B., Schouws, S., et al. 2022, MNRAS, 515, 3126 [NASA ADS] [CrossRef] [Google Scholar]
- Jin, S., Daddi, E., Magdis, G. E., et al. 2022, A&A, 665, A3 [NASA ADS] [CrossRef] [EDP Sciences] [Google Scholar]
- Jones, A. P., Köhler, M., Ysard, N., Bocchio, M., & Verstraete, L. 2017, A&A, 602, A46 [NASA ADS] [CrossRef] [EDP Sciences] [Google Scholar]
- Kannan, R., Springel, V., Hernquist, L., et al. 2023, MNRAS, 524, 2594 [CrossRef] [Google Scholar]
- Kennicutt, R. C., Jr 1998, ARA&A, 36, 189 [NASA ADS] [CrossRef] [Google Scholar]
- Kim, J., Chevance, M., Kruijssen, J. M. D., et al. 2023, ApJ, 944, L20 [NASA ADS] [CrossRef] [Google Scholar]
- Kokorev, V. I., Magdis, G. E., Davidzon, I., et al. 2021, ApJ, 921, 40 [NASA ADS] [CrossRef] [Google Scholar]
- Koprowski, M. P., Coppin, K. E. K., Geach, J. E., et al. 2018, MNRAS, 479, 4355 [NASA ADS] [CrossRef] [Google Scholar]
- Leslie, S. K., Schinnerer, E., Liu, D., et al. 2020, ApJ, 899, 58 [Google Scholar]
- Li, Z., Dekel, A., Sarkar, K. C., et al. 2024, A&A, 690, A108 [NASA ADS] [CrossRef] [EDP Sciences] [Google Scholar]
- Liu, D., Schinnerer, E., Groves, B., et al. 2019, ApJ, 887, 235 [Google Scholar]
- Magdis, G. E., Daddi, E., Béthermin, M., et al. 2012, ApJ, 760, 6 [NASA ADS] [CrossRef] [Google Scholar]
- Magnelli, B., Boogaard, L., Decarli, R., et al. 2020, ApJ, 892, 66 [NASA ADS] [CrossRef] [Google Scholar]
- Maiolino, R., Scholtz, J., Witstok, J., et al. 2024, Nature, 627, 59 [NASA ADS] [CrossRef] [Google Scholar]
- Marques-Chaves, R., Pérez-Fournon, I., Shu, Y., et al. 2017, ApJ, 834, L18 [NASA ADS] [CrossRef] [Google Scholar]
- Marques-Chaves, R., Pérez-Fournon, I., Gavazzi, R., et al. 2018, ApJ, 854, 151 [Google Scholar]
- Marques-Chaves, R., Pérez-Fournon, I., Shu, Y., et al. 2020a, MNRAS, 492, 1257 [Google Scholar]
- Marques-Chaves, R., Álvarez-Márquez, J., Colina, L., et al. 2020b, MNRAS, 499, L105 [Google Scholar]
- Marques-Chaves, R., Schaerer, D., Álvarez-Márquez, J., et al. 2021, MNRAS, 507, 524 [NASA ADS] [CrossRef] [Google Scholar]
- Marques-Chaves, R., Schaerer, D., Álvarez-Márquez, J., et al. 2022, MNRAS, 517, 2972 [CrossRef] [Google Scholar]
- Marques-Chaves, R., Schaerer, D., Vanzella, E., et al. 2024, A&A, 691, A87 [NASA ADS] [CrossRef] [EDP Sciences] [Google Scholar]
- Martins, F., & Palacios, A. 2022, A&A, 659, A163 [NASA ADS] [CrossRef] [EDP Sciences] [Google Scholar]
- Martins, F., Schaerer, D., Marques-Chaves, R., & Upadhyaya, A. 2023, A&A, 678, A159 [NASA ADS] [CrossRef] [EDP Sciences] [Google Scholar]
- Mason, C. A., Treu, T., Dijkstra, M., et al. 2018, ApJ, 856, 2 [Google Scholar]
- Matsuoka, Y., Onoue, M., Kashikawa, N., et al. 2018, PASJ, 70, S35 [Google Scholar]
- McMullin, J. P., Waters, B., Schiebel, D., Young, W., & Golap, K. 2007, ASP Conf. Ser., 376, 127 [Google Scholar]
- Menon, S. H., Burkhart, B., Somerville, R. S., Thompson, T. A., & Sternberg, A. 2024, arXiv e-prints [arXiv:2408.14591] [Google Scholar]
- Messa, M., Dessauges-Zavadsky, M., Adamo, A., Richard, J., & Claeyssens, A. 2024, MNRAS, 529, 2162 [CrossRef] [Google Scholar]
- Meštrić, U., Vanzella, E., Upadhyaya, A., et al. 2023, A&A, 673, A50 [NASA ADS] [CrossRef] [EDP Sciences] [Google Scholar]
- Meurer, G. R., Heckman, T. M., & Calzetti, D. 1999, ApJ, 521, 64 [Google Scholar]
- Mirocha, J., & Furlanetto, S. R. 2023, MNRAS, 519, 843 [Google Scholar]
- Mitsuhashi, I., Tadaki, K.-I., Ikeda, R., et al. 2024, A&A, 690, A197 [NASA ADS] [CrossRef] [EDP Sciences] [Google Scholar]
- Naidu, R. P., Oesch, P. A., van Dokkum, P., et al. 2022, ApJ, 940, L14 [NASA ADS] [CrossRef] [Google Scholar]
- Ouchi, M., Shimasaku, K., Akiyama, M., et al. 2008, ApJS, 176, 301 [Google Scholar]
- Patrício, V., Richard, J., Verhamme, A., et al. 2016, MNRAS, 456, 4191 [Google Scholar]
- Peng, C. Y., Ho, L. C., Impey, C. D., & Rix, H.-W. 2002, AJ, 124, 266 [Google Scholar]
- Pettini, M., Steidel, C. C., Adelberger, K. L., Dickinson, M., & Giavalisco, M. 2000, ApJ, 528, 96 [Google Scholar]
- Popping, G., Somerville, R. S., & Galametz, M. 2017, MNRAS, 471, 3152 [NASA ADS] [CrossRef] [Google Scholar]
- Popping, G., Pillepich, A., Calistro Rivera, G., et al. 2022, MNRAS, 510, 3321 [CrossRef] [Google Scholar]
- Popping, G., Shivaei, I., Sanders, R. L., et al. 2023, A&A, 670, A138 [NASA ADS] [CrossRef] [EDP Sciences] [Google Scholar]
- Pozzi, F., Calura, F., Fudamoto, Y., et al. 2021, A&A, 653, A84 [NASA ADS] [CrossRef] [EDP Sciences] [Google Scholar]
- Pozzi, F., Calura, F., D’Amato, Q., et al. 2024, A&A, 686, A187 [NASA ADS] [CrossRef] [EDP Sciences] [Google Scholar]
- Quider, A. M., Pettini, M., Shapley, A. E., & Steidel, C. C. 2009, MNRAS, 398, 1263 [Google Scholar]
- Quider, A. M., Shapley, A. E., Pettini, M., Steidel, C. C., & Stark, D. P. 2010, MNRAS, 402, 1467 [Google Scholar]
- Reddy, N. A., & Steidel, C. C. 2009, ApJ, 692, 778 [Google Scholar]
- Reddy, N. A., Oesch, P. A., Bouwens, R. J., et al. 2018, ApJ, 853, 56 [NASA ADS] [CrossRef] [Google Scholar]
- Rémy-Ruyer, A., Madden, S. C., Galliano, F., et al. 2014, A&A, 563, A31 [Google Scholar]
- Roberts-Borsani, G., Treu, T., Shapley, A., et al. 2024, arXiv e-prints [arXiv:2403.07103] [Google Scholar]
- Robson, I., Priddey, R. S., Isaak, K. G., & McMahon, R. G. 2004, MNRAS, 351, L29 [NASA ADS] [CrossRef] [Google Scholar]
- Santini, P., Maiolino, R., Magnelli, B., et al. 2010, A&A, 518, L154 [NASA ADS] [CrossRef] [EDP Sciences] [Google Scholar]
- Sargent, M. T., Daddi, E., Béthermin, M., et al. 2014, ApJ, 793, 19 [NASA ADS] [CrossRef] [Google Scholar]
- Schaerer, D., Guibert, J., Marques-Chaves, R., & Martins, F. 2024, A&A, submitted [arXiv:2407.12122] [Google Scholar]
- Schneider, R., & Maiolino, R. 2024, A&ARv, 32, 2 [NASA ADS] [CrossRef] [Google Scholar]
- Schreiber, C., Elbaz, D., Pannella, M., et al. 2018, A&A, 609, A30 [NASA ADS] [CrossRef] [EDP Sciences] [Google Scholar]
- Schruba, A., Kruijssen, J. M. D., & Leroy, A. K. 2019, ApJ, 883, 2 [NASA ADS] [CrossRef] [Google Scholar]
- Senchyna, P., Stark, D. P., Vidal-García, A., et al. 2017, MNRAS, 472, 2608 [NASA ADS] [CrossRef] [Google Scholar]
- Shapley, A. E., Steidel, C. C., Pettini, M., & Adelberger, K. L. 2003, ApJ, 588, 65 [Google Scholar]
- Shibuya, T., Ouchi, M., & Harikane, Y. 2015, ApJS, 219, 15 [Google Scholar]
- Shu, Y., Bolton, A. S., Kochaneket, C. S., et al. 2016, ApJ, 824, 86 [NASA ADS] [CrossRef] [Google Scholar]
- Silverman, J. D., Daddi, E., Rodighiero, G., et al. 2015, ApJ, 812, L23 [NASA ADS] [CrossRef] [Google Scholar]
- Silverman, J. D., Rujopakarn, W., Daddi, E., et al. 2018, ApJ, 867, 92 [NASA ADS] [CrossRef] [Google Scholar]
- Sobral, D., Matthee, J., Darvish, B., et al. 2015, ApJ, 808, 139 [Google Scholar]
- Sobral, D., Santos, S., Matthee, J., et al. 2018a, MNRAS, 476, 4725 [Google Scholar]
- Sobral, D., Matthee, J., Darvish, B., et al. 2018b, MNRAS, 477, 2817 [Google Scholar]
- Solomon, P. M., Downes, D., Radford, S. J. E., & Barrett, J. W. 1997, ApJ, 478, 144 [NASA ADS] [CrossRef] [Google Scholar]
- Sommovigo, L., Ferrara, A., Pallottini, A., et al. 2022, MNRAS, 513, 3122 [NASA ADS] [CrossRef] [Google Scholar]
- Speagle, J. S., Steinhardt, C. L., Capak, P. L., & Silverman, J. D. 2014, ApJS, 214, 15 [Google Scholar]
- Stanway, E. R., & Eldridge, J. J. 2018, MNRAS, 479, 75 [NASA ADS] [CrossRef] [Google Scholar]
- Stefanon, M., Bouwens, R. J., Labbé, I., et al. 2022, ApJ, 927, 48 [CrossRef] [Google Scholar]
- Stefanon, M., Bouwens, R. J., Labbé, I., et al. 2023, ApJ, 943, 81 [NASA ADS] [CrossRef] [Google Scholar]
- Tacconi, L. J., Genzel, R., & Sternberg, A. 2020, ARA&A, 58, 157 [NASA ADS] [CrossRef] [Google Scholar]
- Trinca, A., Schneider, R., Valiante, R., et al. 2024, MNRAS, 529, 3563 [NASA ADS] [CrossRef] [Google Scholar]
- Upadhyaya, A., Marques-Chaves, R., Schaerer, D., et al. 2024, A&A, 686, A185 [NASA ADS] [CrossRef] [EDP Sciences] [Google Scholar]
- Utomo, D., Sun, J., Leroy, A. K., et al. 2018, ApJ, 861, L18 [NASA ADS] [CrossRef] [Google Scholar]
- Valentino, F., Magdis, G. E., Daddi, E., et al. 2020, ApJ, 890, 24 [Google Scholar]
- Valentino, F., Fujimoto, S., Giménez-Arteaga, C., et al. 2024, A&A, 685, A138 [NASA ADS] [CrossRef] [EDP Sciences] [Google Scholar]
- van der Wel, A., Franx, M., van Dokkum, P. G., et al. 2014, ApJ, 788, 28 [Google Scholar]
- Vanzella, E., Castellano, M., Bergamini, P., et al. 2022, A&A, 659, A2 [NASA ADS] [CrossRef] [EDP Sciences] [Google Scholar]
- Vanzella, E., Claeyssens, A., Welch, B., et al. 2023, ApJ, 945, 53 [NASA ADS] [CrossRef] [Google Scholar]
- Viero, M. P., Sun, G., Chung, D. T., Moncelsi, L., & Condon, S. S. 2022, MNRAS, 516, L30 [NASA ADS] [CrossRef] [Google Scholar]
- Vijayan, A. P., Clay, S. J., Thomas, P. A., et al. 2019, MNRAS, 489, 4072 [NASA ADS] [CrossRef] [Google Scholar]
- Weibel, A., Oesch, P. A., Barrufet, L., et al. 2024, MNRAS, 533, 1808 [NASA ADS] [CrossRef] [Google Scholar]
- Weingartner, J. C., & Draine, B. T. 2001, ApJ, 548, 296 [Google Scholar]
- Whitekar, K. E., Franx, M., Leja, J., et al. 2014, ApJ, 795, 104 [NASA ADS] [CrossRef] [Google Scholar]
- Whitekar, K. E., Alexandra Pope, A., Cybulski, R., et al. 2017, ApJ, 850, 208 [NASA ADS] [CrossRef] [Google Scholar]
- Witstok, J., Jones, G. C., Maiolino, R., Smit, R., & Schneider, R. 2023, MNRAS, 523, 3119 [NASA ADS] [CrossRef] [Google Scholar]
- Xiao, M.-Y., Wang, T., Elbaz, D., et al. 2022, A&A, 664, A63 [NASA ADS] [CrossRef] [EDP Sciences] [Google Scholar]
- Xiao, M. Y., Oesch, P., Elbaz, D., et al. 2024, arXiv e-prints [arXiv:2309.02492] [Google Scholar]
- Zanella, A., Daddi, E., Magdis, G., et al. 2018, MNRAS, 481, 1976 [Google Scholar]
- Zheng, Z.-Y., Malhotra, S., Rhoads, J. E., et al. 2016, ApJS, 226, 23 [Google Scholar]
- Ziparo, F., Ferrara, A., Sommovigo, L., & Kohandel, M. 2023, MNRAS, 520, 2445 [NASA ADS] [CrossRef] [Google Scholar]
Appendix A: Figure 1 continued
All Tables
Far-infrared dust continuum observations (ALMA band 6) and rest-frame UV/optical ground-based observations.
All Figures
|
Fig. 1. Images showing the FIR dust continuum emission, the H- or Ks-band continuum emission, the CO(3–2) or CO(4–3) emission, and the related spectra (if CO is detected) of our 12 extreme starburst galaxies ordered by increasing redshift from top to bottom. Left panels: 23″ × 23″ ALMA band 6 1.3 mm (240 GHz) FIR dust continuum images of our targeted galaxies. Contour levels start at ±4σ and are in steps of 1σ up to 10σ and in larger steps above. The respective synthesised beam size and orientation are indicated by the red filled ellipse in the bottom-left corner. The cross in each panel corresponds to the coordinates of the HAWK-I continuum emission peak (except for J0850+1549 and J0121+0025 for which we consider, respectively, the CFHT MegaCam and Subaru continuum emission peak) and is ±3″ in size. Middle-left panels: 10″ × 10″ VLT HAWK-I seeing-limited H-band or AO Ks-band images of our starburst galaxies in greyscale with the ALMA band 6 FIR dust continuum contours overlaid in red. For J0850+1549 and J0121+0025, we show, respectively, the CFHT MegaCam and Subaru seeing-limited R-band images. Contour levels start at ±4σ and are in steps of 2σ, except for J0146–0220, J1249+1550, and J0850+1549 where contour levels are the same as in the left panels. The PSF is shown by the black filled circle in bottom-left corner, and the ALMA synthesised beam by the red filled ellipse in the bottom-right corner. The cross is the same as in the left panels. Middle-right panels: 10″ × 10″ ALMA CO(3–2) or CO(4–3) velocity-integrated intensity moment-0 maps of our galaxies. The maps were integrated over the cyan-shaded spectral channels shown in the right panels. Contour levels start at ±4σ and are in steps of 1σ. The respective synthesised beam size and orientation are indicated by the red filled ellipse in the bottom-right corner. The cross is the same as in the other panels. Right panels: ALMA CO(3–2) or CO(4–3) emission line spectra of our galaxies, plotted when detected, in steps of ∼ 45 km s−1 and with the zero velocity centred on the redshifts derived from optical nebular emission lines (Table 1). The cyan-shaded regions correspond to the velocity channels optimising the CO detections, as described in Sect. 3.1. The dashed orange lines correspond to the RMS noise level of spectra. The solid red lines are the multi-component Gaussian best-fits to the observed CO line profiles. The vertical bars mark the positions of the fitted Gaussian components. The rest of the figure is available in Appendix A. |
| In the text | |
|
Fig. 2. Comparison of the unobscured SFRUV (uncorrected for dust attenuation) and obscured SFRIR of our galaxies, colour-coded by redshift. The majority of our galaxies is dominated by the unobscured SFRUV, such that the corresponding obscured fractions of star formation range between fobscured < 14% and 42%, and is above 50% for three galaxies only. The dashed line traces the one-to-one relationship. |
| In the text | |
|
Fig. 3. Infrared excess as a function of the UV spectral slope of our galaxies, colour-coded by redshift. Our galaxies are all characterised by very blue βUV < −1.8 and low IRX < + 0.5. Most of them deviate from the canonical IRX–βUV relation (solid line; Meurer et al. 1999), and are better reproduced with the bluer intrinsic UV continuum slope β0 = −2.62 as computed by Reddy et al. (2018) for the SMC (dashed line) and Calzetti et al. (2000) (dotted line) extinction curves. |
| In the text | |
|
Fig. 4. Molecular gas mass as a function of the total (unobscured plus obscured) star-formation rate of our galaxies, colour-coded by redshift. The filled circles correspond to Mmolgas determined with |
| In the text | |
|
Fig. 5. Molecular gas depletion timescale (left) and molecular gas mass fraction (right) as a function of the redshift of our galaxies shown by the red filled circles. Similarly to Fig. 4, the dotted red segments represent the range of possible tdepl and fmolgas measurements of our galaxies as derived with CO-to-H2 conversion factors sampling values from |
| In the text | |
|
Fig. 6. Dust mass as a function of the stellar mass of our extreme starburst galaxies, colour-coded by redshift. Our galaxies agree with the Mdust–Mstars relation derived by Magnelli et al. (2020) as shown by the solid black line, but are well below the relations of Liu et al. (2019) and Kokorev et al. (2021) shown by the dotted and dashed black lines, respectively. The grey shaded zone defines the SN dust production as predicted by Gall & Hjorth (2019), which is barely sufficient to reproduce Mdust of most of our galaxies. The thick dashed-dotted green line defines the start of the AGB star contribution to the dust production (Witstok et al. 2023). |
| In the text | |
|
Fig. 7. Far-infrared dust continuum effective radius as a function of the IR luminosity of our galaxies, colour-coded by redshift. Our extreme starburst galaxies agree better with the Reff, FIR–LIR anti-correlation (light-grey shaded area) found by Jin et al. (2022) than with the Reff, FIR–LIR correlation (dark-grey shaded area) of Fujimoto et al. (2017). |
| In the text | |
|
Fig. 8. Far-infrared dust continuum effective radius (filled circles) and rest-frame UV/optical effective radius (filled stars) as a function of the stellar mass of our galaxies, colour-coded by redshift. All our galaxies have systematically higher Reff, FIR than Reff, UV/opt. As a result, Reff, FIR of our galaxies strongly deviate from the Reff, FIR–Mstars relations of Gómez-Guijarro et al. (2022) at z < 2.5 and z > 2.5, shown by the solid and dashed black lines, respectively, as they are more extended. On the other hand, their Reff, UV/opt agree with the Reff, UV–Mstars relation (blue shaded area) derived for LTG at z ∼ 2.5 by van der Wel et al. (2014). The green shaded area corresponds to the Reff, UV–Mstars relation of z ∼ 2.5 early-type galaxies (ETG; van der Wel et al. 2014). |
| In the text | |
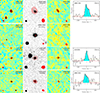 |
Fig. A.1. See Fig. 1 for the description of panels. |
| In the text | |
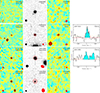 |
Fig. A.2. See Fig. 1 for the description of panels. |
| In the text | |
Current usage metrics show cumulative count of Article Views (full-text article views including HTML views, PDF and ePub downloads, according to the available data) and Abstracts Views on Vision4Press platform.
Data correspond to usage on the plateform after 2015. The current usage metrics is available 48-96 hours after online publication and is updated daily on week days.
Initial download of the metrics may take a while.