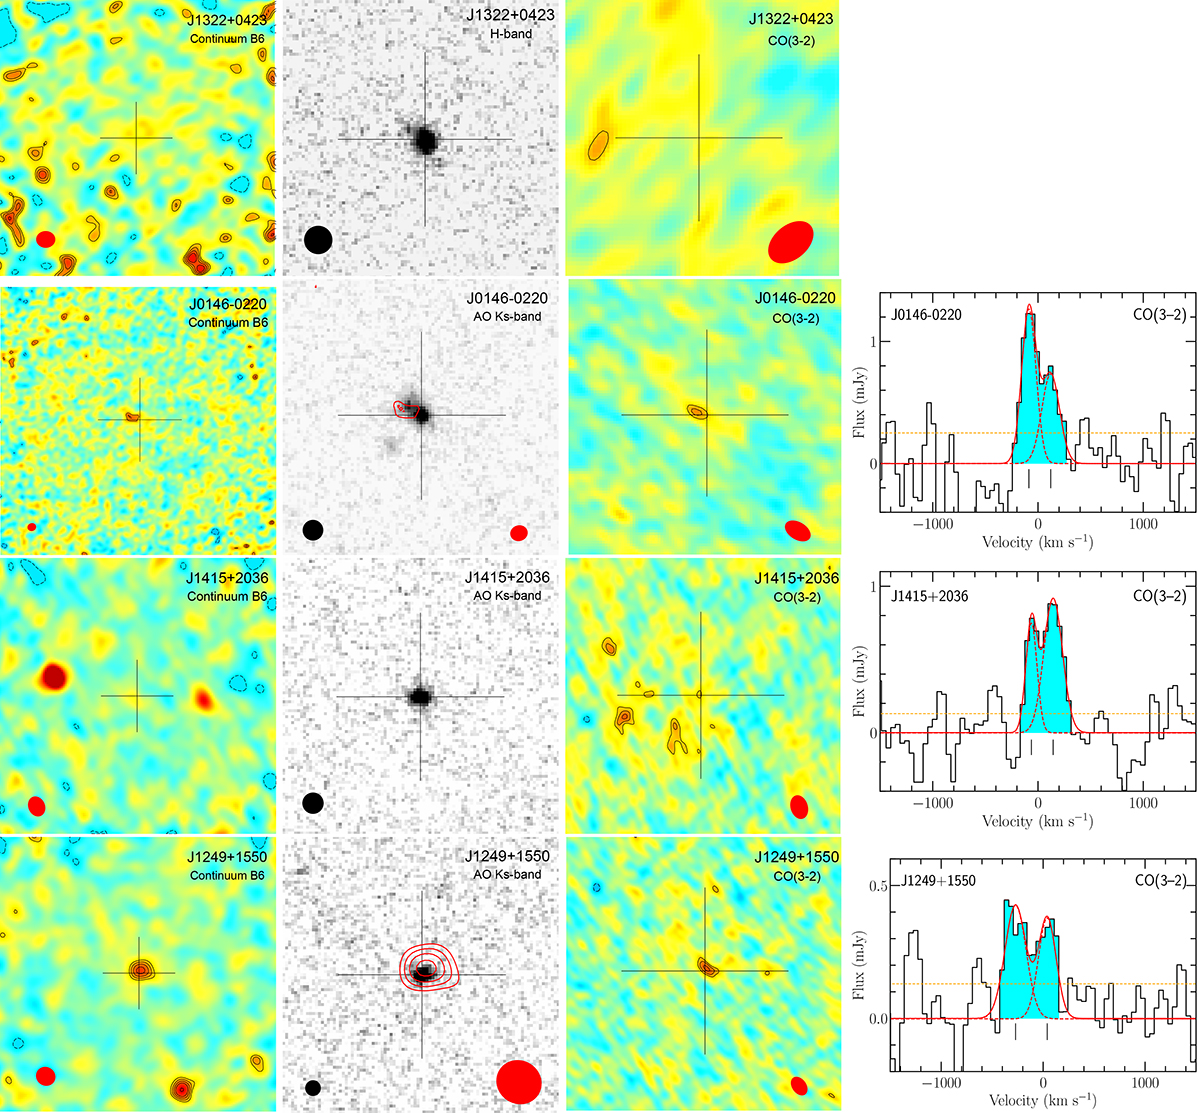
Fig. 1.
Download original image
Images showing the FIR dust continuum emission, the H- or Ks-band continuum emission, the CO(3–2) or CO(4–3) emission, and the related spectra (if CO is detected) of our 12 extreme starburst galaxies ordered by increasing redshift from top to bottom. Left panels: 23″ × 23″ ALMA band 6 1.3 mm (240 GHz) FIR dust continuum images of our targeted galaxies. Contour levels start at ±4σ and are in steps of 1σ up to 10σ and in larger steps above. The respective synthesised beam size and orientation are indicated by the red filled ellipse in the bottom-left corner. The cross in each panel corresponds to the coordinates of the HAWK-I continuum emission peak (except for J0850+1549 and J0121+0025 for which we consider, respectively, the CFHT MegaCam and Subaru continuum emission peak) and is ±3″ in size. Middle-left panels: 10″ × 10″ VLT HAWK-I seeing-limited H-band or AO Ks-band images of our starburst galaxies in greyscale with the ALMA band 6 FIR dust continuum contours overlaid in red. For J0850+1549 and J0121+0025, we show, respectively, the CFHT MegaCam and Subaru seeing-limited R-band images. Contour levels start at ±4σ and are in steps of 2σ, except for J0146–0220, J1249+1550, and J0850+1549 where contour levels are the same as in the left panels. The PSF is shown by the black filled circle in bottom-left corner, and the ALMA synthesised beam by the red filled ellipse in the bottom-right corner. The cross is the same as in the left panels. Middle-right panels: 10″ × 10″ ALMA CO(3–2) or CO(4–3) velocity-integrated intensity moment-0 maps of our galaxies. The maps were integrated over the cyan-shaded spectral channels shown in the right panels. Contour levels start at ±4σ and are in steps of 1σ. The respective synthesised beam size and orientation are indicated by the red filled ellipse in the bottom-right corner. The cross is the same as in the other panels. Right panels: ALMA CO(3–2) or CO(4–3) emission line spectra of our galaxies, plotted when detected, in steps of ∼ 45 km s−1 and with the zero velocity centred on the redshifts derived from optical nebular emission lines (Table 1). The cyan-shaded regions correspond to the velocity channels optimising the CO detections, as described in Sect. 3.1. The dashed orange lines correspond to the RMS noise level of spectra. The solid red lines are the multi-component Gaussian best-fits to the observed CO line profiles. The vertical bars mark the positions of the fitted Gaussian components. The rest of the figure is available in Appendix A.
Current usage metrics show cumulative count of Article Views (full-text article views including HTML views, PDF and ePub downloads, according to the available data) and Abstracts Views on Vision4Press platform.
Data correspond to usage on the plateform after 2015. The current usage metrics is available 48-96 hours after online publication and is updated daily on week days.
Initial download of the metrics may take a while.