Fig. 4.
Download original image
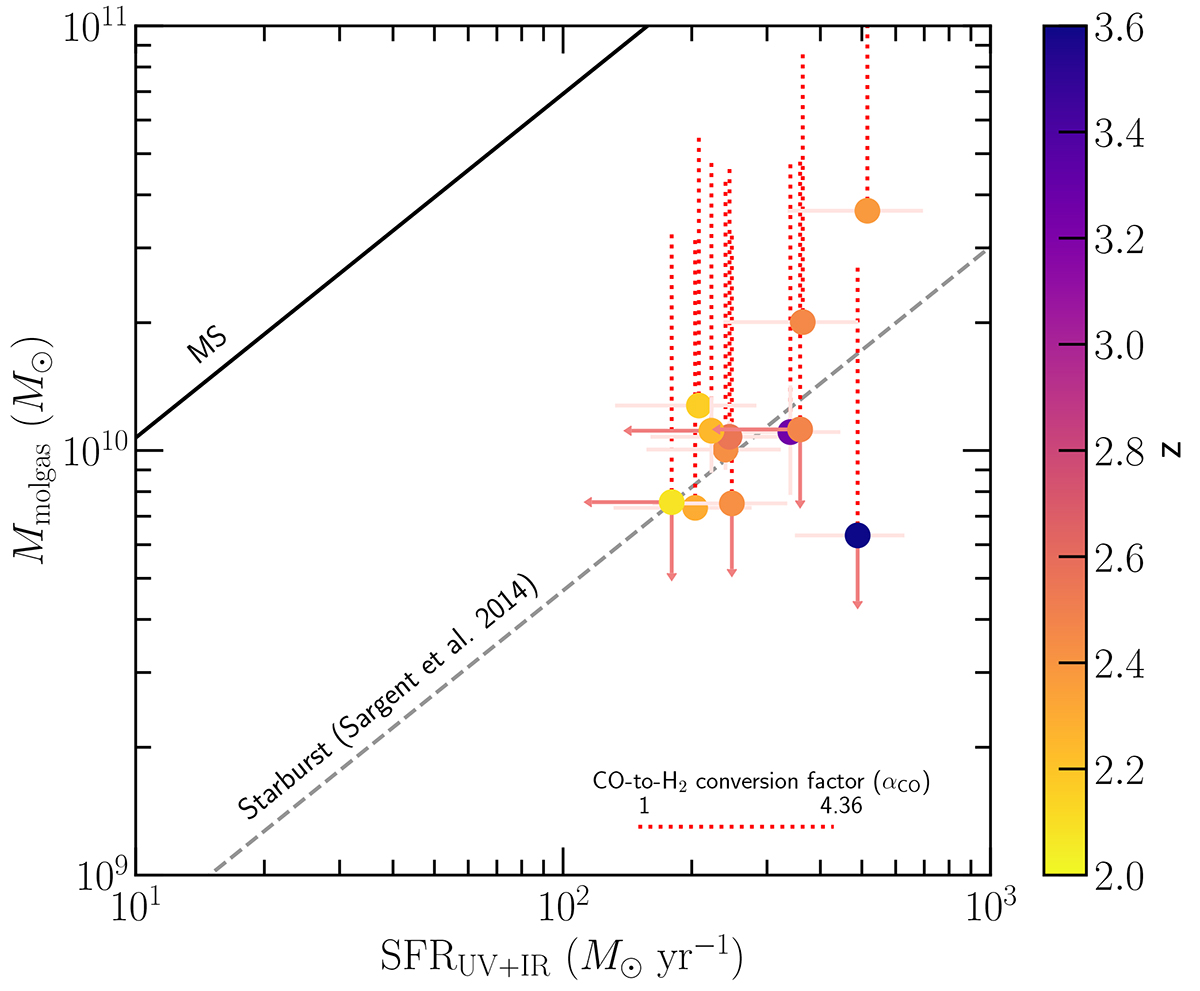
Molecular gas mass as a function of the total (unobscured plus obscured) star-formation rate of our galaxies, colour-coded by redshift. The filled circles correspond to Mmolgas determined with ![]() , and the dotted red segments show the range of possible Mmolgas with higher CO-to-H2 conversion factors up to
, and the dotted red segments show the range of possible Mmolgas with higher CO-to-H2 conversion factors up to ![]() . Whatever αCO, our extreme starburst galaxies have significantly higher SFRUV+IR than MS galaxies at comparable Mmolgas (see the solid line as derived by Sargent et al. 2014). For
. Whatever αCO, our extreme starburst galaxies have significantly higher SFRUV+IR than MS galaxies at comparable Mmolgas (see the solid line as derived by Sargent et al. 2014). For ![]() our galaxies are the first galaxies known at high redshift to reach the starburst Mmolgas–SFR relation (dashed line) offset by > 1 dex from the MS relation, according to the parametrisation of Sargent et al. (2014) based on nearby and z < 0.1 ULIRGs.
our galaxies are the first galaxies known at high redshift to reach the starburst Mmolgas–SFR relation (dashed line) offset by > 1 dex from the MS relation, according to the parametrisation of Sargent et al. (2014) based on nearby and z < 0.1 ULIRGs.
Current usage metrics show cumulative count of Article Views (full-text article views including HTML views, PDF and ePub downloads, according to the available data) and Abstracts Views on Vision4Press platform.
Data correspond to usage on the plateform after 2015. The current usage metrics is available 48-96 hours after online publication and is updated daily on week days.
Initial download of the metrics may take a while.