Fig. 5.
Download original image
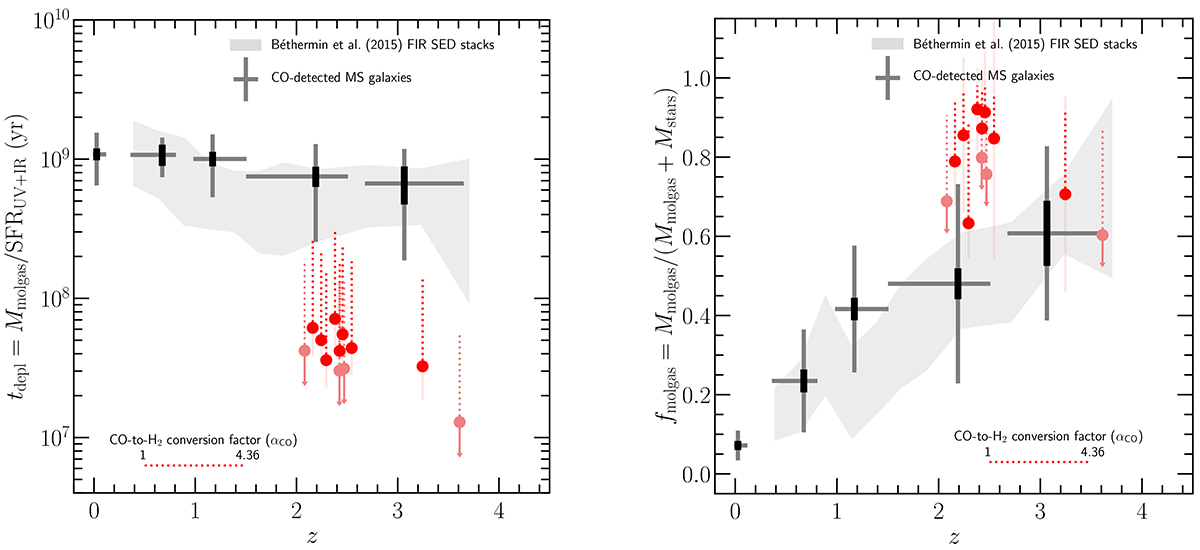
Molecular gas depletion timescale (left) and molecular gas mass fraction (right) as a function of the redshift of our galaxies shown by the red filled circles. Similarly to Fig. 4, the dotted red segments represent the range of possible tdepl and fmolgas measurements of our galaxies as derived with CO-to-H2 conversion factors sampling values from ![]() to
to ![]() . The ttepl and fmolgas means, errors on the means, and standard deviations obtained for the CO-detected MS galaxies from the compilation of Dessauges-Zavadsky et al. (2020) are shown by the black/grey crosses in five redshift bins 0 < z < 0.1, 0.1 < z < 1, 1 < z < 1.5, 1.5 < z < 2.5, and 2.5 < z < 3.7. The light-grey shaded area corresponds to ttepl and fmolgas derived by Béthermin et al. (2015) from the FIR SED stacks of MS galaxies. For all MS galaxy measurements compiled here, the same
. The ttepl and fmolgas means, errors on the means, and standard deviations obtained for the CO-detected MS galaxies from the compilation of Dessauges-Zavadsky et al. (2020) are shown by the black/grey crosses in five redshift bins 0 < z < 0.1, 0.1 < z < 1, 1 < z < 1.5, 1.5 < z < 2.5, and 2.5 < z < 3.7. The light-grey shaded area corresponds to ttepl and fmolgas derived by Béthermin et al. (2015) from the FIR SED stacks of MS galaxies. For all MS galaxy measurements compiled here, the same ![]() conversion factor is assumed. Our extreme starburst galaxies have significantly shorter tdepl than those measured in MS galaxies at any redshift (left). This indicates that they are vigorously consuming their molecular gas mass reservoir to build up their stellar mass. On the other hand, they have very high fmolgas (right), in excess with respect to MS galaxies at similar redshifts, showing that their mass remains dominated by the molecular gas mass over the stellar mass.
conversion factor is assumed. Our extreme starburst galaxies have significantly shorter tdepl than those measured in MS galaxies at any redshift (left). This indicates that they are vigorously consuming their molecular gas mass reservoir to build up their stellar mass. On the other hand, they have very high fmolgas (right), in excess with respect to MS galaxies at similar redshifts, showing that their mass remains dominated by the molecular gas mass over the stellar mass.
Current usage metrics show cumulative count of Article Views (full-text article views including HTML views, PDF and ePub downloads, according to the available data) and Abstracts Views on Vision4Press platform.
Data correspond to usage on the plateform after 2015. The current usage metrics is available 48-96 hours after online publication and is updated daily on week days.
Initial download of the metrics may take a while.