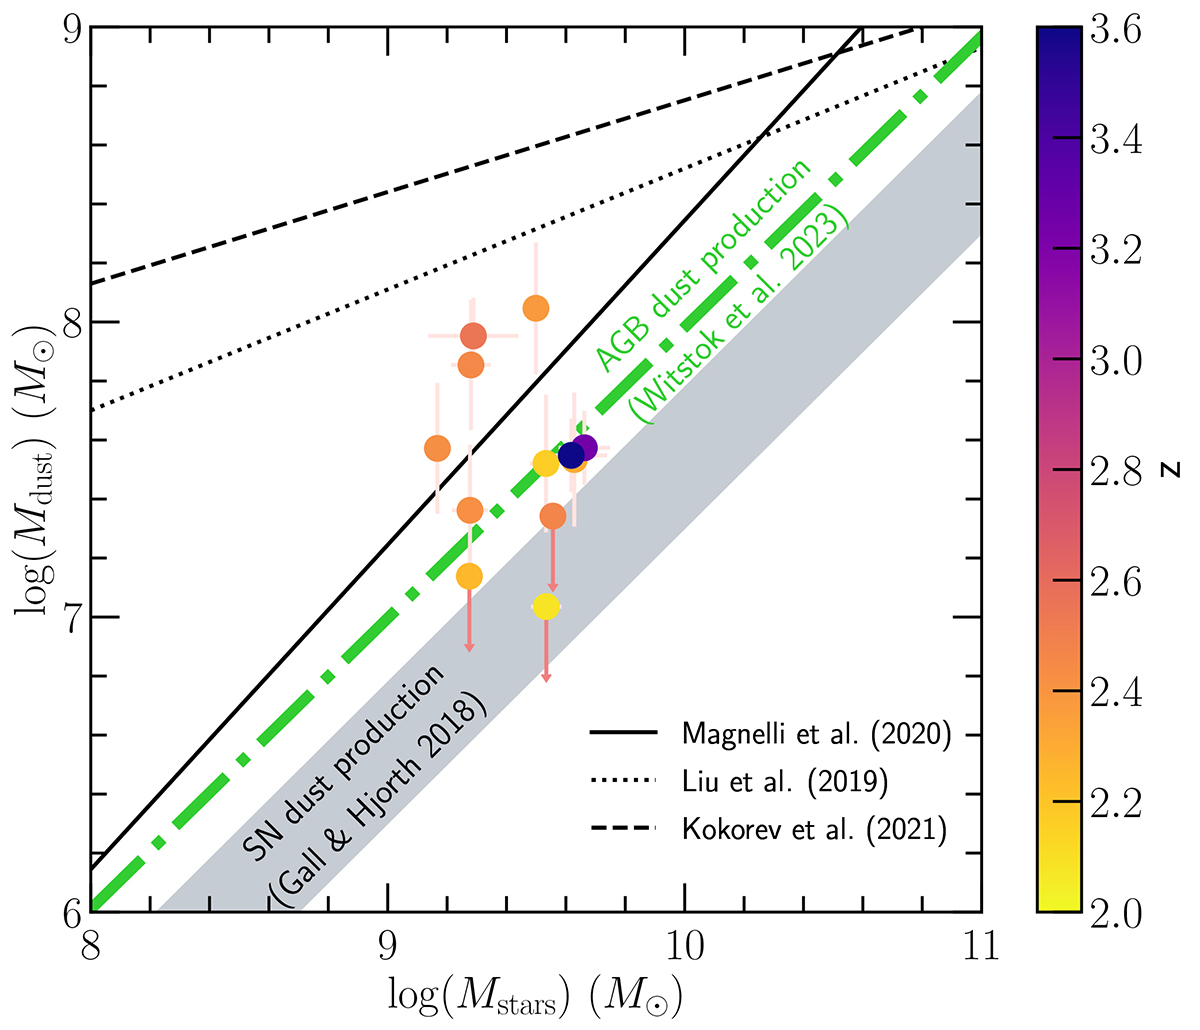
Fig. 6.
Download original image
Dust mass as a function of the stellar mass of our extreme starburst galaxies, colour-coded by redshift. Our galaxies agree with the Mdust–Mstars relation derived by Magnelli et al. (2020) as shown by the solid black line, but are well below the relations of Liu et al. (2019) and Kokorev et al. (2021) shown by the dotted and dashed black lines, respectively. The grey shaded zone defines the SN dust production as predicted by Gall & Hjorth (2019), which is barely sufficient to reproduce Mdust of most of our galaxies. The thick dashed-dotted green line defines the start of the AGB star contribution to the dust production (Witstok et al. 2023).
Current usage metrics show cumulative count of Article Views (full-text article views including HTML views, PDF and ePub downloads, according to the available data) and Abstracts Views on Vision4Press platform.
Data correspond to usage on the plateform after 2015. The current usage metrics is available 48-96 hours after online publication and is updated daily on week days.
Initial download of the metrics may take a while.